WEST WYALONG SOLAR FARM - SOCIO AND ECONOMIC IMPACT ASSESSMENT - Cloud Object Storage ...
←
→
Page content transcription
If your browser does not render page correctly, please read the page content below
WEST WYALONG SOLAR
    FARM
    SOCIO AND ECONOMIC IMPACT
    ASSESSMENT

FINAL
PREPARED FOR LIGHTSOURCE DEVELOPMENT SERVICES AUSTRALIA
URBIS STAFF RESPONSIBLE FOR THIS REPORT WERE:
Director                    Clare Brown
Associate Director          Lucy Band and Ryan McKenzie
Consultant                  Isabelle Kikirekov and Jack Unicomb Laird
Report Number               Final

© Urbis Pty Ltd
ABN 50 105 256 228

All Rights Reserved. No material may be reproduced without prior permission.

You must read the important disclaimer appearing within the body of this report.

urbis.com.au

CONTENTS

TABLE OF CONTENTS
Executive Summary ............................................................................................................................................. i
1.      Introduction ........................................................................................................................................... 1
1.1.    Assessing Socio-Economic Impacts ..................................................................................................... 1
1.1.1. Social impacts ....................................................................................................................................... 1
1.1.2. Economic impacts ................................................................................................................................. 1
2.      The Proposal......................................................................................................................................... 2
2.1.    Site context ........................................................................................................................................... 2
3.      Policy context ........................................................................................................................................ 4
4.      Socio-Economic Baseline ..................................................................................................................... 6
4.1.    Implications for this assessment ........................................................................................................... 7
5.      Stakeholder and Community Consultation ........................................................................................... 8
5.1.    Consultation activties ............................................................................................................................ 8
5.2.    Consultation key findings ...................................................................................................................... 8
6.      Review of technical studies .................................................................................................................. 9
7.      Assessing Social Impact ..................................................................................................................... 12
7.1.    Level of impact .................................................................................................................................... 12
7.2.    Likelihood ............................................................................................................................................ 12
7.3.    Cumulative impacts............................................................................................................................. 12
8.      Social Impact Assessment .................................................................................................................. 13
8.1.1. Increased renewable energy production ............................................................................................ 13
8.1.2. Increased pressure on local infrastructure and services .................................................................... 13
8.1.3. Cumulative impacts of major development in Bland Shire ................................................................. 14
9.      Assessing Economic Impact ............................................................................................................... 16
9.1.    Type of Impact .................................................................................................................................... 16
9.2.    Economic Modelling ............................................................................................................................ 16
10.     Economic Impact Assessment............................................................................................................ 17
10.1. Direct and Indirect Employment.......................................................................................................... 17
10.2. Other Economic Benefits .................................................................................................................... 19
10.2.1. The Local Region ................................................................................................................................ 19
10.2.2. Retail Spend ....................................................................................................................................... 23
10.2.3. Short-Term Accommodation ............................................................................................................... 24
10.2.4. Private Rental Market ......................................................................................................................... 25
11.     Conclusion .......................................................................................................................................... 28
11.1. Recommendations .............................................................................................................................. 28
Disclaimer ........................................................................................................................................................ 29

Appendix A                Community profile
Appendix B                Population projections

URBIS
WEST WYALONG SEIA_JANUARY 2019_FINAL
URBIS
WEST WYALONG SEIA_JANUARY 2019_FINAL
EXECUTIVE SUMMARY
Urbis Pty Ltd. (Urbis) was engaged by Lightsource Development Services Australia to prepare a Socio-
Economic Impact Assessment (SEIA) in relation to the West Wyalong Solar Installation (the proposed
development), located at 228-230 Blands Lane West Wyalong, New South Wales (NSW).
The proposed development is a State Significant Development (SSD). This assessment has been
undertaken to fulfil the requirements of the Secretary’s Environmental Assessment Requirements (SEARs),
issued on 8 November 2018. This assessment specifically addresses the need to consider:
Socio-Economic – including an assessment of the likely impacts on the local community and a consideration
of the construction workforce accommodation.
ASSESSING SOCIAL AND ECONOMIC IMPACT
A SEIA is a specialist study undertaken to identify, analyse, manage and monitor the direct and indirect
social and economic impacts associated with a proposed development.
Social impacts
Social impacts are consequences, both positive and negative, experienced by people due to changes
associated with a proposed development. This may include changes to people’s way of life, their culture,
community, environment, health and wellbeing, personal and property rights, and their fears and
aspirations.1
Identified social impacts are assessed by considering the consequence of the impact and the likelihood of
the impact occurring.
Economic impacts
Economic impact of the proposal identifies and measures the direct and indirect economic activity associated
with the construction and ongoing operations of a proposed project, and can be measured in terms of:
Direct and indirect jobs associated with the construction and ongoing operation of a project.
Direct and indirect Gross Value Added (GVA), associated with the supply chain and consumption effects
of a project.
In addition to this, there are a number of other economic impacts to do with the labour force:
Identifying the opportunity for workers within Bland LGA to be employed on a project.
The capacity within the local housing market to accommodate temporary construction workforce.
Retail spend of temporary construction workers.
Economic impacts are measured by employment and GVA, an economic measure of economic activity.
SUMMARY OF IMPACTS
Table 1 summarises the socio-economic impacts identified in relation to the proposed development, as well
as planned management measures and additional recommendations.
Management measures are designed to reduce negative impacts and enhance positive impacts. This SEIA
identifies planned management measures which have or will be undertaken as part of the proposed
development.
Recommendations are additional management measures which are not included as part of the proposed
development but are included for further consideration.
1
Adapted from the International Association for Impact Assessment.
URBIS
WEST WYALONG SEIA_JANUARY 2019_FINAL EXECUTIVE SUMMARY iTable 1 – Summary of socio-economic impacts
Socio-Economic Description of Impact Planned Management Recommendations
Impact Measures
Increased supply of The proposed development will deliver a long-term positive Non-identified. Non-identified.
renewable energy and impact for NSW residents by increasing the supply of
reduction in emissions. renewable energy to the energy grid and help to reduce
harmful carbon emissions.
Increased employment During the peak construction period there will be up to 300 Non-identified. Non-identified.
and economic activity employees on-site per day. Urbis have calculated the
during the project’s annual equivalent to 142 direct jobs (based on the
construction phase. project’s capital expenditure) and additional 100 indirect
supply-chain jobs.
The project also has the potential to contribute $51 million
GVA to the economy through the construction phase, and
the potential to support up to $13 million in supply chain
GVA across NSW.
Increased employment During the operational phase there will be three direct Non-identified. Non-identified.
and economic activity ongoing jobs, resulting in an additional five indirect supply-
during the project’s chain jobs.
operational phase.
The operational phase also has the potential to contribute
direct operational GVA of up to $2.1 million, and indirect
supply-chain GVA of $0.5 million per annum supporting
supply businesses.
Increased job There will be an opportunity to employ Bland Shire LGA Non-identified. A local employment strategy to
opportunities for local construction workers, who are currently leaving the LGA optimise job retention within
workers. for work and take up the recently increased unemployed the Bland LGA.
labour force, however overall the analysis in this report
Source remaining workers
suggests a relatively tight labour market.
outside the LGA, where
Given the relatively tight labour market in Bland LGA there
necessary.
will be a need for a proportion of the construction
ii EXECUTIVE SUMMARY URBIS
WEST WYALONG SEIA_JANUARY 2019_FINALSocio-Economic Description of Impact Planned Management Recommendations
Impact Measures
workforce to be temporary workers drawn from outside the
LGA.
It is expected that many of the highly specialised skill-sets
will be sourced outside the LGA.
Increased retail spend, The per capita spend of construction workers has been Non-identified Non-identified
from temporary estimated to be $8,546 per annum per worker ($712 per
construction workers. month per worker).
Based on a 50-100% of the construction workforce being
temporary workers, it is estimated that the workers
(annualised equivalent of 142 workers) during the
construction period will generate between $0.607 million
and $1.214 million in retail expenditure.
This increase in retail spend presents the opportunity to
support local retail trade jobs which decreased by 3.4%
per annum between 2011 and 2016 within the Bland LGA.
Increased demand on The introduction of up to 300 workers per day during peak Stakeholder and A local employment strategy to
local infrastructure and construction represents a 7.9% increase in the combined community consultation help manage the demand for
services during population of West Wyalong and Wyalong. This rapid has been undertaken to accommodation and other
construction. increase is likely to place additional demand on local inform local residents and local services from a large
infrastructure and services and may impact on the amenity businesses of the temporary worker population.
of existing residents through increased waiting times and proposed development.
Undertake additional
reduced stock and availability of services. This impact will
stakeholder and community
be limited to the period of peak construction.
consultation in West Wyalong
to understand capacity of local
services and infrastructure.
Consultation with additional
townships that may be
required to assist in housing
URBIS
WEST WYALONG SEIA_JANUARY 2019_FINAL EXECUTIVE SUMMARY iiiSocio-Economic Description of Impact Planned Management Recommendations
Impact Measures
the temporary workforce
accommodation.
Reduced Within an approximate 1-hour 45-minute drive time of the Non-identified. A local employment strategy to
accommodation subject site there are approximately: reduce the requirement for
capacity during additional accommodation and
1,293 rooms in tourist accommodation, of which
construction. other local services.
151 (12%) are located within West Wyalong.
As of October 2018, there were 335 vacant rooms Engage contractors to source
advertised for rent within the private rental market. short-term accommodation in
In 2016 there were roughly 3,100 unoccupied available tourist and rental
private dwellings within surrounding regions (ABS accommodation.
Census 2016). Consider available
During peak construction periods across the Cowal mine, accommodation when
the proposed Wyalong Solar Farm, and the subject site, finalising construction staging,
there will be a maximum requirement of potentially 925 and the ability to
beds. This would represent 72% of total tourist accommodate the construction
accommodation room supply (assuming one bed per workforce.
room), and 56% of tourist accommodation and private
rental stock.
The 3,100 unoccupied private dwellings identified are not
necessarily available to rent, and would require the
proponent to identify and approach landlords directly.
Cumulative impacts on Based on proposed, planned and operational major Stakeholder and Consideration of construction
infrastructure and development in the Bland Shire the proposed development community consultation staging to minimise cumulative
services, from major is likely to contribute to a cumulative change and impact in has been undertaken to impacts of the construction
development in Bland the local area. inform the local workforce within the Bland
Shire. community of the Shire LGA.
The contribution of the proposal to cumulative visual
proposed development.
impacts or loss of agricultural land is likely to be limited. Future regional planning
The proposed development site is not identified as should consider the
iv EXECUTIVE SUMMARY URBIS
WEST WYALONG SEIA_JANUARY 2019_FINALSocio-Economic Description of Impact Planned Management Recommendations
Impact Measures
Biophysical Strategic Agricultural and a landscape strategy Preparation of a cumulative impacts of solar
has been proposed to minimise any potential visual landscaping strategy to farm development.
impacts. help minimise any
potential visual impacts.
However, it is likely that the proposal may contribute to
cumulative pressure on local infrastructure and services. The site selection avoids
Biophysical Strategic
Agricultural Land.
URBIS
WEST WYALONG SEIA_JANUARY 2019_FINAL EXECUTIVE SUMMARY vCONCLUSION This report addresses the SEARs requirement to assess the socio-economic impacts of the proposed development including an assessment of the likely impacts on the local community and a consideration of the construction workforce. This assessment has found that overall the proposal is very likely to have a long term positive impact for NSW by increasing the supply of renewable energy in NSW and reducing emissions. It will also deliver local employment and economic benefits to Bland Shire LGA. There will a period during construction of increased pressure on local services, infrastructure and housing, which will be exacerbated by the cumulative impact of other major development in the region. vi EXECUTIVE SUMMARY
1. INTRODUCTION
Urbis Pty Ltd. (Urbis) was engaged by Lightsource Development Services Australia to prepare a Socio-
Economic Impact Assessment (SEIA) in relation to the West Wyalong Solar Installation (the proposed
development) located at 228 – 230 Blands Lane West Wyalong NSW.
The proposed development is a State Significant Development (SSD). This assessment has been
undertaken to fulfil the requirements of the Secretary’s Environmental Assessment Requirements (SEARs),
issued on 8 November 2018. This assessment specifically addresses the need to consider:
Socio-Economic – including an assessment of the likely impacts on the local community and a consideration
of the construction workforce.
1.1. ASSESSING SOCIO-ECONOMIC IMPACTS
A SEIA is a specialist study undertaken to identify, analyse, manage and monitor the direct and indirect
social and economic impacts associated with a proposed development.
1.1.1. Social impacts
Social impacts are consequences, both positive and negative, experienced by people due to changes
associated with a proposed development. This may include changes to people’s way of life, their culture,
community, environment, health and wellbeing, personal and property rights, and their fears and
aspirations.2
Identified social impacts are assessed by considering the consequence of the impact and the likelihood of
the impact occurring.
1.1.2. Economic impacts
Economic impact of the proposal identifies and measures the direct and indirect economic activity associated
with the construction and ongoing operations of the proposed project, and can be measured in terms of:
Direct and indirect jobs associated with the construction and ongoing operation of the project
Direct and indirect Gross Value Added (GVA), associated with the supply chain and consumption effects
of the project.
In addition to this, there are several other economic impacts to do with the proposed development’s
construction workforce:
Identifying the opportunity for workers within Bland LGA to be employed on the project
The capacity within the local housing market to accommodate temporary construction workforce
Retail spend of temporary construction workers.
Economic impacts are measured by employment and GVA, an economic measure of economic activity.
2
Adapted from the International Association for Impact Assessment (IAIA).
URBIS
WEST WYALONG SEIA_JANUARY 2019_FINAL INTRODUCTION 12. THE PROPOSAL
The proposed development relates to the construction and operation of a 90 mega-watt (MW) AC PV solar
farm at West Wyalong, central west New South Wales.
Development consent is sought for the construction, operation and decommissioning of the solar farm
comprising:
Construction:
Approximately up to 300 construction workers
Approximately 9-12 months for the construction timing of the proposal
Operation:
Approximately 296,000 panels and associated electrical infrastructure (invertors, transformers,
batteries and substations).
One maintenance shed
Internal access roads and access points
Security fencing around the perimeter of the solar farm
CCTV poles up to 2.5 metres high located along the perimeter of the site
Landscape screening at the site perimeter
Project lifecycle of approximate 30 years, with the option of a 10-year lease extension.
Decommissioning:
Decommissioning timeline of approximately 4 months
Solar panels unscrewed from the mounting frames
Removal of horizontal mounting poles and piles from the ground
Removal of cabling from the ground
Removal of inverters, transformers, battery and switchgear cabinets / housing
Removal of fencing and CCTV equipment
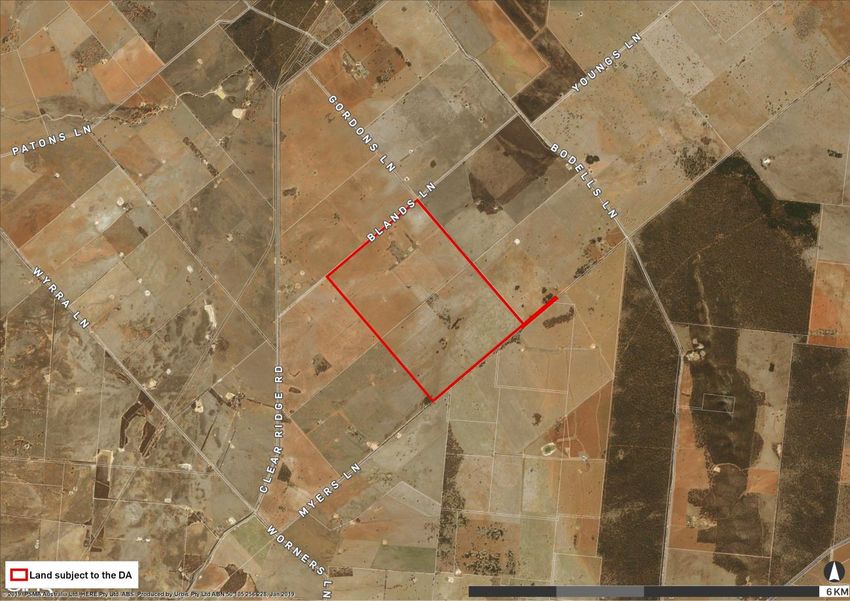
2.1. SITE CONTEXT
The site is located at 228 – 230 Blands Lane and is legally described as Lot 17 and 18 DP753081. The solar
farm infrastructure is located solely on Lot 18 DP753081; site access is provided on Lot 17 DP753081. Lot
18 has an area of 280ha. The figure overleaf outlines the site location.
The site is located north-east of West Wyalong, within the Bland Shire in the north of the Riverina-Murray
region. West Wyalong is the largest town in the Bland Shire LGA, with the smaller town of Wyalong located a
few kilometres to the east.
The site is generally flat and comprises one constructed dam, an ephemeral water channel and clustered
and sporadic vegetation. The surrounding area primarily consists of agricultural land for cropping and
grazing. Further north of the site is an operational gold mine (Cowal Gold Mine) and to the south of the site
there is a site with an undetermined SSD development application (DA) for a 135MW solar farm located
north-east of Wyalong.
2 THE PROPOSAL URBIS
WEST WYALONG SEIA_JANUARY 2019_FINALFigure 1 – Site location Source: Urbis GIS URBIS WEST WYALONG SEIA_JANUARY 2019_FINAL THE PROPOSAL 3
3. POLICY CONTEXT
The following key State and local government policies were reviewed to understand the strategic context of
the site and proposed development:
Australian Renewable Energy Target (2001)
The large-scale renewable energy target (LRET) was introduced by the Australian Government in 2001 to
increase the amount of renewable energy being used in Australia’s electricity supply. The LRET includes
annual targets which require significant investment in new renewable energy generation capacity, with
33,000 gigawatt hours of renewable electricity generation to be met by 2020.
NSW Renewable Energy Action Plan (2013)
The NSW Government released a Renewable Energy Action Plan in 2013 to support the large-scale
renewable energy target (LRET) and guide renewable energy development in NSW. The Renewable Energy
Action Plan adopts 24 actions to achieve the three goals of:
Attracting renewable energy investment.
Building community support.
Attracting and growing renewable energy expertise.
NSW Climate Change Policy Framework (2016)
The NSW Climate Change Policy Framework (2016) (the Policy Framework) outlines the NSW
Government’s long-term objectives to achieve net-zero emissions by 2050 and to make NSW more resilient
to a changing climate.
The Policy Framework includes the implementation of emission savings policies and taking advantage of
opportunities to grow new industries in NSW, such as ‘advanced energy’ and renewable energy solutions.
Riverina Murray Regional Plan 2036 (2013)
The Department of Planning and Environment Riverina Murray Regional Plan 2036 (the Regional Plan)
outlines the 20-year strategic vision for the area to guide the future planning priorities and infrastructure
development in the area. The Regional Plan is structured around four regionally focussed goals with
associated directions and actions to guide delivery. Relevant to this proposal is:
Goal 1 – A growing and diverse economy
Goal 1 outlines priority growth sectors to help achieve a diverse economy. Renewable energy and mining
are listed as a priority growth sector. Key actions to help achieve this goal include to:
Encourage renewable energy projects by identifying locations with renewable energy potential and ready
access to connect with the electricity network.
Promote best practice community engagement and maximise community benefits from all utility-scale
renewable energy projects.
Promote appropriate smaller-scale renewable energy projects using bioenergy, solar, wind, small-scale
hydro, geothermal, or other innovative technologies.
The Regional Plan also establishes priorities for each Council to help them implement the goals set out in
the plan. Key priorities of relevance to this proposal for the Bland Shire LGA include to:
Support the mining and resources sector and associated businesses.
Leverage opportunities from the Shire’s location to support diverse industries, including freight and
logistics industries.
Bland Shire Council Community Strategic Plan 2017 – 2027 (2017)
The Bland Shire Council Community Strategic Plan 2017-2027 (the Strategic Plan) outlines the vision of the
local community and details how Council will achieve this over the next 10 years. The Strategic Plan is
4 POLICY CONTEXT URBIS
WEST WYALONG SEIA_JANUARY 2019_FINALguided by four central themes with associated objectives and strategies to guide delivery. Key objectives and
strategies of relevance to this project include:
Objective 15: Promote the Shire as a place to do business.
Strategies to achieve this include to:
Encourage and actively seek out businesses and industry to relocate within the Shire.
Continue ongoing engagement and communication with the Shire’s existing industry including support
for diversification and alternate industry or business.
Objective 16: Work with our communities and businesses to use our resources in a sustainable way for the
future of the Bland Shire.
Strategies to achieve this include:
Ensure a sustainable environment for current and future generations through effective management and
planning for the long term future by ensuring appropriate land is zoned and available to support business
and industry growth.
Through partnerships with stakeholders foster our education, learning and training industry and increase
employment opportunities within the Shire.
Liaise with utility providers to ensure a quality sustainable service to the community.
The availability of commercial and industrial land, coupled with our geographic location, will be
maximised and marketed to boost economic growth.
South West Slopes Regional Economic Development Strategy
The NSW Government has assisted local councils and their communities to develop 37 Regional Economic
Development Strategies across regional NSW. Each strategy is designed around one or more local
government areas that form a functional economic region as defined by economic data and community input.
The South West Slopes Regional Economic Development Strategy 2018–2022 (the Strategy) sets out a
long-term economic vision and associated Strategy for the Region’s economic development for the five
LGAs comprising Bland Shire Council, Cootamundra-Gundagai Regional Council, Hilltops Council, Temora
Shire Council and Weddin Shire Council. It builds on the endowments and economic strengths and
specialisations of the region to guide investment over the next four years.
In 2016, the Region was home to 45,368 people with the major population centres being Young,
Cootamudra, Temora, West Wyalong, Grenfell, Harden, Gundagai and Boorowa.
People who work in the region typically live in the region, as most LGAs in the region have a high level of
employment self-containment.
Bland Shire has the highest employment self-containment of all LGAs, with only 12 percent of employed
residents working in other LGAs.
Despite this, economic linkages in the major sectors across the Region, such as agriculture, mining,
manufacturing and tourism, underpin the basis for the treatment of the five LGAs as a functional economic
region.
Energy infrastructure was identified as a key strategy, to ensure access to and affordability of energy for
current and future demand for the agricultural and mining sectors.
A new solar farm could help improve the competitiveness of business in the Region, by supplying energy to
new residential estates and business in West Wyalong and surrounding regions.
The reliability of transport infrastructure (particularly with respect to road transport), telecommunications and
energy were identified as major risks for the Region and its major employing and value-add sectors.
URBIS
WEST WYALONG SEIA_JANUARY 2019_FINAL POLICY CONTEXT 54. SOCIO-ECONOMIC BASELINE
Understanding the existing social and economic environment is important in identifying the potential impacts
the proposed development may have. It provides a benchmark against which direct, indirect and cumulative
impacts can be analysed and change can be measured.
4.1. COMMUNITY PROFILE
The following community profile includes a demographic analysis of Wyalong and West Wyalong suburbs,
based on 2016 Australian Bureau of Statistics (ABS) data. For comparison purposes, the suburbs have been
compared to the Bland Shire LGA and Central West Statistical Area 4 (Central West Region). The complete
demographic data set is contained in Appendix A.
Population
The suburbs of Wyalong and West Wyalong are small communities, with a combined population of 3,800
people.
Family and households
Wyalong and West Wyalong are characterised as family areas. The majority of the suburb’s population
live in family households (72.8% and 65.2%) and those families households are predominately couple
families with children (47.3% and 47.4%).
Age
West Wyalong has an older population, with 13.4% of the suburb aged 75 years and over. This is
reflected across Bland Shire LGA with 11% of the population aged 75 years and over, compared to 8.5%
in the Central West Region.
By comparison Wyalong is slightly younger, with only 6.5% of the population aged 75 years and over.
Housing
Wyalong and West Wyalong are characterised by low density housing which is consistent with a rural
area, with more than 90% of the population living in detached dwellings.
The majority of homes in Wyalong (72.3%) and West Wyalong (70.5%) are owned outright or owned with
a mortgage.
Cultural diversity
Wyalong and West Wyalong have low levels of cultural diversity with more than 80% of the
community speaking English only. Between 4.7%-6.5% of the population across the two suburbs identify
as Aboriginal or Torres Strait Islander, which is comparable to the Central West Region (6.4%).
Employment and industry
Wyalong and West Wyalong have strong employment rates compared to the Central West Region.
Only 3.7% of Wyalong and 3.4% of West Wyalong are unemployed, compared to 6.2% in the Central
West Region.
The suburbs are characterised by a trade worker population. In Wyalong and West Wyalong the most
common occupation is Technicians and Trades workers (20.5% and 15.6%).
The main industry of employment is Gold Ore Mining in Wyalong and West Wyalong (10.9%).
Income and disadvantage
SEIFA results indicate the Region is generally disadvantaged, with Wyalong, West Wyalong and
Bland LGA residing in the lowest 30 - 40% of disadvantaged NSW areas.
Both suburbs have slightly lower median household incomes compared to the Central West Region
($1,166).
Population growth
6 SOCIO-ECONOMIC BASELINE URBIS
WEST WYALONG SEIA_JANUARY 2019_FINAL Bland Shire LGA will experience a declining population, with the LGA expected to decline by 1.1%
from 2016 to 2036.
People aged 0 – 14 years will have the greatest decline which will decrease by 350 children (2.7%)
from 2016 to 2036. This decrease in the number of young children suggests the decline in a natural birth
rate and a rise in the ageing population.
4.2. IMPLICATIONS FOR THIS ASSESSMENT
The above community profile indicates that Wyalong and West Wyalong are generally consistent with the
profile of a rural area. Key trends of relevance to this assessment include:
Bland Shire LGA is experiencing an ageing and declining population, which is likely to impact on the
area’s ability to generate a future workforce and economic growth.
The region is moderately disadvantaged, with SEIFA data indicating Wyalong, West Wyalong and Bland
LGA residing in the lowest 30 – 40% of disadvantaged areas in NSW.
Median household incomes are lower than Central West which may impact on individual’s ability to
compete for services.
Most homes are owned outright or with a mortgage, suggesting a permanent population and established
community.
URBIS
WEST WYALONG SEIA_JANUARY 2019_FINAL SOCIO-ECONOMIC BASELINE 75. STAKEHOLDER AND COMMUNITY CONSULTATION
Understanding the views of individuals and communities that are potentially affected by a proposal is an
important part of the SEIA process.
5.1. CONSULTATION ACTIVTIES
Urban Unity were engaged to undertake stakeholder and community consultation for the proposal and
address the requirement of the SEARs. Urban Unity prepared a stakeholder and engagement strategy
including:
Community information booklet.
Local newspaper advert.
Community Information Session.
One-on-one meetings and/or discussions with key stakeholders.
5.2. CONSULTATION KEY FINDINGS
Consultation was undertaken during October and November 2018. The Consultation Outcomes Report
prepared by Urban Unity details the consultation activities undertaken and outlines key questions and
themes raised during the consultation process including:
Questions regarding the viability of two solar farm installations in the region.
Concern regarding the extent of the glare and potential for a heat island effect.
Request for site access from the NSW Free Flight Society (FFS) to retrieve model air craft that may
overshoot into the solar farm boundary.
Clarification regarding the potential impact of increased traffic on the road network surrounding the site.
Queries about the potential impact the energy generated from the solar farm will have on individual
power bills.
8 STAKEHOLDER AND COMMUNITY CONSULTATION URBIS
WEST WYALONG SEIA_JANUARY 2019_FINAL6. REVIEW OF TECHNICAL STUDIES
The following section provides a summary of the technical studies that were reviewed to inform this SEIA.
6.1. TRAFFIC IMPACT ASSESSMENT, ASON GROUP (DEC 2018)
A Traffic Impact Assessment (TIA) was prepared by Ason Group to assess the traffic and transport
characteristics of the proposed development.
Key access intersections are identified in the TIA with particular regard for heavy vehicle trips during the
construction phase. The majority of construction vehicles will use the preferred access route via Newell
Highway – Bodells Lane – Blands Lane for trips between the site and the regional road network. A small
number of truck trips (such as material supplies) may be generated from the south; these vehicles would use
the West Wyalong Heavy Vehicle Bypass for trips between the Newell Highway (south) and Clear Ridge
Road.
Construction staff residing in West Wyalong, Wyalong or other sub-regional centres to the east of the site will
be transported in shuttle buses, using the Newell Highway (east) – Bodells Lane – Blands Lane route. Those
residing in centres to the south during the construction stage would also use shuttle buses but utilise the
Newell Highway (west) – Clear Ridge Road – Blands Lane route to the site.
The TIA makes the following conclusions:
Even during the peak period of construction (Stage 2) the total traffic generation of the site is very
moderate, estimated at 140 daily vehicle trips and up to 46 trips occurring during the AM and PM site
peak periods.
Stage 2 peak flows would be generated over a period of approximately 3 - 4 months only, while the total
construction project would be completed in 9 - 12 months.
The introduction of these peak construction flows would not alter the existing levels of service in the key
roads or at key intersections providing access to the site.
The introduction of these traffic flows would not warrant the upgrade of minor intersections.
Appropriate management conditions can be introduced to ensure that Blands Lane and Bodells Lane are
maintained to an appropriate standard throughout and after the construction period.
The TIA states that once the solar farm is operational, it will generate little traffic on a daily basis. The
small number of staff required during the operational stage will result in the average trip generation to the
site of less than four vehicle trips per day.
6.2. LANDSCAPE AND VISUAL IMPACT ASSESSMENT, URBIS (NOV 2018)
A Landscape and Visual Impact Assessment (LVIA) was undertaken by Urbis to assess the visual impacts of
the proposed development with regard for the day to day visual impacts on people’s views.
The LVIA summarises that the site has a limited degree of visual exposure and overall has a low visual
sensitivity. The proposed development is considered to be able to integrate into the site and would result in
limited reduction to the landscape and visual amenity of the surrounding area. The conclusions made in this
LVIA include:
The proposal can be accommodated into the landscape without significant adverse impacts on the
landscape quality of the surrounding area.
A suitable ‘environmental fit’ can be achieved and the setting is capable of absorbing the proposal in
conjunction with the landscape measures.
The proposal would not significantly detract from the existing landscape character of the primary
production zone.
URBIS
WEST WYALONG SEIA_JANUARY 2019_FINAL REVIEW OF TECHNICAL STUDIES 96.3. ECOLOGY SUMMARY, SLR CONSULTING (OCT 2018)
An Ecology Summary was prepared by SLR Consulting for the purposes of identifying any flora and fauna
species on site. The findings from this Ecology Summary are summarised as follows:
A large diversity of flora and fauna species were identified with over 120 plant species and over 80 fauna
species. The majority of these species occurred centrally in the southern lot within easements adjacent
the property boundaries.
The majority of the site consists of agricultural land which has low ecological value.
No threatened flora species were identified on site.
Two threatened fauna species were identified on the site including:
o Grey-crowned Babbler which is considered vulnerable under the NSW Biodiversity
Conservation Act 2016 (BC Act).
o Painted Honeyeater which is listed as vulnerable under the BC Act and under the
Commonwealth Environment Protection and Biodiversity Conservation Act 1999 (EPBC
Act).
The native vegetation comprises five plant community types (PCTs). These comprise two non-listed PCTs
and three Threatened Ecological Communities (TECs).
6.4. LANDSCAPE CONCEPT DESIGN REPORT, SITE IMAGE LANDSCAPE
ARCHITECTS (DEC 2018)
A Landscape Concept Design Report (Landscape Concept) was prepared by Site Image Landscape
Architects to address the landscape design aspects of the proposal. The Landscape Concept has been
prepared in response to the ecological, visual impact and bushfire assessments and findings.
The Landscape Concept is summarised as follows:
Within the site boundary there is to be a perimeter fire buffer zone at a minimum of 15 metres, clear of any
vegetation.
In the south western corner of the site, there is a 100m flight clearance buffer adjoining the NSW Free
Flight Society which is approximately 1.4km in length.
Boundary landscaping is to be at most five metres in width, for 250m along the north and south west
corner of Blands Lane.
Infill planting is to be installed five metres in width along the remaining site boundaries i.e. remainder of
Blands Lane, Gordon Lane, Myers Lane and the south western boundary landscape is to incorporate
vehicular access around the perimeter of the site and to key internal locations.
Proposed planting species must have a minimum truck clearance of 300mm from the ground and not
overshadow solar panels. The proposed planting species will mostly comprise of dominant species
already found on site, and supplementary planting from a selection of endemic species.
Solar panels are to have pastural grass surrounding and growing underneath, and be maintained through
slashing or grazing.
Maintenance activities are also outlined in the report which includes implementation of a log book to record
when maintenance work has been undertaken and associated actions. Plant replacement, pruning of plants
and adjusting and replacing stakes and ties should occur on a timely basis.
6.5. NOISE IMPACT ASSESSMENT, SLR CONSULTING (DEC 2018)
A Noise Impact Assessment was undertaken by SLR Consulting to determine any potential noise and
vibration emissions during the construction stage and operational noise emissions from transformers,
inverters and general onsite vehicle activity.
6.5.1. Operational Noise
A noise model was developed to predict the proposed operational noise impacts from the proposed
development, with meteorological conditions set to ‘worst-case’ in accordance with the guidelines outlined in
10 REVIEW OF TECHNICAL STUDIES URBIS
WEST WYALONG SEIA_JANUARY 2019_FINALthe report. The main sources of noise associated with the operation are transformers and inverters systems, substation, maintenance activities and noise from the tracking mechanism on the solar panels. The assessment concludes that operational noise emissions associated with the proposed development are expected to comply with the relevant criteria. 6.5.2. Construction Noise A three-dimensional model was prepared to identify the predicted construction noise levels from the receivers surrounding the proposed development. The report nominates the following working hours for construction as: 7:00am – 6:00pm Monday to Friday 8:00am – 1:00pm on Saturdays. The report states that no exceedances of Noise Management Levels (NMLs) during standard daytime hours are predicted at any of the surrounding residential receivers during any the construction works. It is noted that where it is necessary to undertake works outside of standard hours, the noise levels may exceed the NML at some of the surrounding sensitive receivers during the evening and night-time period. Where this happens, a noise management plan should be prepared to manage the impacts. URBIS WEST WYALONG SEIA_JANUARY 2019_FINAL REVIEW OF TECHNICAL STUDIES 11
7. ASSESSING SOCIAL IMPACT
The significance of potential social impacts has been assessed by considering the level of impact (low,
moderate and high) and the likelihood of the impact occurring throughout the project lifecycle.
7.1. LEVEL OF IMPACT
The following criteria is used to assess the level of impact:
Duration – The timeframe over which the impact occurs or the frequency of potential impacts.
Extent – The geographical area or the number of people affected.
Severity – Scale or degree of change from the existing condition as a result of an impact.
Sensitivity – The extent to which people or an environment can adapt to or mitigate the impact.
7.2. LIKELIHOOD
The following outlines a matrix for understanding the likelihood of an impact.
Unlikely – Unlikely that the impact will occur throughout the project lifecycle.
Likely – Likely that the impact will occur throughout the project lifecycle.
Very Likely – Very likely that the impact will occur throughout the project lifecycle.
7.3. CUMULATIVE IMPACTS
Consideration is also given to the proposed development’s potential contribution to cumulative impacts.
Cumulative impacts are changes to the environment that are caused by an action in combination with other
past, present and future human actions.
12 ASSESSING SOCIAL IMPACT URBIS
WEST WYALONG SEIA_JANUARY 2019_FINAL8. SOCIAL IMPACT ASSESSMENT
The following section provides an assessment of the potential social impacts of the proposed development.
8.1.1. Increased renewable energy production
Description of impact Impacted groups
The proposal will increase the production of NSW residents.
renewable energy and contribution to renewable
Energy providers.
energy targets.
Assessment of the impact
• The proposal is for a 90 mega-watt (MW) AC PV solar farm located on a 280 hectare site. The
power created will be fed into the energy grid and will increase capacity on a large scale.
• The proposal is aligned with state and local policy directions to increase renewable energy
production and reduce emissions.
Planned management measure
Non-identified
Summary of impact
The proposal will deliver a long-term positive impact by increasing renewable energy supply to the
Australian energy grid and reduce harmful carbon emissions.
8.1.2. Increased pressure on local infrastructure and services
Description of impact Impacted groups
During construction the temporary workforce Residents and businesses in West Wyalong
population may place additional pressure on the and other townships that may host workforce
local infrastructure and services. accommodation.
Assessment of impact
West Wyalong and Wyalong are regional communities with a combined population of 3,141 and this
population is expected to decline over the next 20 years.
The proposed development will introduce approximately up to 300 workers on site during Stage 2
and Stage 3 of the construction process. The introduction of up to 300 workers during peak
construction represents a 7.9% increase in population for the West Wyalong and Wyalong area.
The construction worker population are likely to require access to local infrastructure and services
during the 9-12 month construction period, including accommodation, hospitality, medical, childcare
and retail. While this increase will have economic benefits, it may also impact the amenity of the
local residents by increasing demand on local services resulting in reduced stock, increased waiting
times and change in local amenity.
As outlined in Section 10.2.3 it has been assessed that there is insufficient accommodation in West
Wyalong to meet the needs of the peak construction workforce.
URBIS
WEST WYALONG SEIA_JANUARY 2019_FINAL SOCIAL IMPACT ASSESSMENT 13Planned management measures
Stakeholder and community consultation has been undertaken to inform the local community and
key stakeholders and provide an opportunity for feedback.
Summary of impact
The introduction of up to 300 workers during peak construction represents a 7.9% increase in population
for the West Wyalong and Wyalong area. This rapid increase is likely to place additional demand on local
infrastructure and services and may impact on the amenity of existing residents through increased waiting
times and reduced stock/availability. This impact will be limited to the period of construction.
8.1.3. Cumulative impacts of major development in Bland Shire
Description of impact Impacted groups
Cumulative impacts of major infrastructure and Residents and businesses in the Bland Shire.
resources projects currently proposed or
operating in proximity to the site.
Assessment of impact
Regional NSW has seen an increase of solar farm projects. In 2017, 10 solar farms were approved
in regional NSW.3 There have also been additional approvals in 2018.
Locally there are number of major developments planned or in operation. In addition to the proposed
development, there is a current proposal by ESCO Pacific for a solar farm 7km northeast of West
Wyalong, that will deliver 350,000 solar panels on 259 hectares. Cowal Mine, located 40km north-
east of West Wyalong has been granted a licence extension to 2032 of and is also seeking an
expansion of its operations
Media coverage of solar development in NSW and QLD has highlighted community concern over the
potential impacts of solar farms on the loss of agricultural land and changes in the visual character
of the landscape. The proposed development site is not identified as Biophysical Strategic
Agricultural Land.
As outlined in Section 10.2.3 it has been assessed that there is insufficient accommodation in West
Wyalong to meet the needs of the peak construction workforce. Given the small size of the rural
town it is reasonable ot assume there would be limited additional capacity in service and facilities.
Planned management measures
Stakeholder and community consultation has been undertaken to inform local residents and
businesses of the proposal development.
Preparation of a landscaping strategy to help minimise any potential visual impacts.
Summary of impact
Based on proposed, planned and operational major development in the Bland Shire the proposed
development is likely to contribute to cumulative changes and impacts in the local area. The contribution of
the proposal to cumulative visual impacts or loss of agricultural land is likely to be limited. The proposed
3
NSW leads nation for solar farms, Ministerial Media Release, February 2018
14 SOCIAL IMPACT ASSESSMENT URBIS
WEST WYALONG SEIA_JANUARY 2019_FINALdevelopment site is not identified as Biophysical Strategic Agricultural and a landscape strategy has been prepared to minimise any potential visual impacts. However, it is likely that the proposal may contribute to cumulative pressure on local infrastructure and services. URBIS WEST WYALONG SEIA_JANUARY 2019_FINAL SOCIAL IMPACT ASSESSMENT 15
9. ASSESSING ECONOMIC IMPACT
9.1. TYPE OF IMPACT
This section identifies the economic benefits that would accrue during the construction and operational
periods of the proposed development. More specifically, this section:
Estimates the direct and indirect construction jobs through the construction phase of development.
Estimates the direct and indirect employment created through the operation of the proposed
development.
Quantifies the direct and indirect gross value add (GVA) through the construction and operational phase
of the project.
Other economic impacts addressed include:
Identifying the opportunity for workers within Bland LGA to be employed on the project.
The capacity within the local housing market to accommodate temporary construction workforce.
Retail spend of temporary construction workers.
9.2. ECONOMIC MODELLING
Modelling included in this report uses REMPLAN to assess current and potential economic impacts.
REMPLAN is an Input-Output model that captures inter-industry relationships within an economy. It can
assess the area-specific direct and flow-on implications across industry sectors in terms of employment,
wages and salaries, output and value-added (Gross Regional Product).
REMPLAN base data is drawn from the Australian Bureau of Statistics and other government agencies. It
provides highly reliable, up-to-date, and defensible economic modelling across any state or region in
Australia.
To effectively model the impacts of the proposed development, we have adopted the following estimates and
assumptions:
• The project has an estimated construction period of 9 - 12 months. For the purposes of modelling the
construction phase economic benefit Urbis have adopted a period of 12-months, assumed to begin in
June 2019.
• Construction costs would be distributed pro-rata across the construction period.
• A peak period consisting of up to 300 employees on-site during the construction stage, with the total
number of construction workers equivalent to 142 direct jobs per annum and additional 100 indirect
supply-chain jobs.
16 ASSESSING ECONOMIC IMPACT URBIS
WEST WYALONG SEIA_JANUARY 2019_FINAL10. ECONOMIC IMPACT ASSESSMENT
10.1. DIRECT AND INDIRECT EMPLOYMENT
10.1.1. Construction Phase Economic Benefits
Construction of the proposed development would require substantial capital investment and employment
over the development period. This investment would sustain significant employment in the construction
industry and have supply chain effects felt through the Bland LGA and NSW economy.
Table 10.1 illustrates the estimated number of jobs that are required during the construction phase, and the
supply chain employment effects generated by the development. We have been informed that the
construction of the solar farm will require up to 300 direct jobs in the peak months of construction.
Table 10.1 shows that the estimated construction phase employment based on the capital investment
required for the construction phase (as detailed in Appendix B – Capital Investment Value Statement),
resulting in up to 142 direct jobs over a 12-month period.
In addition to direct employment, there are supply chain effects felt through the local economy. Specifically,
the 142 direct jobs required to construct the solar farm have the potential to support a further 100 jobs across
the project’s supply chain in the Bland LGA because of increased demand for intermediate goods and
services.
Total employment generated from the construction phase could therefore be up to 242 jobs over the
development timeframe.
Construction Employment Benefit
Proposed developments; 2018 Table 10.1
Construction Phase
Direct Employment2 142 jobs*
Supply Chain Effect Employment across NSW 100 jobs
Total Employment 242 jobs
*Note: 12-month average
Source: 1.Lightsource Development Services Australia; 2.Lightsource Development Services Australia; REMPLAN economy; Urbis
Based on the estimated total construction cost, the proposed development would contribute $51 million
GVA to the economy through the construction phase.
Table 10.2 shows that the development has the potential to support up to $13 million in supply chain GVA
across NSW. Supply chain GVA reflects increased economic activity in supporting and supplying businesses
as a result of construction jobs and output. Over the total construction phase, this could support up to a total
GVA of $64 million.
Construction Gross Value Added (GVA)
Proposed development; 2018 Table 10.2
Total Construction Phase
Estimated Construction GVA $51 million
Supply Chain GVA across NSW $13 million
Total GVA $64 million
Source: REMPLAN economy; Urbis
URBIS
WEST WYALONG SEIA_JANUARY 2019_FINAL ECONOMIC IMPACT ASSESSMENT 1710.1.2. Operational Phase Economic Benefits
When construction of the proposed development is complete, operation of the solar farm will support new
jobs in the form of staff required to operate the facility. This direct employment benefit will also have a direct
GVA benefit and supply chain flow on effects felt through the economy.
Ongoing Employment
Based on an estimate provided by Lightsource Development Services Australia, operation of the proposed
solar farm could require up to three employees on site. Table 10.3 presents the supply chain employment
benefit that could arise as part of the ongoing operation of the facility. The proposed solar farm operations
could support 2 additional jobs in supplying industries throughout the Bland LGA.
Total employment generated from the operational phase could therefore be in the order of five jobs ongoing
throughout operation.
Ongoing Employment Benefit
Operational Phase Table 10.3
Operational Phase
Direct Jobs1 3
Supply Chain Effect Jobs2 2
Total Jobs 5
Source: 1. Lightsource Development Services Australia; 2. REMPLAN economy; Urbis
Ongoing GVA
Table 10.4 illustrates that direct ongoing employment of three jobs at the facility has the potential to support
direct GVA of up to $2.1 million in each year of operation.
This direct employment and economic benefit in turn has the potential to support up to $0.5 million in supply
chain GVA across NSW each year. Supply chain GVA reflects increased economic activity in supporting and
supplying businesses as a result of jobs and output from the facility.
The total economic benefit from the operational phase could therefore be in the order of $2.1 million in GVA
in each year of operation.
Ongoing Gross Value Added (GVA) Benefit
Annually; Operational Phase; 2018 Table 10.4
Operational Phase
Direct Jobs1 3
Direct GVA per year2 $1.6 million
Indirect Jobs 2
Supply Chain GVA per year $0.5 million
Total GVA per year $2.1 million
Source:1. Lightsource Development Services Australia; 2. REMPLAN economy; Urbis
18 ECONOMIC IMPACT ASSESSMENT URBIS
WEST WYALONG SEIA_JANUARY 2019_FINAL10.2. OTHER ECONOMIC BENEFITS In addition to the jobs and economic growth that will be supported during the construction and operational period of the project, the development is also expected to have other economic impacts on the local economy and wider region. This section analyses the wider economic benefits of the proposed development in terms of employment uplift and retail spend generated during the construction and operation of the facility. 10.2.1. The Local Region As outlined in Section 3, the proposed solar farm will be located within the Bland LGA in NSW. Therefore, its economic impacts are likely to be most strongly felt within this region. In order to better understand these impacts, a profile of the region is provided below. Industry Profile The current (2016) industry profile of jobs in the Bland LGA reflects a largely agricultural, mining and retail trade-based region which stands in contrast to overall NSW. The Agriculture, Forestry and Fishing industry provides the largest number of jobs in the Bland LGA (745 jobs), whilst in NSW overall the largest number of jobs is provided by the Health Care and Social Assistance industry (419,986 jobs). Other key industries within the Bland LGA include: 1. Mining (313 jobs in 2016, representing 29% of total jobs). 2. Retail Trade (197 jobs in 2016, representing 8% of total jobs.) 3. Education and Training (193 jobs in 2016, representing 7% of total jobs). Strong job growth between 2011 and 2016 in the Bland LGA was focused in the Rental, Hiring and Real Estate Services industry, increasing by 16.1% per annum (compared to 3.1% per annum in NSW). This job growth indicates that there is strong demand for accommodation within the Bland LGA which could be driven by temporary workers and tourism. Job growth was also experienced in the following industries: 4. Construction (92 jobs to 109 jobs, +3.4% in Bland LGA growth per annum). 5. Administrative and Support Services (29 jobs to 34 jobs, +3.2% in Bland LGA growth per annum). 6. Health Care and Social Assistance (147 jobs to 164 jobs, +2.2% in Bland LGA growth per annum). Overall, jobs growth in the Bland LGA between 2011 and 2016 has lagged behind that of NSW overall (0.4% per annum in Bland LGA vs 2.1% per annum in NSW). There are several key industry sectors within the Bland LGA which have experienced negative growth: 7. Wholesale Trade (79 jobs to 31 jobs, -17.1% growth per annum). 8. Information, Media and Telecommunications (12 jobs to 5 jobs, -16.1% per annum). 9. Electricity, Gas, Water and Waste Services (16 jobs to 7 jobs, -15.2% growth per annum). The requirement of three onsite workers for the proposed solar farm during its operation will provide a boost to the Electricity, Gas, Water and Waste Services industry which has experienced negative job growth between 2011 and 2016. URBIS WEST WYALONG SEIA_JANUARY 2019_FINAL ECONOMIC IMPACT ASSESSMENT 19
You can also read