SMARTGROWTH DEVELOPMENT TRENDS TECHNICAL REPORT 2020
←
→
Page content transcription
If your browser does not render page correctly, please read the page content below
SmartGrowth
 Development Trends

Technical Report 2020
SmartGrowth: Development Trends
     Technical Report 2020

Including Housing and Business Land Indicators
  to meet the monitoring requirements of the
National Policy Statement on Urban Development

         Western Bay of Plenty District
                Tauranga City

                 2019 – 2020

                                                       Prepared by:
                                          Resource Management Team
                                 Policy Planning and Regulatory Group
                             Western Bay of Plenty District Council

                                       City and Infrastructure Planning
                                            Strategy and Growth Group
                                               Tauranga City Council

                                                           March 2021
Table of Contents

Executive Summary................................................................................................................ 1
      Residential Building Activity ...................................................................................................1
      Residential Subdivision Activity ..............................................................................................2
      Residential Development Capacity ..........................................................................................3
      Residential Sales and Rents ...................................................................................................4
      Dwelling Typology ................................................................................................................4
      Business Land and Activity ....................................................................................................5
1     Introduction .................................................................................................................... 6
      National Policy Statement on Urban Development Monitoring ....................................................7
2     Supply and Demand......................................................................................................... 8
      New Dwelling Consents Issued ..............................................................................................8
      New Lots Created............................................................................................................... 11
      Comparison with SmartGrowth Projections ............................................................................ 13
      Growth Rates – Land Availability .......................................................................................... 15
      Occupied/Unoccupied Dwelling Ratio .................................................................................... 17
3     Dwelling Sales Price and Rent Trends ........................................................................... 18
      Dwelling Sales Price............................................................................................................ 18
      Dwelling Rents ................................................................................................................... 19
      Dwellings Sold ................................................................................................................... 20
      Ratio of Dwelling Sales Prices to Rent ................................................................................... 21
      HAM – Housing Affordability Measure ................................................................................... 22
4     Residential section size ................................................................................................. 24
      Tauranga City .................................................................................................................... 24
      Tauranga City urban growth area......................................................................................... 24
      Historical residential section size .......................................................................................... 25
      Western Bay of Plenty District.............................................................................................. 26
      Dwelling density in Tauranga City urban growth areas............................................................ 27
5     Dwelling Typology ......................................................................................................... 28
      Tauranga City .................................................................................................................... 28
      Western Bay of Plenty District.............................................................................................. 29
      Number of storeys.............................................................................................................. 30
      Number of bedrooms.......................................................................................................... 32
      Floor size of dwellings......................................................................................................... 36
      Floor Size per Residential Building ........................................................................................ 38
      Construction Value per Residential Dwelling .......................................................................... 39
      Dwelling Consents Issued by Type ....................................................................................... 40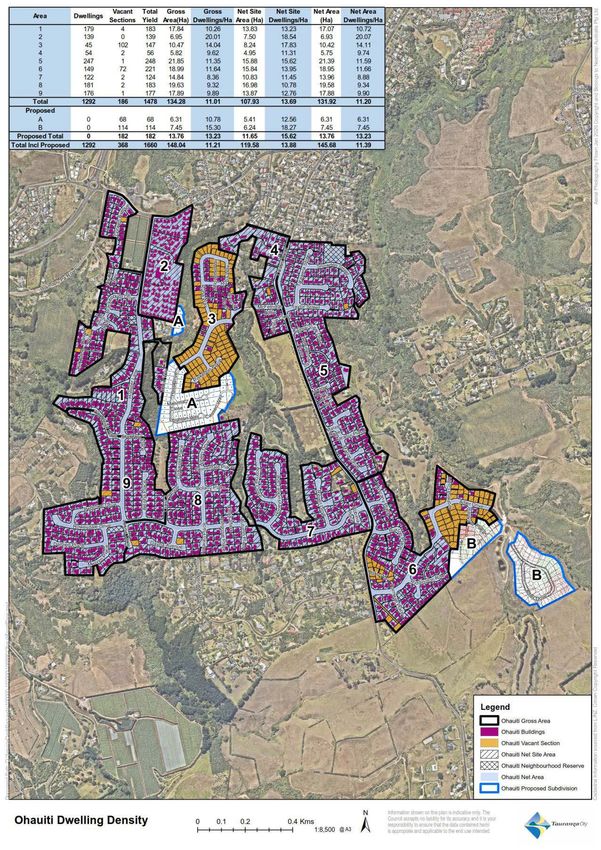
6     Business Land Trends .................................................................................................... 42
      Zoned Business Land .......................................................................................................... 42
      Business Land Capacity....................................................................................................... 47
      Business Land/Population Ratio............................................................................................ 48
      Industrial and Commercial Building Consents Issued .............................................................. 48
      Non-Residential Building Consents Issued by Type ................................................................. 49
      Non-Residential Building Consents by Construction Value........................................................ 50
      Commercial Property Market................................................................................................ 51
7     Current and Future Monitoring Reports ........................................................................ 52
Appendix 1............................................................................................................................ 54
      Explanation of HUD/ MfE Indicators for the National Policy Statement on Urban Development
      Capacity. ........................................................................................................................... 54
Appendix 2............................................................................................................................ 57
      Explanation of Development Terms ...................................................................................... 57
      Subdivision Process ............................................................................................................ 57
      Building Consent Issue for Dwellings .................................................................................... 58
      Residential Growth Areas .................................................................................................... 58
      Vacant Land ...................................................................................................................... 59
Appendix 3............................................................................................................................ 61
      Western Bay of Plenty District Development Map ................................................................... 61
      Tauranga City Development Map.......................................................................................... 62
Appendix 4............................................................................................................................ 63
      Dwelling Occupancy by Census Area Unit – Western Bay of Plenty District and Tauranga City ..... 63
Appendix 5............................................................................................................................ 65
      Western Bay of Plenty District Statistical Area 2 Map .............................................................. 65
      Tauranga City Statistical Area 2 Map..................................................................................... 66
Appendix 6............................................................................................................................ 67
      Tauranga City Commercial and Industry Zoned Areas ............................................................. 67
Appendix 7............................................................................................................................ 68
      Tauranga City Plan Definition of Nett Area ............................................................................ 68
      Calculation of dwelling density ............................................................................................. 68
      Tauranga City Density Maps ................................................................................................ 69
Appendix 8............................................................................................................................ 75
      Western Bay of Plenty District Stage 1 Areas for Urban Growth Area Sequencing....................... 75
Executive Summary
      Executive Summary – July 2019 to June 2020
      Comparison with previous year
                            Indicator                   Tauranga City          Western Bay of Plenty District

                   Dwelling consents issued                      -5%                      -8%

                   New lots created                              -32.4%                   -68.5%

                   Dwelling sales prices                          10%                     9.3%

                   Dwelling rents                                6.6%                     -0.6%

                   Dwellings sold                                -35.6%                   -4.6

                   Mean floor size                               -9m2                     -4m2

                   2-Bedroom dwellings                           -8%                      -1%

                   3-Bedroom dwellings                           14%                      -3.5%

                   Non-residential buildings                     -2%

      Legend:      Up     Same as previous     Down

Residential Building Activity
Sub-region
·   Building consents issued for new dwellings declined by 6% (100 consents) in 2019/2020, in the
    Western Bay of Plenty sub-region compared to the previous year (refer Figure 1).

Tauranga City
·   Dwelling consents issued for the 2019/2020 year increased in Ohauiti, Welcome Bay and Wairakei
    Greenfield Urban Growth Areas from the 2018/2019 results, while it declined in other UGAs (refer
    Table 1).
·   The Greenfield UGAs accommodated 85% of the new dwellings consented in Tauranga City in
    2019/2020, with the number of dwellings declining by 10% from 2018/2019. The infill areas
    accommodated 15% of development in 2019/2020, declining from 26% in 2018/2019, with the
    number of dwelling consents declining by 50% from 336 to 169.

Western Bay of Plenty District - WBOPD

·   Dwelling consents issued increased in both Te Puke (20%) and Katikati (12%) in 2019/2020
    compared to the previous year, while all the other urban areas decreased. Most of the consents were
    issued in Omokoroa with 120 consents for 2019/2020.
·   Dwelling consents issued decreased overall by 34 consents (or 9%) for Western Bay of Plenty District
    (refer to Figure 1).

                                                                                            1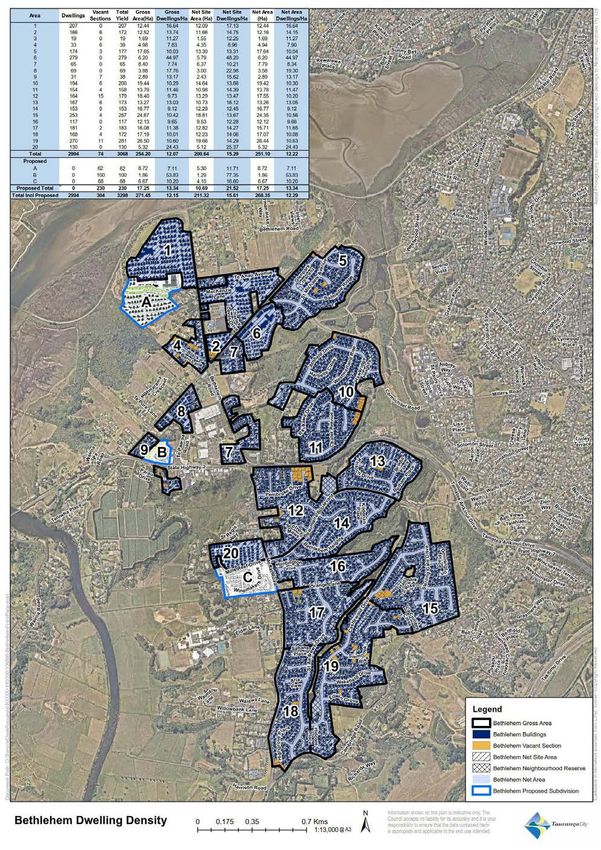
Figure 1 New dwelling consents issued, Western Bay of Plenty sub-region, 1997 to 2020

    In the last ten years, the sub-region recorded its highest number of dwelling consents issued in 2017. From
    that point, dwelling consents issued declined for three consecutive years. From 2018/19 to 2019/20, there was a
    decline of 6% (from 1,706 to 1,606 dwelling consents). I n T a u r a n g a C i t y , t h e d e c l i n e w a s 5% (66
    consents), while Western Bay of Plenty District had a decline of 9% (34 consents).

Residential Subdivision Activity
Sub-region
·     Subdivision development in the sub-region declined by 45% from 2018/2019 results.

Tauranga City

·     The number of additional lots created declined by 32% in 2019/2020 compared to 2018/2019 and
      was 40% below the last 5 year average.
·     In Tauranga City 76% of additional lots were created in Greenfield UGA’s in 2019/2020.

Western Bay of Plenty District

·     The number of new lots created at 224 stage decreased in all the urban growth areas (UGA’s) and
      in all the rural areas, from 2018/2019 to 2019/2020 (refer to table 2).
·     Omokoroa still have the highest number of subdivision consents granted of all the UGA’s and due
      to the staging of subdivision by the developers, more subdivision consents were granted for
      Omokoroa in 2018/2019 (391 consents) compared to 2019/2020 (111 consents).

             2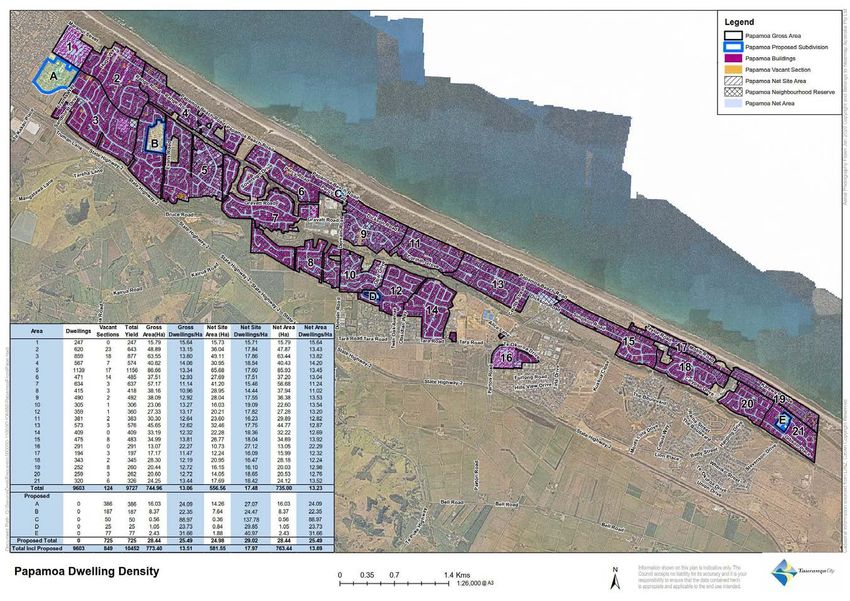
Table 1 Trends Summary – Tauranga City – 2018/2019 Compared to 2019/2020

                           Area                       Dwellings consented   New Lots Created

                                   Bethlehem

                                   Pyes Pa

                                   Pyes Pa West

                                   Ohauiti

                                   Welcome Bay

                                   Papamoa

                                   Wairakei

    Existing Urban Areas (Infill/Intensification)

    Rural Areas

Table 2 Trends Summary - WBOPD (Total) – 2018/2019 Compared to 2019/2020

                            Area                      Dwellings Consented   New Lots Created
                           Waihi Beach

                           Katikati

         Urban Growth      Omokoroa
         Area
                           Te Puke

                           (Other than above)

                           Waihi Beach & Katikati

                           Te Puna / Minden
    Rural Areas
                           Kaimai / Ohauiti-Ngapeke

                           Maketu & Te Puke wards

Residential Development Capacity
Sub-region
·      Compared to the SmartGrowth projections the actual growth at the sub-region level indicated 52 less
       dwelling consents were issued than projected as at 30 June 2020.
·      Of the total estimated yield for the Greenfield UGA’s in the sub-region, 21% capacity remained as at
       30 June 2020.

Tauranga City
·      Dwelling consents issued in Tauranga City was 99 or 9% above the SmartGrowth dwelling projection
       for the year ending 30 June 2020. The dwelling consents issued from July 2018 to end of June 2020
       were also above the SmartGrowth dwelling projections by 4% (or 96) consents.
·      Remaining Greenfield UGA capacity was 22% as at 30 June 2020.
·      Wairakei (Papamoa East) Greenfield UGA has the highest percentage of capacity remaining (56%),
       while Pyes Pa UGA has the least (10%).

                                                                                               3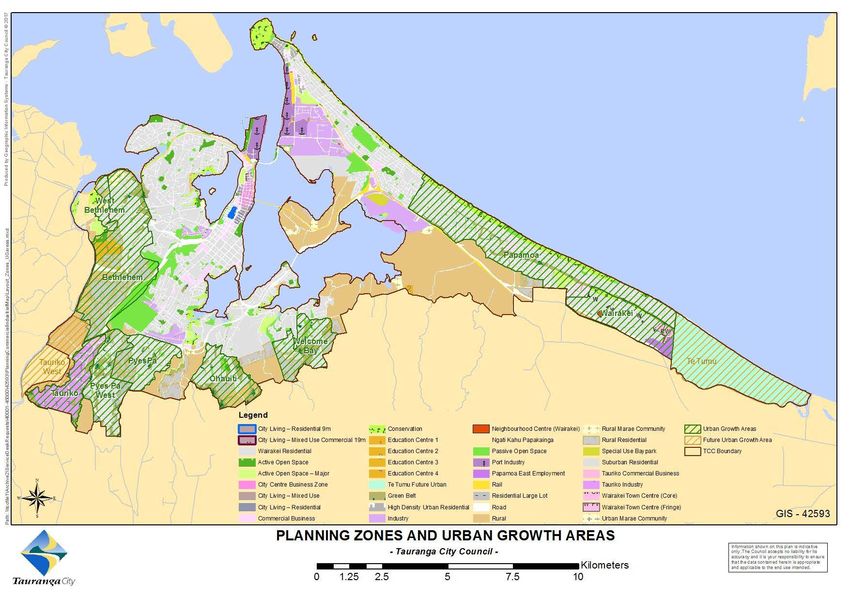
·      Tauranga City has a short term (0-3 years) projected dwelling supply shortfall under two scenarios
       (85% greenfield and 15% infill intensification and 75% greenfield and 25% infill intensification) with
       and without the NPS-UD required 20% “competitiveness margin” applied. A medium term (4-10
       years) shortfall is also projected under both scenarios except for the 75%/25% scenario without
       “competitiveness margin” applied. The medium term yield assumes release of Te Tumu and Tauriko
       West future Greenfield UGAs within this period.

Western Bay of Plenty District
·      In Western Bay of Plenty District 149 less dwelling consents were issued than projected compared to
       the SmartGrowth dwelling projection as at 30 June 2020.
·      Remaining Greenfield UGA capacity was 19% as at 30 June 2020 (refer to Table 7).
·      Omokoroa UGA has the largest remaining capacity available with 32% or 872 dwellings, Katikati UGA
       has the lowest capacity remaining in Western Bay of Plenty District with 10% or 255 dwellings.

Residential Sales and Rents
Tauranga City
·      Average selling price (12 month rolling average) increased by 10% to $696,750 in last 12 months to
       30 June 2020.
·      Average dwelling rent (12 month rolling average) increased by 6.6% to $434 in last 12 months to 30
       June 2020.

Western Bay of Plenty District
·      Average selling price (12 month rolling average) increased by 9.3% from $617,625 in June 2019 to
       $675,116 in June 2020.
·      Average dwelling rent (12 month rolling average) declined by 0.6% to $362 in last 12 months to 30
       June 2020.

Dwelling Typology
Tauranga City
·      The most prevalent lot size range for additional lots created was 326m2 to 500m2, at 46%.
·      Standalone dwellings accounted for 76% of the dwellings consented in Tauranga City. In Wairakei,
       80% of the dwellings consented were standalone dwellings.
·      87% of the dwellings consented in Tauranga City were single level dwellings.
·      58% of the dwellings consented in Tauranga City had 3 bedrooms and 20% had 2-bedrooms. The
       proportion of 4-bedroom dwellings declined from last year’s 23% to 18% this year.
·      49% of all the dwellings consented were 3 bedroom standalone dwellings.
·      65% of the dwellings consented in Tauranga City had floor areas ranging from 101m2 to 175m2.
·      Mean floor size of residential buildings consented decreased from 161m2 in 2018/2019 to 152m2 in
       2019/2020.
·      A higher proportion of dwelling consents were issued in 2019/2020 for “townhouses, flats, units and
       other dwellings” and less for “retirement village units”, “apartments” and standalone “houses” than
       the last 5 year average1.

Western Bay of Plenty District
·      In 2019/2020 all of the dwellings consented in WBOPD were standalone dwellings, minor dwellings
       or units and 88% of them are single storey dwellings (refer to table 16 & 18).

1
    Dwelling typologies are Statistics New Zealand Infoshare classifications.
               4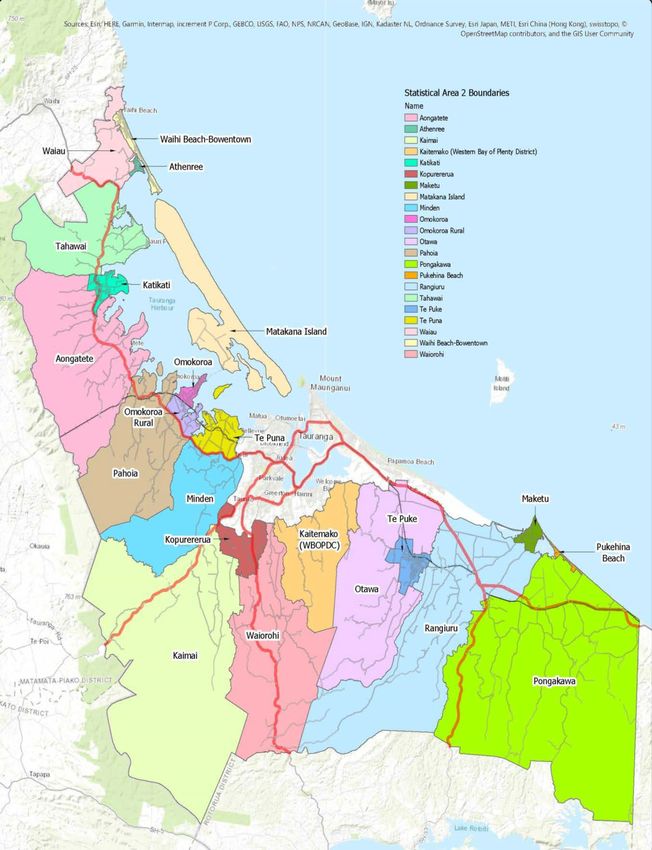
·   Most of the 2-storey dwellings were built in the rural areas (37% or 15 dwellings), followed by
    Omokoroa and Waihi Beach with 29% (12 dwellings) and 27% (11 dwellings) respectively.
·   More than half (53%) of the dwellings consented in Western Bay had 3 bedrooms and 12% had 2
    bedrooms
·   53% of the dwellings consented have a floor area of between 126m² to 200m² (table 23).
·   Mean floor size of residential building consents has decreased by 4m² from 181m2 in 2018/19 to
    177m2 in 2019/2020.
·   More dwelling consents were issued in 2019/2020 for stand alone “houses” and retirement village
    units, and less “townhouses, flats, units and other dwellings”, and standalone “houses” than the last
    5 year average.

Business Land and Activity
Sub-region
·   Vacant industrial zoned land is currently available at Oropi, Te Maunga, Owens Place, Mount
    Maunganui, Tauriko, Sulphur Point, Greerton, Wairakei (Papamoa East), Katikati, Omokoroa, Te
    Puke, Rangiuru and Paengaroa.
·   Vacant commercial land in Greenfield UGA’s is available at Pyes Pa West/Tauriko, Bethlehem,
    Papamoa and Wairakei in Tauranga City and Omokoroa in Western Bay of Plenty.

Tauranga City
·   26 consents were issued for new industrial buildings in 2019/2020 (same as 2018/2019) while 5 less
    commercial buildings were consented in 2019/2020 compared to previous year.

Western Bay of Plenty District
·   Industrial building consents were still slow in 2019/2020 with only one consent issued, while 3
    commercial consents were issued for the same period.

                                                                                            5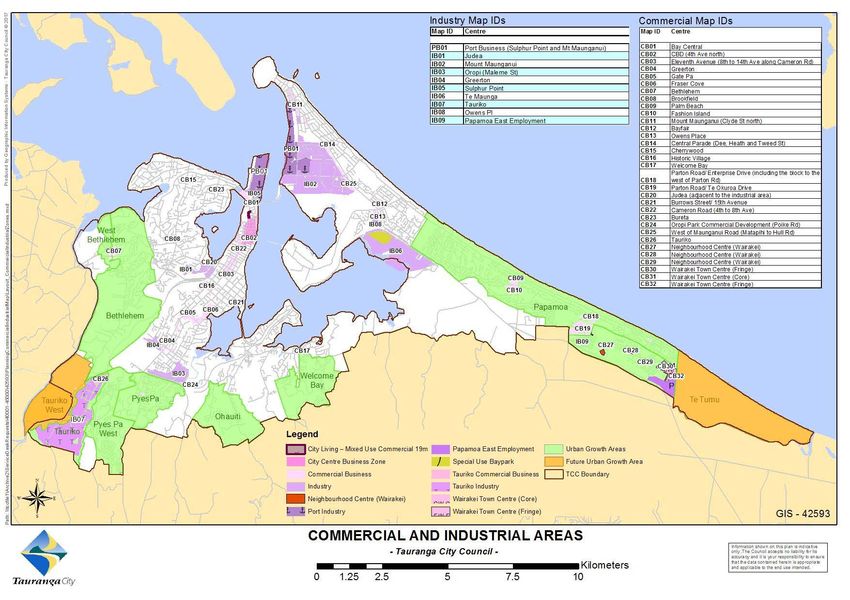
1           Introduction
Monitoring development trends in the Western Bay of Plenty District and Tauranga City assists both
Councils in understanding the changing patterns of development in the sub-region. Councils collect
development statistics as part of obligation to Section 35 of the Resource Management Act 1991, “to
gather information, monitor and keep records”.
This year marks the nineteenth year that development trends have been jointly monitored and reported
by Tauranga City Council and Western Bay of Plenty District Council for the Western Bay of Plenty sub-
region. From 2007, the annual Development Trends Report has incorporated development measures
that relate to the Bay of Plenty Regional Policy Statement (RPS) and SmartGrowth Strategy requirements.
The RPS requires annual reviews to be undertaken to monitor, assess and report on population
distribution, dwelling yields, zoned business land, and the proportion of potential residential allotments
approved. SmartGrowth requires monitoring of uptake rates and land availability for both residential and
business land, permanent versus holiday residences, and rural subdivision as well as a comparison of
actual growth against SmartGrowth projected dwelling growth.
The National Policy Statement on Urban Development Capacity (NPS-UDC), came into effect on 1
December 2016. It classified Tauranga Urban Area (which relates to both Tauranga City and Western
Bay of Plenty District2) as a high growth urban area. The National Policy Statement on Urban Development
(NPS-UD) superseded NPS-UDC effective 20 August 2020.
The NPS-UDC Policy PB6 and PB7 required that high growth Councils monitor a range of indicators on a
quarterly basis including:
a)    prices and rents for housing, residential land and business land, by location and type; and the
      changes in these prices and rents over time;
b)    the number of resource consents and building consents granted for urban development relative to
      the growth in population;
c)    indicators of housing affordability, and
d)    price efficiency
The NPS-UD requires under Section 3.9 “Monitoring Requirements” that every tier 1, 2, and 3 local
authority must monitor, quarterly, the following3:
a)     the supply of dwellings
b)     prices of, and rents for, dwellings
c)     housing affordability
d)     the proportion of housing development capacity that has been realised:
       (i) in previously urbanised areas (such as through infill housing or redevelopment); and
       (ii) in previously undeveloped (ie, greenfield) areas
e) available data on business land.

In relation to tier 1 urban environments, tier 1 local authorities must monitor the proportion of
development capacity that has been realised in each zone with development outcomes that are
monitored.
Every tier 1, 2, and 3 local authority is required to publish the results of its monitoring at least annually.
For the last two years, the SmartGrowth Development Trends Report incorporated a number of relevant
indicators that meet NPS-UDC monitoring requirements (refer table 3), while continuing the development
trends time series data. The report is produced annually for the period 1 July to 30 June.

2
    Western Bay of Plenty District (WBOPD) indicators are displayed for total WBOPD (urban and rural) or only the urban growth
    areas which include Waihi Beach, Katikati, Omokoroa and Te Puke.
3
    Tauranga City and Western BOP District are Tier 1 local authorities under the NPS-UD
              6
The SmartGrowth Technical Implementation Group (TIG) completed a housing and business land
assessment in 20184. The assessment includes information about the range of business uses and dwelling
types, and provides evidence-based estimates of demand and feasible capacity.
SmartGrowth also developed a 30-year Future Development Strategy (FDS) that will drive the discussion
and decision-making needed to manage the expected growth in the sub-region. Public consultation on
the draft Future Development Strategy for Western Bay of Plenty sub-region was completed in 2018. The
information gathered during the consultation was carried through to the Urban Form and Transport
Initiative (UFTI). The UFTI work provides a coordinated approach to future urban development and
transport, and takes precedence over the FDS until the UFTI staged work has been completed.
National Policy Statement on Urban Development Monitoring
To respond to the requirements of the NPS-UDC/UD, staff from the three Councils (Tauranga City Council,
Western Bay of Plenty District Council, Bay of Plenty Regional Council) prepare the report under
SmartGrowth.
The NPS-UDC5 requires the following deliverables (in sequence):
· establishing a monitoring regime (Policies PB6 and PB7);
· undertaking housing and business land assessments;
· setting development capacity targets for housing in statutory (Resource Management Act)
planning documents – i.e. the Bay of Plenty Regional Policy Statement, Tauranga City Plan
and Western Bay of Plenty District Plan; and
· developing (and consulting on) a Future Development Strategy to show how the identified
targets will be met into the long term.
Monitoring and reporting on the NPS-UDC/UD PB6 started in December 2017, while PB7 indicators of
price efficiency were incorporated in the monitoring reports from March 20186. The Ministry of Housing
and Urban Development (HUD) provided guides to support the implementation of the NPS-UDC/UD and
an online dashboard that published charts, maps and underlying data on local housing markets. These
were used as reference in the preparation of the monitoring reports, particularly on housing market
indicators.
Table 3 outlines the indicators that are relevant to the NPS-UDC/NPS-UD monitoring requirements. The
majority of indicators have a residential focus due to the availability of residential data through the HUD
dashboard, and Council records.
Table 3 NPS-UD Indicators Monitored
NPS-UD category Type Topic Indicator Ref
a) Prices of, and rents for, Residential Prices Dwelling Sales Price (Tauranga City and WBOPD’s Urban Areas) p.18
dwellings Prices Dwellings Sold (Tauranga City and WBOPD’s Urban Areas) p.20
Nominal Rents Dwelling (Tauranga City and WBOPD’s Urban p.19
Rents
Areas)
Ratio of Dwelling Sales Prices to Rent (Tauranga City and p.21
Prices/ Rents
WBOPD’s Urban Areas)
Average Floor Size per Residential Building (Tauranga City and p.38
Floor size
total WBOPD)
Average Value per Residential Dwelling Consent (Tauranga City p.39
Prices
and total WBOPD)
Type Building Consents by Type (Tauranga City and total WBOPD) p.40
Detailed Geographic Data on Dwelling Rents (Tauranga City and p.20
Rents
total WBOPD)
4
SmartGrowth Housing and Business Development Capacity Assessment for Tauranga City and WBOPD-Urban. Plans are underway
to develop the 2021 HBA
5
The National Policy Statement on Urban Development Capacity: Guide on Evidence and Monitoring, Ministry of Business,
Innovation and Employment and the Ministry for the Environment (MBIE), June 2017 is still being used per advice from HUD.
6
The quarterly monitoring results for the NPS-UD starting from September 2020 will be included in the annual report for 2020/2021.
7NPS-UD category Type Topic Indicator Ref
Detailed Geographic Data on Dwelling Sale Prices (Tauranga p.19
Prices
City and total WBOPD)
Business Building Consents by Type – Non-Residential (Tauranga City p.49
Type
and total WBOPD)
b) Supply of dwellings Residential New Lots New Lots Created (Tauranga City and WBOPD’s Urban Areas) p.11
Dwelling New Dwelling Consents Issued (Tauranga City and WBOPD’s p.8
Consents Urban Areas)
Dwelling New Dwelling Consents Compared to Dwelling Projections p.13
Consents (Tauranga City and WBOPD’s Urban Areas)
c) Housing affordability Residential Housing Affordability Measure (HAM) – Buy (Tauranga City and p.22
Prices
total WBOPD)
Housing Affordability Measure (HAM) – Rents (Tauranga City p.23
Rents
and total WBOPD)
An explanation of indicators provided via the HUD/MfE guidance or dashboard is provided in Appendix 1,
and referenced under the relevant indicator through the report.
2 Supply and Demand
New Dwelling Consents Issued
Figure 2 Dwelling consents issued, Tauranga City and WBOPD (urban), July 2006 to June 2020
Dwelling consents issued in the urban areas of WBOPD decreased by 8.6% (or 24 consents) from 2018/2019 to
2019/2020 while dwelling consents for total WBOPD decreased by 8.5% (or 34 consents) in the same period. The
decrease is likely to be due to the 5 week lockdown period where dwellings consents were issued but no construction
work was done.
From 2018/19 to 2019/20, building consents issued for new dwellings in Tauranga City declined by 5% (or 66 consents).
Compared to the last five year average this year’s new dwelling consents were 14% lower. In the last ten years, the
lowest annual record for new dwelling consents was in 2010/11 at 470, with a monthly average of 39. The annual
average new dwelling consents in the last ten years was higher by 11% than this year’s record.
8Table 4 Dwelling consents issued in Tauranga City and Western BOPD-total
Dwelling consents Trend Change % Change
Tauranga City
This year 1,239
Last year 1,305 -66 -5.1
Last 5 years (average) 1,440 -201 -13.9
Last 10 years (average) 1,113 126 11.3
Western BOPD – total
This year 367
Last year 401 -34 -8.5
Last 5 years (average) 464 -97 -20.9
Last 10 years (average) 336 31 9.2
Western BOPD – urban
This year 254
Last year 278 -24 -8.6
Last 5 years (average) 293 -39 -13.3
Last 10 years (average) 202 52 25.7
Figure 3 Dwelling consents issued by growth area, WBOPD, 2018 to 2020
Dwelling consents issued in 2019/2020 decreased by 9% in the Greenfield UGA’s and in the rural areas it decreased by 7%,
compared to 2018/2019. Over 70% of the dwelling consents were issued in the urban areas. Dwelling consents issued in
the UGA’s increased in Te Puke (20%) and in Katikati (12%) while all the rural areas decreased compared to the previous
year except in Kaimai/ Waiorohi where it increased by 5 consents.
9Figure 4 New dwelling consents issued by growth area, Tauranga City, 2018 to 2020
In 2019/20, around 85% of the new dwelling consents were issued in the greenfield urban growth areas, with the
remaining 15% issued in the existing urban areas. Dwelling consents issued in greenfield UGAs declined by 10% (or 98
consents) compared to the previous year. The declines were noted in all growth areas except Ohauiti and Welcome Bay
which recorded respective increases of 44 (126%) and 10 (29%) dwellings. The existing urban areas recorded a decline
of 50% of new dwellings from 336 in 2018/19 to 169 dwellings in 2019/20. The dwelling figures (23 townhouses and
97 apartments) for the Farmers redevelopment currently under construction will be counted in future reports when fit
out of the dwellings are consented.
Among the greenfield UGAs, Ohauiti was the only area that had an increase in number of dwellings consented during
the year compared to the last 5-year average, while the existing urban areas recorded a decline of 27% (61 dwelling
consents) during the same period.
10New Lots Created
Figure 5. New lots created, Tauranga City and WBOPD (urban), July 2006 to June 2020
From its peak in 2018/2019, subdivision activity in WBOPD-urban had a significant decline with 69% or 392 less lots
created in UGAs in 2019/20. New lots created in the UGA’s were the lowest in 2014/2015 with an average of 4 new
lots created per quarter, compared to the average of 45 new lots created in 2019/2020. In 2018/2019 most of the
subdivision happened in Omokoroa (Special Housing Area and Kahawai Place) with 391 consents granted, followed
by another 111 consents granted in 2019/2020.
In the last ten years, the number of new lots created in Tauranga City was lowest in 2011/12 at 109 and highest in
2016/17 at 1,723. The new lots created in 2019/20 was lower than the previous year’s by 32% or 344 lots. It was
also lower than the new lots created in other time periods by 40% (last 5 years) and 13% (last 10 years).
Table 5 New lots created, Tauranga City and Western BOPD-Urban
New lots Trend Change % Change
Tauranga City
This year 718
Last year 1,062 -344 -32.4
Last 5 years (average) 1,193 -475 -39.8
Last 10 years (average) 825 -107 -13.0
Western BOPD – Urban
This year 180
Last year 572 -392 68.5
Last 5 years (average) 270 -90 33.4
Last 10 years (average) 151 29 19.3
11Figure 6 Additional lots created by growth area, WBOPD, 2018 to 2020
New lots created declined in all the urban growth and rural areas from the previous year. New lots created in the UGA’s
are still the highest for Omokoroa with 111 lots, followed by Waihi Beach-Bowentown with 24 new lots. In the rural
areas the highest number of new lots created was in the Te Puna/ Minden area with 26 consents. Omokoroa fluctuates
due to the timing of the stages by the 3 larger developers.
Figure 7 Additional lots created growth area, Tauranga City, 2018 to 2020
More than three quarters (76% or 549) of the additional lots during the 2019/2020 year were created in Greenfield UGAs,
while 165 lots or 23% were created in existing urban areas. Subdivision development in the Greenfield UGAS declined by
45% or 442 lots in comparison to 2018/2019, while it increased by 132% or 94 lots in the existing UGAs in the same
period.
12Comparison with SmartGrowth Projections
Detailed population and household projections have been produced for the SmartGrowth region by the
National Institute of Demographic and Economic Analysis (NIDEA), University of Waikato7 in 2014. Since
then the 2018 Census results were released and the NIDEA projections was re-aligned to accommodate
the higher population increase as per Census.
At June 2018, the population for the Western Bay of Plenty sub-region was 195,4008. The population of
the sub-region is projected to increase to 276,300 people (+80,900 people) by 2048, while the number
of dwellings is projected to increase from 78,663 to 113,661 over that period.
Figure 8 Dwelling consents issued compared to SmartGrowth projected growth, WBOP sub-region,
2018 to 2020
Dwelling consents issued in the Sub-region are very close to the dwellings projected. Between 1 July 2018 and 30 June
2020, 53 less new dwelling consents were issued, than projected.
Figure 9 Dwelling consents issued compared to SmartGrowth projected growth, WBOPD, 2018 to 2020
WBOP had 149 less dwelling consents issued than the SmartGrowth projections between 1 July 2018 and 30 June 2020.
.
7
The revised projections were adopted by the SmartGrowth Committee on 28 May 2014 and updated by both Councils in October
2019.
8
SmartGrowth population projections have been rebased to revised Statistics New Zealand Estimated Resident Population (ERPs)
released 22 October 2020
13Figure 10 Dwelling consents issued compared to SmartGrowth projected growth, Tauranga City,
2018-2020
In Tauranga City, the number of dwelling consented between 1 July 2018 and 30 June 2020 were higher than the
SmartGrowth projections by 4% (or 96 dwellings consents).
Figure 11 Dwelling consents issued compared to SmartGrowth projections by growth area, WBOPD,
1 July 2018 to 30 June 2020
In the UGA’s of WBOPD, the actual dwelling consents issued are close to the projections, while the projections (357
dwellings) for the rural areas are much higher than the actual dwelling consents issued of 223 dwellings (-134 dwellings).
14Figure 12 Dwelling consents issued compared to SmartGrowth projections by growth area, Tauranga
City, 1 July 2018 to 30 June 2020
Between July 2018 and June 2020, 96 more dwellings (4%), were consented in Tauranga City compared to current
SmartGrowth Projected allocation. Among the UGAs, Wairakei recorded the biggest increase of 23% or 157 dwellings
consented. Overall, a decline of 21 dwellings or 1% was observed in the UGAs.
In the same period, 36 less dwellings were consented in the infill areas compared to the SmartGrowth projections, although
an increase of 35 dwellings were recorded in the coastal strip.
Growth Rates – Land Availability
SmartGrowth requires that uptake rates and land availability for residential development be monitored.
This is based on zoned residential land across the sub-region.
Tauranga City
Of the operative Greenfield UGA’s, Pyes Pa UGA has the lowest proportion of remaining dwelling capacity
(10%), while Welcome Bay has the lowest remaining dwelling capacity (217 dwellings), refer to Table 6.
Papamoa UGA which has the largest expected yield, has estimated potential for a further 1,458 dwellings.
The majority of these are expected to be constructed in the Maranui Street area which includes the
Mangatawa Block, and at the eastern end of Doncaster Drive in the Parton Road area.
Wairakei UGA in Papamoa East was made operative in May 2011, providing further capacity for an
estimated 5,150 dwellings. At 30 June 2020 it had the largest remaining dwelling capacity (2,903
dwellings) and highest percentage of capacity remaining (56%).
Other Greenfield areas have been identified for future urban development and their suitability is currently
being considered. Te Tumu in Papamoa East and Tauriko West future Greenfield UGA areas are currently
being progressed through structure planning.
By June 2023 it is estimated that capacity for a further 4,444 dwellings will remain in the current operative
Greenfield UGA’s, which is 14% of the total estimated yield of these UGA’s, falling to 1,515 dwellings (or
5% of total yield) by 2030. For the future Greenfield UGA’s it is anticipated that a further 11,000 dwellings
will be added to the yield by 2030, with capacity for a further 8,600 dwellings (or 78%) of this additional
15yield estimated to remain by 2030. It is anticipated that remaining dwelling capacity at Wairakei in 2030
will be mainly for residential activity in and around the Wairakei Town Centre.
An assessment of remaining residential capacity in Tauranga City is provided below (Table 6) for the
short term (next 3 years) and medium term (4 to 10 years). As required by the NPS-UD a 20%
“competitiveness margin” is added on top of projected growth. Two scenarios are assessed, the first
where 85% projected dwelling growth is assumed to be accommodated in Greenfield UGA areas (the
current trend) with the balance (15%) accommodated in the established Infill Intensification parts of the
City, and the second where the split is 75% Greenfield UGA and 25% Infill Intensification. A short term
shortfall is projected under both scenarios with and without the additional 20% “competitiveness margin”
applied. A medium term shortfall is also projected under both scenarios except for the 75% scenario
without “competitiveness margin” applied9. The medium term yield assumes release of Te Tumu and
Tauriko West future Greenfield UGA’s within this period.
Table 6 Dwelling growth rate and projected uptake by urban growth areas in Tauranga City
Short term (3 years) Medium Term (10 years)
Estimated June 2020 Estimated Estimated Estimated Estimated
Greenfield Urban Growth Yield - total dwellings Remaining uptake remaining uptake June remaining
Area (UGA) Total (existing and capacity as June 2020 – capacity at 2023-June capacity at
Dwellings consented) at June 2020 June 2023 June 2023 2030 June 2030
Bethlehem 4,700 3,658 1,042 (22%) 200 842 600 242
Pyes Pa 2,750 2,592 158 (6%) 70 88 80 8
Pyes Pa West 2,500 1,999 501 (20%) 400 101 80 21
Ohauiti 1,800 1,465 335 (19%) 200 135 85 50
Welcome Bay 2,150 1,933 217 (10%) 100 117 100 17
Papamoa 11,900 10,442 1,458 (12%) 500 958 900 58
Wairakei1 5,500 2,247 3,253 (59%) 1,000 2,253 1,400 853
UGA (current) Sub-Total 31,300 24,336 6,964 (22%) 2,470 4,494 3,245 1,249
Te Tumu 2 6,000 1,500 4,500
2
Tauriko West 3,000 1,500 1,500
3
Keenan Road 2,000 2,000
UGA (future) Sub-Total 11,000 3,000 8,000
Greenfields Total 42,300 24,336 6,964 2,470 4,494 6,245 9,249
85% Greenfield/ 15% 75% Greenfield/ 25% Infill
Infill Intensification Intensification
Short term Medium Term Short term Medium Term
Projected Dwellings (Citywide) 3,589 7,882 3,589 7,882
Greenfield UGA Projection 3,051 6,700 2,692 5,912
Greenfield UGA plus 20% NPS-UD Competitiveness Margin 3,661 8,040 3,230 7,094
Estimated Greenfield Dwelling Uptake 2,470 6,245 2,470 6,245
City Shortfall 581 455 222 -334
City Shortfall Including NPS-UD Competitiveness 1,298 2,031 940 1,243
Margin
1
Timing of housing uptake in parts of the Wairakei Town Centre and periphery is dependent on delivery of future infrastructure
and/ or the release of Te Tumu UGA to provide the necessary population scale to support it.
2
Structure planning has commenced. If the release of either of these areas is delayed the medium term shortfall will increase.
3
Currently anticipated to be released in 2028-2033 planning period.
9
Under the NPS-UD a revised Housing and Business and Capacity Assessment (HBA) is to be completed by 31 July 2021. Population and
dwelling projections will be reviewed through this process, including reassessing housing demand and development capacity that is plan-
enabled, infrastructure-ready, and feasible and reasonably expected to be realised to determine whether there is sufficient
development capacity to meet demand for housing in the short, medium and longer term. This information will be updated in 2021 SG
Development Trends report to align with the 2021 HBA.
Faster or slower dwelling uptake than anticipated in Table 6, and in the established infill intensification parts of the City, will reduce or
increase estimated shortfalls.
This assessment is for new dwellings. As sections are created before dwellings are constructed the shortfall for new sections would be
more acute than the shortfall for new dwellings.
16An independent assessment of residential development capacity in Tauranga City identified that the short
and medium term housing shortfall could be significantly higher than the “City shortfall” calculated in
Table 610. It cited factors that constrained uptake of residentially zoned land including the slow release
of some large development blocks or land-banking, topographic or access issues, a lack of infrastructure
in some areas, and complications around land tenure (such as multiply owned Maori land). While these
matters are generally accounted for in the Table 6 allocation, uptake of remaining capacity will continue
to be closely monitored and the dwelling yield estimates and/ or timing adjusted where necessary.
Western Bay of Plenty District
In WBOPD both Te Puke and Waihi Beach UGA’s have the largest design capacity in the District of over
3,500 dwellings. Although Waihi Beach has a large design capacity, it has the lowest remaining capacity
available due to coastal inundation areas.
Omokoroa Stage 1&2 UGA has the largest dwelling capacity remaining in the District (1,025 dwellings),
followed by Waihi Beach-Bowentown UGA with 573 dwellings. Katikati UGA does not include the Park
Road dairy farm and Tetley Road orchard, and that leaves Katikati with only 255 dwelling capacity
remaining (refer to Table 7).
Omokoroa capacity will be increased with the Stage 3 Structure Plan which provides for an additional
2,200 dwellings.
There is still enough availability of land under the NPS-UD 20% “competitiveness margin” for the short
and medium term projected uptake.
Table 7 Dwelling growth rate and projected uptake by urban growth areas in Western Bay of Plenty
District
Short Term - 3 years Medium Term - 10 years
June 2020 Protected Estimated Protected Estimated
Remaining
Total Capacity Total dwellings uptake June remaining uptake June remaining
Urban Growth Area capacity at
(Dwellings) (existing and 2021 – June capacity at 2024 – capacity at
June 2020
consented) 2023 June 2023 June 2030 June 2030
WB-Bowentown/ Athenree 3,553 2,980 573 108 465 66 399
Katikati 2,543 2,288 255 153 102 262 0
Omokoroa – Stages 1 & 2 2,945 1,920 1,025 450 575 1,145 0
Te Puke 3,631 3,071 560 138 422 256 166
Greenfields (current) Sub-Total 12,672 10,259 2,413 849 1,564 1,729 565
Omokoroa - Stage 3 2,200 84 2,116 0 2,116 570 1,546
Greenfields (Future) Sub-Total 2,200 84 2,116 0 2,116 570 1,546
Occupied/Unoccupied Dwelling Ratio
SmartGrowth requires that “permanent” vs. “holiday residences” be monitored. A comparison of Census
night occupied dwelling with unoccupied dwelling counts provides one indication of this. A table outlining
occupied and unoccupied dwelling ratios based on 2018 Census is provided in Appendix 4 and a Statistical
Area 2 (SA2) map is provided in Appendix 511.
Western Bay of Plenty District
In the Western Bay of Plenty District the coastal settlements of Waihi Beach-Bowentown and Pukehina
Beach show the highest ratios of unoccupied dwellings with 57% and 49% respectively, signifying a high
number of holiday homes in these areas, refer to Appendix 4.
10
Western Bay Sub-Region Residential Development Capacity Review, Veros Property Services, May 2019
11
Note: Statistics NZ replaced “Census Area Units” (CAU’s) with “Statistical Area 2” (SA2’s) at 2018 Census. Although the SA2s are
generally the same as CAU’s, the boundaries and names have changed to reflect changes in land use and population patterns
17Other Statistical Areas (Athenree, Waiau, Maketu and Matakana Island) also indicate a relatively high
proportion of non-permanent residences, each between 21% and 28% of homes unoccupied at Census
time. Katikati and Te Puke have the least uncoccupied dwellings available with 7% and 5% respectively.
Tauranga City
For Tauranga City the coastal strip SA2’s of Mount Maunganui North, Omanu, Te Maunga, Papamoa
Beach East, Palm Beach, and Palm Springs all registered an unoccupied dwellings proportion of 9% or
greater on Census night suggesting a higher rate of holiday residence in these areas, refer to Appendix
4. These results correspond with the traditional holiday nature of the coastal strip. Outside the coastal
strip only Tauranga Central, and Sulphur Point SA2’s exceeded 9% unoccupied dwellings.
3 Dwelling Sales Price and Rent Trends
Dwelling Sales Price
In the sub-region, dwelling sales prices increased in the last twelve months to June 2020. In June 2020,
the average dwelling sales prices (12-month rolling average) increased slightly by 1 per cent compared
to the previous quarter. Compared to the same month the previous year, dwelling sales prices were 10%
and 6% higher in Tauranga City and WBOPD, respectively. House prices in the last ten years were almost
double in Tauranga City, while it’s more than 70% higher in WBOPD.
Figure 13 Dwelling sales prices, Tauranga City and WBOPD, 2001/2020
18Table 8 Dwelling Sales Prices (12-month rolling average)
Dwelling Sales Price Trend Change % Change
Tauranga City
June 2020 $696,750
March 2020 $688,250 $8,500 1.2
June 2019 $633,500 $63,250 10.0
June 2016 $483,000 $213,750 44.3
June 2010 $353,663 $343,088 97.0
Western BOPD – Urban
June 2020 $675,116
March 2020 $661,866 $13,250 2.0
June 2019 $617,625 $57,491 9.3
June 2016 $441,482 $233,634 52.9
June 2010 $382,631 $292,485 76.4
In WBOPD-urban, Te Puke had the highest increase in median house price in June 2020 compared to the
same month last year at 6.4%, while Omokoroa increased by 36% compared to June 2018 to June 2020.
In Tauranga City, Pacific View had the highest increase in median house price at 33%, while Tauranga
South had the biggest decline of 12% in the same period.
Figure 14 Dwelling sales prices, June 2020 Figure 15 Change in dwelling sales prices, June 2019
to June 2020
Source: Corelogic – HUD Urban Development Capacity Dashboard
Dwelling Rents
The figure below shows that dwelling rents were relatively stable in Tauranga City in the second half of
2018, but gradually increased in early 2019 to June 2020. In WBOPD, however, dwelling rents declined
from December 2019 to June 2020, with the June 2020 dwelling rent being lower than it was in same
month during the previous year12. It must be noted that these results may not be a true indication of the
rental market as they only reflect properties where bonds have been lodged in the previous 6 months of
12
The market rent information comes from bond data lodged at Tenancy Services.
19the reference quarter. Due to COVID-19 the number of bonds lodged at Tenancy Services was impacted
from March to June 2020. Refer Appendix 1 for an explanation of this indicator.
Figure 16 Dwelling rents, Tauranga City and WBOPD (urban), 2001/2020
Table 9 Dwelling rents Figure 17 Weekly dwellings rents, Tauranga and
Dwelling Rents Trend Change % Change WBOPD, June 2020
Tauranga City
June 2020 $434
March 2020 $427 $7 1.6
June 2019 $407 $27 6.6
June 2016 $365 $69 18.7
June 2010 $300 $134 44.5
Western BOPD – Urban
June 2020 $362
March 2020 $369 -$7 2.0
June 2019 $364 -$2 -0.6
June 2016 $311 $51 16.5
June 2010 $266 $96 36.2
Source: HUD NPS- Urban Development Capacity Dashboard
Dwellings Sold
The housing market was very quiet as expected during the last quarter of the financial year due to
restricted movement because of COVID-19. This was evident in the lower number of houses sold (actual)
in the last twelve months to June 2020, where WBOPD had 881 houses sold while Tauranga City had
2,540 houses sold. These sales were lower than the previous year, by a respective 33% and 13% for
Tauranga City and WBOPD. These were also 60% and 63% below the highest annual sales volume
recorded in 2015/16 for WBOPD and Tauranga City, respectively.
20In WBOPD urban areas, 62 less houses (10%) were sold during the year to June 2020 compared to the
previous period. Refer Appendix 1 for an explanation of this indicator.
Figure 18 Dwellings sold, Tauranga City and WBOPD, 2001 to 2020
Figure 19 Dwellings sold, July 2019 to June 2020 Figure 20 Percentage change in annual dwellings
sold, 2018/19 to 2019/20
Source: Corelogic – HUD Urban Development Capacity Dashboard
Ratio of Dwelling Sales Prices to Rent
The figure below shows the ratio between house prices to mean annual rent. House prices to rent ratio
in the sub-region had increased in the last 20 years. From mid-2016, house prices were 25 times higher
than the mean annual rent. As it was increasing, it’s becoming more affordable to rent than to purchase
a house during these times. Refer to Appendix 1 for an explanation of this indicator.
21Figure 21 Ratio of dwelling sales price to rents, Tauranga City and WBOPD (urban), 2001 to 2020
HAM – Housing Affordability Measure
HAM-Buy
In the last twelve months to December 2018 housing affordability has improved in the sub-region. The
graph and table below shows a declining quarterly proportion of first home buyer households that were
below the benchmark. However, because of the age of this data the measure may not be an accurate
representation of current affordability levels. Refer Appendix 1 for an explanation of this indicator.
Figure 22 HAM-Buy: share of first time home buyer households below the benchmark, 2003 to 2018
22Table 10 HAM Buy
HAM-Buy Trend % Change
Tauranga City
December 2018 84.4%
September 2018 85.3% -0.9
December 2017 85.7% -1.3
December 2014 76.0% 8.4
December 2009 84.7% -0.3
Western BOPD
December 2018 77.1%
September 2018 78.2% -1.1
December 2017 78.7% -1.6
December 2014 68.6% 8.5
December 2009 83.5% -6.4
More affordable Less affordable
Source: Corelogic – HUD Urban Development Capacity Dashboard
HAM Rent
The graph and table below shows an improved HAM-Rent in the sub-region in the last two years to
December 2018. However, the HAM-Rent was lower than HAM Buy at 31 March 2018 in both Tauranga
City and WBOP District, suggesting that it was more affordable to rent than to buy a home. Refer
Appendix 1 for an explanation of this indicator.
Figure 23 HAM-Rent: share of renting households below the benchmark, 2003 to 2018
23Table 11 HAM Rent
HAM-Rent Trend % Change
Tauranga City
December 2018 36.8%
September 2018 37.7% -0.9
December 2017 36.5% 0.3
December 2014 38.4% -1.6
December 2009 38.8% -2.0
Western BOPD
December 2018 30.7%
September 2018 30.8% -0.1
December 2017 28.6% 2.1
December 2014 31.8% -1.1
December 2009 34.0% -3.4
More affordable Less affordable
Source: Corelogic – HUD Urban Development Capacity Dashboard.
4 Residential section size
Tauranga City
From July 2019 to June 2020, 80% of the new lots created in Tauranga City had areas of 500m2 and
below. This is was an increase from the previous year’s proportion of 64%. The remaining 20% of the
new lots created had areas greater than 500m2. The lot size range of 326m2 to 500m2 had the highest
proportion of 46%. This was also higher than the previous year’s proportion of 30% for this lot size.
Table 12 Residential lot/section size for additional lots created in Tauranga City, July 2019 to
June 2020
Residential lot/
Dwelling yield per ha Number of lots/sections Per cent to total
section size (m2)
175 and below 40 & above 10 2
176-325 21-39 232 32
326-500 14-21 331 46
501-750 9-14 94 13
751-1000 7-9 29 4
Above 1000 Below 7 22 3
Total 718 100
Dwelling yield per hectare based on the assumption that 30% of the land is lost to roads and reserves during subdivision
Tauranga City urban growth area
More than three fourths of the new lots created from July 2019 to June 2020 were in the urban growth
areas, and more than three fourths of these lots had areas of 176m2 to 500m2. The prevalent size of lot
in the UGAs was 326m2 to 500m2, except in Bethlehem and Wairakei. Among the UGAs, Bethlehem had
the biggest prevalent lot size of 751m2 to 1000m2 while Wairakei had the smallest prevalent lot size of
176m2 to 325m2.
24Figure 24 Residential lot/section size for additional lots created in Tauranga City, July 2019 to June 2020
Historical residential section size
For all lot sizes, the lower number of lots created this year compared to previous year can be attributed
to reduced availability of zoned land for residential development and the impact of COVID-19 to
residential development activities. It is noted further, that even before the scarcity of residential zoned
land and COVID-19, residential section size in Tauranga City has been getting smaller.
The graphs below show that since July 2014, the number of sections with sizes between 325m2 to 500m2
had been higher than the next larger lot size of 501m2 to 750m2. Similarly, the number of smaller lot size
of 176m2 to 325m2 steadily increased since 2011 reaching its highest point last year. The number of
smaller lot size can be expected to further increase as larger lots are subdivided.
Figure 25 Residential section size in Tauranga City, 2005/06 to 2019/20
25Figure 26 Residential section size in Tauranga City, 2005/06 to 2019/20
Figure 27 Residential section size in Tauranga City, 2005/06 to 2019/20
Western Bay of Plenty District
In 2019/2020 most of the dwellings were built on a smaller section sizes compared to 2018/2019, with
29% of the dwellings built on a section size of 501-750m² (in 2018/2019), while 30% of the dwellings
were built on 326-500m² section size in 2019/2020.
In Katikati and Te Puke more dwellings were consented in 2019/2020 on a section size of 501-750m²
with 23 and 27 dwellings respectively while in Omokoroa more dwellings were consented (53 dwellings)
on a section size of 326-500m².
26Figure 28 Residential section size in WBOPD, 2018/19 to 2019/20
Table 13 Residential lot/section size for dwellings consented in WBOPD, July 2018 to June 2020
2018/2019 2019/2020
Residential lot/section Number of Per cent Number of Per cent
size (m2) lots/sections to total lots/sections to total
175 and below 2 0.7 0 0.0
176-325 30 10.8 7 2.8
326-500 83 29.9 109 42.9
501-750 109 39.2 92 36.2
751-1000 26 9.4 22 8.7
Above 1000 28 10.1 24 9.4
Total 283 100.0 254 100.0
Dwelling density in Tauranga City urban growth areas
The table below shows that among the urban growth areas, Wairakei is currently achieving the highest
nett area13 dwelling density of 16.6 dwellings per ha in the developed areas and 26.2 dwellings per ha in
the proposed development areas, which together deliver an overall net area dwelling density of 20.3
dwellings per hectare. Pyes Pa West (the Lakes) and Papamoa have net area dwelling densities of 13.2
dwellings per ha in the developed areas and a respective densities of 16.0 and 25.5 dwellings per ha in
the proposed areas. Development areas within each Greenfield UGA have a range of different densities,
while further developable areas not currently included in the density calculation may potentially increase
density when developed (see Appendix 7).
In comparison, the older greenfield areas released for development in the early 1990’s are currently
achieving the lower overall densities based on current and proposed development: Bethlehem 12.3, Pyes
Pa East 12.1, and Ohauiti 11.4 and Welcome Bay 10.8. Refer to Appendix 7 for more details on density
figures and maps for the UGAs.
13
Nett area is “nett developable area” as defined in the Tauranga City Plan (see Appendix 7).
27Table 14 Residential dwelling density by urban growth areas, Tauranga City, December 2020
Residential Dwelling density (dwellings per ha)
Growth Area
Development Gross area1 Nett area2 Nett site area3
Bethlehem 12.07 12.22 15.29
Pyes Pa West 13.10 13.24 19.31
Pyes Pa East 11.99 12.13 15.65
Developed Ohauiti 11.01 11.20 13.69
Welcome Bay 10.64 10.75 12.66
Papamoa 13.06 13.23 17.48
Wairakei 16.62 16.57 22.49
Bethlehem 13.34 13.34 21.52
Pyes Pa West 15.97 15.97 19.4
Pyes Pa East 12.77 12.77 15.27
Proposed Ohauiti 13.23 13.23 15.62
Welcome Bay
Papamoa 25.49 25.49 29.02
Wairakei 26.15 26.15 34.72
Bethlehem 12.15 12.29 15.61
Pyes Pa West 13.32 13.44 19.32
Pyes Pa East 12.00 12.13 15.65
Total Ohauiti 11.21 11.39 13.88
Welcome Bay 10.64 10.75 12.66
Papamoa 13.51 13.69 17.97
Wairakei 20.38 20.34 27.37
1
Gross Area includes everything within the full Greenfield UGA boundary – includes all roads, business areas, schools, all
reserves and stormwater areas
2
Nett Area is “Nett Developable Area” as defined in the Tauranga City Plan (see Appendix 7) – only includes residential sites,
local and collector roads and neighbourhood reserves
3
Nett Site Area - only includes land within residential site included in the density calculation.
Table 15 Area, yield and residential density in urban growth areas, Tauranga City, December 2020
Vacant sections + Total Yield
Residential density
Growth area Nett Area Dwellings proposed sections/ (Vacant & proposed
sections & dwellings) (dwellings per ha) 1
(ha) lots or dwellings
Bethlehem 268.35 2,994 304 3,298 12.29
Pyes Pa West 182.75 1,869 588 2,457 13.44
Pyes Pa East 182.22 2,114 97 2,211 12.13
Ohauiti 145.68 1,292 368 1,660 11.39
Welcome Bay 140.28 1,427 66 1,493 10.75
Papamoa 763.44 9,603 849 10,452 13.69
Wairakei 257.37 2,351 2,885 5,236 20.34
1
includes both developed and proposed dwellings and sections
5 Dwelling Typology
Tauranga City
As observed in the last few years, the types of dwellings14 consented in Tauranga City vary, with
standalone dwellings being the most prevalent dwelling type. In 2019/20, stand alone dwellings
comprised more than three quarters (76%) of all the dwellings consented. The remaining quarter was
comprised of the other dwelling types, including duplexes, attached dwellings, secondary/minor
dwellings, retirement village units in Papamoa, Bethlehem and Wairakei, and a few apartments in the
established parts of the city.
14
TCC classifies the dwellings into the following types: standalone dwellings, duplex, attached dwellings, apartments, retirement
village units and secondary/minor dwelling. TCC further classifies dwellings in the retirement village units into standalone, duplex,
and attached dwellings.
28You can also read