Oxford Sustainability Index Report 2016 - Low Carbon Oxford
←
→
Page content transcription
If your browser does not render page correctly, please read the page content below
Environmental Sustainability

Oxford Sustainability Index
Report 2016
Oxford Sustainability Index – 2016

                                     This page is intentionally blank.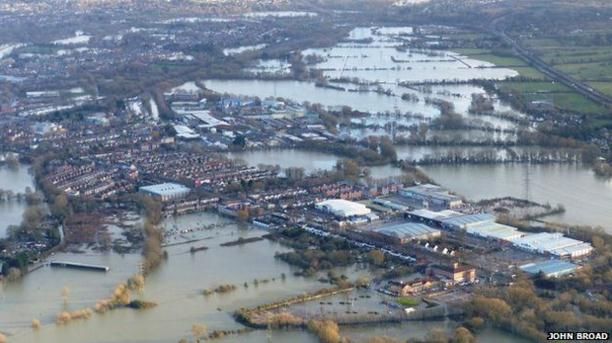
Oxford Sustainability Index – 2016

Foreword
I’m thrilled that this report confirms independently that the city of Oxford is very good at caring for the environment and tackling climate change.
Compared to other cities in the UK we are doing well, though not yet well enough, at improving air quality and cutting carbon.

But before we pat ourselves on the back too hard, the study by Oxford-based Aether, also warns that there is room for improvement. We could do much
more to generate our own renewable energy. We need to create a much better low carbon transport system.

I am particular pleased at the kind things the report says about Low Carbon Oxford, which we set up six years ago. Over 40 organisations, accounting for
half the economy of Oxford, are committed to cutting their harmful carbon dioxide emissions by at least 3% a year.

The car factory, the hospitals, the bus companies are many others are doing their bit to save energy and cut costs. The public of Oxford is leading the way
with recycling, solar panels and bicycles. The report shows that all this is making a difference and creating a more sustainable greener city.

Councillor John Tanner,
Board Member for, A Clean and Green Oxford

Oxford Sustainability Index – 2016

Executive Summary
This report sets out to evaluate Oxford’s environmental
performance in ten categories in reference to other
urban areas in the UK and calls this the Oxford
Sustainability Index. The outcome is designed to identify
environmental strengths and potential opportunities for
action and improvement.
Oxford has taken huge strides to improve the
environment but faces further challenges in order to
achieve its environmental goals while also striving to
increase its economic output and meet the housing
needs as one of the fastest growing cities in the UK.1
The results of the analysis indicate that Oxford performs
better than average in most categories and scores
particularly well in land quality, carbon dioxide (CO2)
emissions and land use but shows room for
improvement in sectors such as renewable energy and
transport.
Overall Oxford City Council’s policies and strategies
perform well compared to those set by other local
authorities, including aims to improve local air quality
through the Low Emission Zone, the proposed future
Zero Emission Zone, GHG reduction commitments                                        Figure 1: Oxford Sustainability Index environmental performance by category
through the Covenant of Mayors and contaminated land
strategies.

1
    http://www.centreforcities.org/publication/fast-growth-cities-opportunities-and-challenges-for-cambridge-oxford-milton-keynes-swindon-norwich/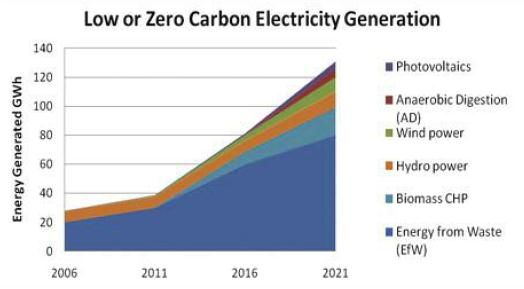
Oxford Sustainability Index – 2016

Contents
Introduction ..................................................................................................................................................................................................................................... 1
The Urban Areas .............................................................................................................................................................................................................................. 2
The Indicators .................................................................................................................................................................................................................................. 3
   Methodology ............................................................................................................................................................................................................................... 4
   Greenhouse Gas Emissions ......................................................................................................................................................................................................... 5
   Renewable Energy ....................................................................................................................................................................................................................... 6
   Energy Efficiency ......................................................................................................................................................................................................................... 7
   Transport ..................................................................................................................................................................................................................................... 8
   Water ........................................................................................................................................................................................................................................... 9
   Waste ......................................................................................................................................................................................................................................... 10
   Air Quality .................................................................................................................................................................................................................................. 11
   Sustainable Land Use ................................................................................................................................................................................................................ 12
   Flood Risk................................................................................................................................................................................................................................... 14
   Land Quality............................................................................................................................................................................................................................... 15
Appendix A – Detailed Case Studies ............................................................................................................................................................................................. 16
Appendix B – Data sources ........................................................................................................................................................................................................... 20
Appendix C – Data matrix ............................................................................................................................................................................................................. 24
Appendix D – Relative Performance ............................................................................................................................................................................................. 26
Appendix E – Policy Analysis Criteria............................................................................................................................................................................................ 28
Oxford Sustainability Index – 2016
Introduction
In the context of sustainable development, cities are the agents of change,
driving the agenda through innovative and progressive action. The drivers for
action are compelling, with goals such as improving inhabitants’ health;
developing sustainable, green economies; creating more liveable, sociable
cities; offering energy security; alleviating congestion and minimising
environmental impact.
As a part of this movement, national and international studies to quantify
progress have been undertaken both in the UK and abroad. Well-known
examples include the ‘Sustainable Cities Index’ (2007 – 2010), by Forum for the
Future2, which ranked the sustainability of the 20 largest British cities, and the
‘Green City Index’3 scoring the sustainability of 130 cities across the world.
Oxford City Council and Aether set out to perform an analysis to benchmark
Oxford’s environmental sustainability to that of other urban areas in the UK.
The Oxford Sustainability Index is based on 37 environmental indicators across
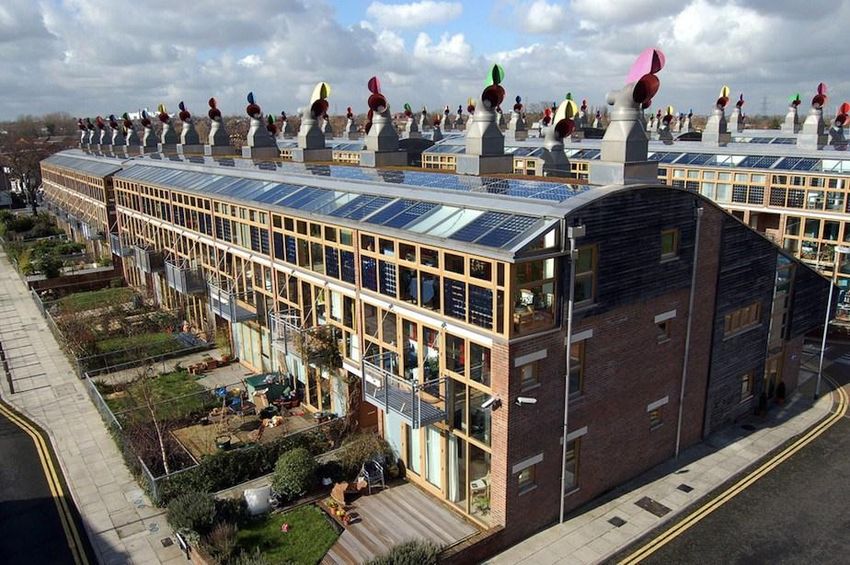
Figure 2: The BedZED development was pioneering and an example of the benefits and 10 categories identified Oxford’s own sustainability goals. This report
viability of the green city concept.
summarises the findings from the analysis, as well as providing case studies and
examples of potential best practice among other local authorities.
It is hoped that other cities will join Oxford in undergoing this analysis to
develop common and transparent evidence bases and collaborate to share
ideas and work toward the advancement of a common Sustainability Index
based on data that is available across the UK.
2
https://www.forumforthefuture.org/sites/default/files/images/Forum/Projects/Sustainable_Cities_Index/Sustainable_Cities_Index_2010_FINAL_15-10-10.pdf
3
http://www.siemens.com/entry/cc/features/greencityindex_international/all/en/pdf/gci_report_summary.pdf
1
Oxford Sustainability Index – 2016

The Urban Areas
The Green City Analysis measures and rates the environmental
performance against a total of 172 urban areas in the UK. These urban
areas were chosen based on their classification as either ‘major urban’,
‘large urban’ or ‘other urban’ by the Office for National Statistics4.
Consequently, the analysis does not compare Oxford to regional
conurbations such as Greater London or Greater Manchester, but to
each individual urban area as defined by the local authority
boundaries.
Freely available city data of adequate quality are not available for all
urban areas for all indicators and therefore the size of the data set for
each indicator varies and is based on what is available and deemed a
reasonable sample size.
See Figure 3 for the full set of urban areas included in the analysis.

                                                                               Figure 3: Full set of studied Urban Areas. A darker shade of blue represents a more frequent
                                                                               benchmarking between Oxford and that area.

4
 http://webarchive.nationalarchives.gov.uk/20160105160709/http://www.ons.gov.uk/ons/guide-method/geography/products/area-classifications/rural-urban-definition-
and-la/rural-urban-local-authority--la--classification--england-/index.html
                                                                                                                                                                              2
Oxford Sustainability Index – 2016
The Indicators
The urban areas were compared according to a total of 37 indicators covering 10 sectors. The set of indicators was chosen based on previous green city
indices in the UK and abroad and Oxford’s local sustainability goals and are displayed in Figure 4 below.5 6 7
Figure 4: The categories and indicators assessed for this analysis
5
https://www.forumforthefuture.org/sites/default/files/images/Forum/Projects/Sustainable_Cities_Index/Sustainable_Cities_Index_2010_FINAL_15-10-10.pdf
6
http://www.siemens.com/entry/cc/features/greencityindex_international/all/en/pdf/report_en.pdf
7
http://www.siemens.com/entry/cc/features/greencityindex_international/all/en/pdf/gci_report_summary.pdf
3Oxford Sustainability Index – 2016
Methodology
Performance in each environmental category is evaluated based on a number of indicators, each assessed using one of two approaches:
1. Quantitative: An evaluation of performance based on numerical analysis of the city’s performance. This approach will identify the best and worst
performing urban areas for the indicator in question, and assess where Oxford sits within that range. For example, if Oxford had a level of 50 for a
certain indicator, where the best city had 25 and the worst city 100, Oxford would receive a score of 66%.
2. Qualitative: An assessment of the city’s literature relating to an indicator involving policies and strategies. These are evaluated through a
standardised policy analysis framework which considers targets, policies and strategies based on the presence of key ‘best practice’ elements
contained within the documentation. The criteria included in the policy analysis framework are outlined in Appendix E.
The analysis is also assessed in 2 separate contexts. The ‘Status’ considers the current level of performance (based on quantitative analysis) as a snapshot of
where the city is now. To consider the intention to improve environmental performance the ‘Policy/Strategy’ is also assessed (using mostly qualitative
assessment) where it is relevant.
Finally, the outcome of each indicator is then compiled into an overall category percentage score using weightings based on the indicators’ perceived
importance (see Appendix C). This gives a percentage score by which the city can consider its overall performance in a given category. These are then
grouped into ‘Poor’, ‘Average’ or ‘Good’ as indicated by the colour-coded system below.
Poor Average Good
0% – 35% 36% – 65% 66% – 100%
4Oxford Sustainability Index – 2016
Greenhouse Gas Emissions
Status: Oxford received a combined score of 79% for the three GHG emission indicators. The city’s per capita CO2 emissions were 5.9
tonnes in 20138, slightly above the 5.6 tonne average for the studied urban areas and above the 4.8 tonnes per capita emissions target
79%
required in 2030 to limit global warming to 1.5°C9. From an economic perspective, Oxford’s emissions intensity of 0.09 kilotons of CO2
(ktCO2) per £1M GVA is below the 0.16 ktCO2/£1M average for the studied urban areas, resonating with the city’s ambition to promote a
vibrant sustainable economy. To reduce the overall per capita emissions in the city, Oxford faces challenges relating to the poor energy efficiency of the
relatively large proportion of heritage building stock. By working to reduce energy
consumption with the private, third and especially domestic sector, the city can Case Study: Oxford
continue to mitigate the effects of climate change while reducing energy costs and The Low Carbon Oxford Pathfinders is a unique public/private
alleviating fuel poverty. network of over 40 Oxford organisations committed to work
together to reduce CO2 emissions in Oxford and support a
Policy/Strategy: Oxford’s Sustainability Strategy, Low Emission Strategy and
sustainable economy. Together responsible for nearly 50% of
forthcoming Sustainable Energy Action Plan (SEAP) set the ambition to reduce GHG
the industrial and commercial carbon footprint of the city,
emissions across the city. The target is to reduce the city’s emissions by 40% by 2020
Pathfinders organisations have committed to reduce their
compared to a 2005 baseline, equivalent to an annual reduction of 2.7%, giving Oxford emissions by 3% annually.
the 9th most ambitious climate target of the 34 British signatories to the Covenant of
Mayors.
Indicator Unit Worst urban area Best urban area Oxford Oxford’s Score
CO2 emissions per capita tCO2/capita 16.3 3.2 5.9 79%
CO2 emissions per GVA ktCO2/£million GVA 0.35 0.03 0.09 80%
CO2 reduction policies % reduction/year 1.0% 3.2% 2.7% 77%
8
2013 is the latest available data on sub-national GHG emissions from the Department of Energy & Climate Change (DECC)
9
The global target to avoid 1.5°C of warming is 4.8 tCO 2e per capita in 2030, assuming a global population of 8.2 billion
(http://www.un.org/esa/population/publications/WUP2005/2005WUP_FS4.pdf) and global emissions of 39 GtCO2e
5Oxford Sustainability Index – 2016
Renewable Energy
Status: Local generation of renewable energy is clearly a challenge for Oxford which has resulted in the relatively low combined score of
20% for the three renewable energy indicators. Of the approximately 5,500 MWh of locally sourced renewable electricity generated each 20%
year, approximately 77% comes from photovoltaics. The indicator for the rate of Renewable Heat Incentive (RHI) installations is more
positive and demonstrates that Oxford businesses and residents have been relatively active and successful in installing renewable
heating systems and accessing the financial incentives available.
Policy/Strategy: The City Council has a planning requirement for Case Study: Nottingham
new developments10 to generate at least 20% of onsite energy Nottingham has been labelled as one of the most energy self-sufficient cities in the
demand through renewables. An additional strategy for renewable UK. The city’s energy strategy was developed in April 2010 and addresses the city’s
energy is also included in Oxford’s wider Sustainability Strategy, historic, current and future energy demand as well as renewable energy
but does not include specified generation targets as is the case generation. Through the strategy, Nottingham sets out 14 targets and 8 aims to
with Nottingham’s Sustainable Energy Strategy which projects the achieve 20% of its energy generation from Low or Zero emission sources by 2020.
city’s future renewable and low carbon energy generation.11 See Appendix A for more details.
Other Initiatives: Innovative partnerships such as the Low Carbon Hub and Low Carbon Oxford provide finance for and encourage citizen action and nurture
strong and active communities engaged in renewable energy generation.
Indicator Unit Worst urban area Best urban area Oxford Oxford’s Score
% renewable electricity % generation of total demand 0% 20% 0.6% 3%
# RHI installations/capita # installations per 1,000 citizens 0.00 1.75 0.38 22%
Renewable energy policies Policy scoring (1-5) 1 4.56 2.79 50%
10 2
> 2,000m
11
http://mycovenant.eumayors.eu/docs/seap/341_320_1305035877.pdf
6Oxford Sustainability Index – 2016
Energy Efficiency
Status: Oxford received a combined score of 58% for the six energy efficiency indicators despite the burden of the relatively poor energy 58%
inefficiency of the city’s heritage buildings. The outcomes are as follows:
Overall per capita energy consumption is estimated as 18.7 MWh, below the average for the urban areas reviewed.
The average Oxford household consumes 16.9 MWh per year, in line with the national average domestic consumption.
As with GHG emissions, Oxford’s economy is energy efficient relative to its economic output, requiring 300 MWh per £1 million GVA and thus well
below the average 536 MWh per £1 million GVA for the studied urban areas.
Oxford’s industrial and commercial sector indicates a high energy intensity per m2 of floor space.
11.9% of Oxford households live in fuel poverty which is higher than the 10.5% average for the studied urban areas.
Oxford Initiatives: Oxford performs relatively well when considering the domestic energy improvements and has reduced domestic energy consumption by
an average of 3.5% per dwelling per year, mainly through improved insulation and greater energy efficiency of newer buildings. This is not as much as
Manchester, which has seen an average 4.6% reduction per year, but slightly ahead of the average improvements.
Indicator Unit Worst urban area Best urban area Oxford Oxford’s Score
Total energy consumption MWh/capita 32.1 10.8 18.7 63%
per capita
Energy consumption per MWh/£million GVA 1,117 95 300 80%
GVA
Domestic energy MWh/dwelling/year 22.2 10.4 16.9 45%
consumption
Industrial & Commercial MWh/m2/year 1.7 0.3 1.3 30%
energy use
Households living in fuel % of households in fuel poverty 18.9% 5.6% 11.9% 53%
poverty
Annual household energy % annual reduction per dwelling 2.1% 4.7% 3.5% 57%
reduction
7Oxford Sustainability Index – 2016
Transport
Case Study: Leeds
Status: Oxford received a combined score of 43% for the five transport
indicators with per capita transport CO2 emissions decreasing by 2%
43%
Leeds developed a ‘Mini Stern’ report to assess the per year, slightly below an average reduction of 2.5% for other cities12.
economic impacts of various carbon abatement actions. The city performs consistent with average workforce commuting with
Key measures highlighted for their cost effectiveness are 31% commuting by active and public transport. This is helped by a total of 0.49 kilometres
mainly related to public transport and include Park and of cycling infrastructure per km2, which is more than double the average of the studied urban
Ride schemes and an Express bus/coach network with
areas (the city with the greatest amount of cycling infrastructure is Portsmouth with 0.73km
negative CO2 abatement costs as low as -370 £/tCO2, as
per km2). Furthermore, to encourage electric vehicles (EVs) Oxford has 0.08 charging
well as more costly policy measures such as rail
stations per 1000 citizens which is higher than average, but somewhat short of Milton
electrification and investment in rail infrastructure and
Keynes as the best performing city with 0.55 charging stations per 1000 citizens. The
biofuels. Biofuels and hybrid technology uptake in road
transport represent the sectors with the greatest potential transport sector is key to achieving sustainable development for a number of reasons,
carbon savings, with Biofuel investments alone enabling a including the need to rapidly decarbonise this growth sector and improve air quality in the
potential saving of 210 ktCO2. See Appendix A for more city and enable a cleaner and greener Oxford with an increased uptake of public and active
details. transport such as cycling leading to consequential health benefits for the population.
Indicator Unit Worst urban area Best urban area Oxford Oxford’s Score
Use of public or active transport by % using active or public transport 9.3% 54.6% 31.2% 48%
workforce
Kilometre cycling infrastructure per km cycling infrastructure/km2 0.002 km 0.73 km 0.49 km 67%
km2
Percentage of buses running on % of buses running on time 63% 96% 74% 33%
time
Number of electric charging points # charging points per 1000 citizens 0.001 0.55 0.08 15%
Reduction of per capita transport % reduction in per capita transport 0.8% 4.8% 2% 31%
emissions CO2 emissions
12
https://www.gov.uk/government/statistical-data-sets/bus09-frequency-and-waiting-times
8Oxford Sustainability Index – 2016
Water
Status: Oxford received a combined score of 68% for the three water indicators. The average Oxford resident consumes
approximately 129 litres of water per day, which is below the average consumption of 155 litres for the nine water companies 68%
reviewed as part of this study. Leakage rates were estimated at approximately 25% compared to 16% and 32% for the best and worst
performing water company districts13.
Case Study: Bristol
Policy/Strategy: As a city suffering from potential water
stress, Oxford’s water strategies were evaluated and Bristol City Council won the 2012 European Eco Management Audit Scheme Award for
compared to that of a best practice city. Oxford City water efficiency and quality. The City Council has worked closely with Bristol Water and
Council currently does not have a separate potable water Wessex Water to identify problem sites and make recommendations on water efficiency
policy or strategy, but includes these elements at a high to reduce the city’s water consumption.
level as part of the city’s Sustainability Strategy. More Through actions such as water audits to identify sites with high water consumption, leak
concrete measures need to be taken to work together with identifications, provision of ‘Save a Flush’ devices and system upgrades, Bristol Council
the local water company to identify measures to reduce reduced water consumption by 11% in two years. Other measures include reduced water
water consumption, including provision of water efficient consumption through xeriscaping. See Appendix A for more details.
devices and continued citizen engagement on the topic of
water consumption.
Indicator Unit Worst urban area Best urban area Oxford Oxford’s Score
Per capita water consumption Litres/capita/day 175 123 129 89%
Water network leakage % leakage 32% 16% 25% 43%
Potable water policies Policy scoring (1-5) 1 2.8 1.9 53%
13
http://www.thameswater.co.uk/tw/common/downloads/wrmp/WRMP14_Section_3.pdf
9Oxford Sustainability Index – 2016
Waste
Status: Oxford received a combined score of 63% for the three waste
indicators mainly due to relatively low levels of generated household 63%
waste. The average Oxford household generates 299 kg of waste per
year out of which 46% is recycled. That is 80 kg less than average
waste generation, and above the average recycling rate. However, the total amount
of residential waste in Oxford grows by approximately 0.5% per year, highlighting how Oxford
continually needs to tackle an increasing amount of waste as the city continues to grow.
Oxford Initiatives: Oxford is currently diverting over 95% of all waste from landfill for use in
Energy from Waste (EfW) generation. Although not a renewable energy source, the EfW
generation reduces the consumption of fossil fuels for energy generation and reduces
methane emissions from landfill sites14. Oxford is aiming to further increase recycling rates
through the Blue Bin Recycling League, a City Council initiative enabling different city areas to
compete to improve recycling rates with a chance to win money for local charities and
community groups15.16
11
Figure 5 Five step Waste Hierarchy
Indicator Unit Worst urban area Best urban area Oxford Oxford’s Score
Annual domestic waste generation Kg/household/year 490 kg 262 kg 299 kg 84%
Recycling rates % recycled, reused or composted 17% 65% 46% 60%
Change in household waste generation % change in waste generation +2.5% -4.7% +0.5% 27%
14
https://www.theccc.org.uk/wp-content/uploads/2013/04/Waste-factsheet.pdf
15
https://www.oxford.gov.uk/info/20202/blue_bin_recycling_league/481/blue_bin_recycling_league_-_how_it_works
16
http://lgn1403372428.site-fusion.co.uk/the-waste-hierarchy
10Oxford Sustainability Index – 2016
Air Quality
Status: Oxford received a combined score of 75% for the six air quality indicators. Oxford scores well with this indicator because
pollutant levels are considerably lower than the worst urban areas in the UK. However, most urban areas perform even better than 75%
Oxford, reflecting their lower levels of pollutants at the roadside. Oxford has demonstrated leadership in tackling air quality issues –
their work to deliver a hybrid bus fleet and implement the first Low Emission Zone outside London is held up as an example of good
practice for other local authorities in the UK. However further progress is needed to deliver a ‘cleaner and greener Oxford’ in the context of air quality with,
for example, no exceedances of health based pollutant limit values.
There are limitations associated with the comparison of air quality in urban areas. Pollutant levels are extremely dependent on the distance from the
roadside, and results from roadside monitoring therefore need to be assessed with caution. Roadside indicators are used as they provide insight into the
highest levels of exposure to pollutants and hence the most significant health impacts. It is the pollutant levels measured at these locations which are used
as a key driver for most local authorities’ air quality policies and actions. Theoretically, urban background pollutant levels provide a more comparable
metric across urban locations, but as with roadside locations, pollutant levels can be influenced by localised factors.
Policy/Strategy: Oxford’s Clean Air Policies perform well as a result of the Council’s actions to implement the Low Emission Zone and future Zero Emission
Zone. Sheffield was another city identified for implementing best practice Clean Air Policies through its work on health inequality resulting from air
pollution, exploring alternative actions, setting very ambitious targets and incorporating policy costing17.
Indicator Unit Worst urban area Best urban area Oxford Oxford’s Score
3
Nitrogen Dioxide (NO2) - Roadside Annual Mean µg/m 94 17 52 55%
Nitrogen Dioxide (NO2) - Urban Background Annual Mean µg/m3 55 12 17 88%
Particulate Matter (PM10) - Roadside Annual Mean µg/m3 31 19 22 73%
Particulate Matter (PM10) - Urban Background Annual Mean µg/m3 19 13 15 68%
Low emission zone Yes/No No Yes Yes 100%
Clean air policies Policy scoring (1-5) 1.00 4.77 3.98 79%
17
https://www.sheffield.gov.uk/environment/air-quality/action-plan.html
11Oxford Sustainability Index – 2016
Sustainable Land Use
Status: Situated on the floodplains of the River Cherwell and the River
Thames, a large part of Oxford is covered in green space. The five indicators 70%
related to ‘Sustainable Land Use’ measure urban land use such as grasslands,
forests, urban tree cover and policies related to biodiversity as opposed to
assessing publically accessible green space. In total, Oxford received a score of 70% for the five
indicators, partially on account of the meadows and woodlands that make up make up a total of
32% of the city’s surface, above the average of 27% for the studied urban areas. This can be
compared to 56% and 1% for the best and worst performing urban areas respectively.
Oxford also has a substantial urban tree cover of 21%. This ranks Oxford 4th out of 12 urban areas
Picture taken by Chris Bell studied18 for urban tree cover, and substantially higher than the UK town average of 8.5%19.
Figure 6 Cutteslowe, Oxford
Case Study: Nottingham
With more than 60 biological and 18 geological Local Wildlife Sites, 14 nature reserves and 3 sites of Special Scientific Interest, Nottingham City Council
addresses biodiversity in the city in a number of ways, including through the ‘Wildlife in the City’ partnership project between Nottinghamshire Wildlife
Trust and the City council. Rather than focusing on the protection of wildlife in specially designated protection sites, ‘Wildlife in the City’ and similar
projects elsewhere focus on the integration of wildlife into the urban landscape to improve the city itself as a home to humans and wildlife alike. See
Appendix A for more details.
18
Only a limited number of urban areas were studied for this indicator as there was no national dataset available. The 12 reviewed were those which have had an iTree
analysis undertaken (https://www.itreetools.org/)
19
http://dx.doi.org/10.1080/03071375.2012.708498
12Oxford Sustainability Index – 2016
Policy/Strategy: Oxford also performs relatively well for its green space policy scoring 3.71 out of 5 compared to 3.91 out of 5 for a best practice city with
good stakeholder engagement and information on current green space. The policy would benefit from more information regarding targets on future green
space in the city Oxford’s current biodiversity policy scored a total of 2.3 out of 5, as compared to a best practice urban area scoring 3.2 out of 5. Like many
other local authorities, Oxford integrates biodiversity as part of its core strategy and could continue incorporating further elements of stakeholder
involvement and addressing biodiversity in the urban landscape through green hybrid architecture and urban wildlife. Oxford’s tree management plan did
not score as well, with a total of 2.81 (compared to a best practice tree cover strategy scoring 4.6) but provided a well identified risk management system
and good understanding of Oxford’s current tree cover. Southwark was identified for integrating best practice measures through citizen engagement, listing
future actions, evaluating the financial benefits of the urban tree cover and providing clear future targets20.
Oxford Initiatives: As a part of the city’s management of the urban tree cover, Oxford performed an urban canopy cover assessment in 2015. The state-of-
the-art assessment quantified the urban tree cover in all the city wards, showing a high city-wide tree cover, but with significant variation between wards
from the best performing Headington and Headington Northway at 29% and 30% respectively, and Lye Valley and Jericho Osney at 11% and 13%.
Indicator Unit Worst urban area Best urban area Oxford Oxford’s Score
% of land area covered by % covered by grasslands and 1% 56% 32% 56%
grassland and forests forests
Urban tree cover % urban tree cover 4% 23% 21% 92%
Green space policies Policy scoring (1-5) 1 3.9 3.7 93%
Tree cover policies Policy scoring (1-5) 1 4.6 2.8 51%
Biodiversity policies Policy scoring (1-5) 1 3.3 2.3 58%
20
https://www.southwark.gov.uk/downloads/download/2621/tree_strategy
13Oxford Sustainability Index – 2016
Flood Risk
Status: Over time Oxford has encroached into the river Thames floodplain as the city has expanded, making areas such as Wolvercote,
Wytham, New Botley, Osney, Kennington, South Hinksey, North Hinksey, New Hinksey, Jericho and Grandpoint susceptible to flooding. 65%
At 8%, Oxford has a higher percentage of properties at medium or high risk of flooding than the average 2% for the studied urban
areas, but below the worst performing areas like
Runnymede at 22%21 22. This situation could be expected to worsen in the
future as a result of growing floodplains due to climate change. Oxford
received a combined score of 65% for the two Flood risk indicators.
Policy/Strategy: Oxford’s current policies and strategies for flood management
perform better and score a total of 3.25 out of 5 for policy management as
compared to a best practice policy scoring 4.21 out of 5. Oxford’s flood risk
management policies perform well through an overview of the historic, present
and projected future development of flood risk in Oxford as well as Oxfordshire,
and no new buildings built on the floodplains. However, like other local
authorities the flood risk management policies could incorporate more
information on possible short-term objectives to minimise risks, as well as
24
Figure 7 Botley and Wolvercote flooding in 2014.
assumptions and data underpinning the policies. 23
Indicator Unit Worst urban area Best urban area Oxford Oxford’s Score
Percentage of property in % of properties in floodplain 22% 0% 8% 62%
floodplain
Flood management policies Policy scoring (1-5) 1 4.2 3.3 70%
21
Flood risk greater than 1 in 100
22
https://www.theccc.org.uk/flooding-indicators/figure-2-1/
23
http://www.bbc.co.uk/news/uk-england-oxfordshire-25687585
14Oxford Sustainability Index – 2016
Land Quality
Policy/Strategy: Oxford’s land quality policy achieved a score of 99%. The latest land quality strategy was developed in 2014 and the
latest guidance for land developers was created together with Cherwell District Council, Vale of White Horse and South Oxfordshire in
2013. Oxford's land quality strategy also encourages sustainable remediation of contaminated land sites. Cambridge was identified as
99%
another city applying best practice methodologies through its very clear planning guidance, addressing equity and affordable housing in
relation to land contamination, financial quantifications of remediation strategies, and clear information on the impacts on human health
attributed to contaminated land24 25.26
Indicator Unit Worst urban area Best urban area Oxford Oxford’s Score
Land quality strategies Policy scoring (1-5) 1 3.3 3.3 99%
24
https://www.cambridge.gov.uk/sites/default/files/docs/Contaminated%20Land%20Strategy.pdf
25
https://www.cambridge.gov.uk/sites/default/files/docs/Developers%20guide%20to%20contaminated%20land.pdf
26
https://www.crcpress.com/Sediments-Contamination-and-Sustainable-Remediation/Mulligan-Fukue-Sato/9781420061536
15Oxford Sustainability Index – 2016
Appendix A – Detailed Case Studies
Renewable Energy in Nottingham
Although LAs such as Canterbury (54%), Wirral (28%) and Bristol (7%) all generate
substantially more local renewable electricity than Oxford’s 0.6%, this case study focuses on
Nottingham City Council’s Energy Strategy to better develop and explain the approach taken
by a city labelled as one of the most energy self-sufficient cities in the UK27. Nottingham’s
energy strategy was developed in April 2010 and addresses the city’s historic, current and
future energy demand and renewable energy generation. The strategy also discusses fuel
poverty and energy costs, climate change mitigation and adaptation, the 20% strategy and
key actions to achieve the target. Zero carbon electricity generation accounted for in the
strategy includes photovoltaics (PV), anaerobic digestion (AD), wind power, hydropower and
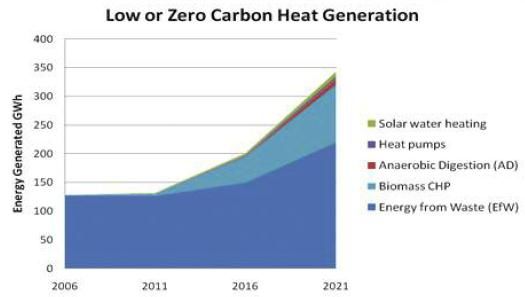
biomass CHP, but also Energy from Waste (EfW) is included in some calculations28.
Accounted for zero carbon heat generation includes solar heating, heat pumps, AD and Figure 8 Nottingham's Low or Zero carbon heat generation projections
biomass CHP, but also EfW is included in some calculations. In total Nottingham’s strategy
contains 14 targets divided into 8 aims:
1. Reducing energy use in public sector infrastructure
2. Reducing energy use in domestic properties and tackle fuel poverty
3. Supporting increased energy efficiency in city businesses
4. Develop alternative energy sources, supply chains and services
5. Support low carbon transport infrastructure
6. Create local jobs and opportunities in energy sector businesses
7. Developing strong external and community partnerships
8. Support local community energy initiatives
Figure 9 Nottingham's Low or Zero carbon electricity generation projections
27
http://www.nottinghamcity.gov.uk/CHttpHandler.ashx?id=19119&p=0
28
http://www.nottinghamcity.gov.uk/CHttpHandler.ashx?id=19119&p=0
16Oxford Sustainability Index – 2016
Transport in Leeds
This case study focuses on the Leeds City Region’s (LCR) Mini-Stern Review on the
Economics of Low Carbon Cities to better develop and explain the approach taken
to reduce carbon emissions from transport29. The LCR’s Mini-Stern Review was
developed in 2012 and addresses the region’s historic, current and future emissions
under a set of scenarios integrating cost efficiency and behaviour change. The
strategy discusses a wide range of sectors including Domestic, Commercial,
Industrial and Transport. For the latter sector, the report identifies £847 million of
cost effective, energy efficient and low carbon investment opportunities available
in the transport sector in the LCR’s transport sector alone.
Through its key economic focus, the report identifies two Central Business Cases
looking at the most cost effective and most carbon saving projects respectively. Key
measures identified for their cost effectiveness are mainly related to public
transport and include Park and Ride schemes and an Express bus/coach network
with negative CO2 abatement costs as low as -370 £/tCO2, as well as more costly Figure 10 Leeds City Region’s Emissions 1990 – 2022 under a set of different scenarios
policy measures such as rail electrification and investment in rail infrastructure and
biofuels. Biofuels and hybrid technology uptake in road transport represent the sectors with the greatest potential carbon savings, with Biofuel investments
alone enabling a potential saving of 210 ktCO2.
Although substantial differences exist between transport challenges in the LCR and Oxford, there are also substantial similarities. As a growing city, Leeds
has also struggled to reduce its transport emissions, but on average reduced its annual per capita transport emissions at a rate 10% more than Oxford30 31.
Additionally, the Mini-Stern Review applies a holistic approach tying together financial opportunities and carbon savings across a range of sectors to identify
key areas for job creation as a result of the applied measures, highlighting the rail transport sector as a key opportunity for new jobs as a result of modal
shifts from cars to public transport.
29
http://www.lowcarbonfutures.org/sites/default/files/2449_mainreport_LCC_WEB_1325868558.pdf
30
http://www.leeds.gov.uk/news/pages/Country's-largest-Growth-Deal-signed-for-Leeds-City-Region.aspx
31
https://www.gov.uk/government/statistics/uk-local-authority-and-regional-carbon-dioxide-emissions-national-statistics-2005-2013
17Oxford Sustainability Index – 2016
Water policies in Bristol
Bristol City Council won the 2012 European Eco Management Audit Scheme Award for water efficiency and
quality32. The City Council has worked closely with Bristol Water and Wessex Water to identify problem sites
and make recommendations on water efficiency to reduce the city’s water consumption33.
Through actions such as water audits to identify sites with high water consumption, leak identifications,
provision of ‘Save a Flush’ devices and system upgrades, Bristol Council reduced water consumption between
by 11% in two years.
Other measures include reduced water consumption through xeriscaping34 via a horticultural program to
replace annual beddings with perennial plantings requiring less watering as well as a changed policy to favour
more drought resistant tree species requiring less water during summer months as compared to more water
consumptive species.
At the City’s allotments, the City Council took measures to identify leaks, encourage rainwater harvesting and
ban hosepipe watering in favour of an alternative water trough watering system.
Figure 10 Bristol water consumption for the Top 50
water consumers
32
http://ec.europa.eu/environment/emas/emasawards/pdf/EC%20presss%20release_winners.pdf
33
https://www.bristol.gov.uk/documents/20182/33395/Water%20case%20study.pdf/c798e014-0514-4fa8-a1d0-86e727ea2526
34
A xeriscape is a garden or landscape created in a style that requires little or no irrigation or other maintenance (Oxford Dictionaries, 2016)
18Oxford Sustainability Index – 2016
Biodiversity in Nottingham
In 2011, Nottingham developed a Biodiversity Position Statement as part of its revised strategy for the management and maintenance of the city’s open
and green spaces. The strategy contains aims to further make consideration towards biodiversity within all functions of the Council, promote and encourage
the incorporation of biodiversity enhancements into the overall design of new developments and open spaces, maximise opportunities for biodiversity gain
through Council wide initiatives, and ensure the protection of key species and habitats35.
With more than 60 biological and 18 geological Local Wildlife Sites, 14 nature reserves and 3 sites of Special Scientific Interest, Nottingham City Council also
addresses biodiversity in the city through the ‘Wildlife in the City’ partnership project between Nottinghamshire Wildlife Trust and the City council. Rather
than focusing on the protection of wildlife in specially designated protection sites, ‘Wildlife in the City’ and similar projects elsewhere focus on the
integration of wildlife into the urban landscape to improve the city itself as a home to humans and wildlife alike. Examples of encouraged actions taken
include enabling citizens to attract local wildlife to their gardens, creating wildlife corridors, encouraging volunteers, environmental youth engagement, and
developing skills and tool-sharing through workshops for e.g. construction of bee hotel to encourage local pollinators.
Another such project related to local biodiversity in Nottingham includes the Council’s work through ‘Bee-Friendly Nottingham’ campaign launched in
201436. Similar partnership projects can also be found in other cities, such as Manchester37.
35
http://www.nottinghamcity.gov.uk/CHttpHandler.ashx?id=24390&p=0
36
http://www.nottinghamcity.gov.uk/bees
37
http://www.wildaboutmanchester.info/www/index.php/contact-us
19Oxford Sustainability Index – 2016
Appendix B – Data sources
The data sources applied to each indicator is described in the table below.
# Indicator Data Sources
1 Per capita GHG emissions https://www.gov.uk/government/statistics/uk-local-authority-and-regional-carbon-dioxide-emissions-national-
statistics-2005-2013
2 GHG emissions per GVA http://www.ons.gov.uk/economy/grossvalueaddedgva/bulletins/regionalgrossvalueaddedincomeapproach/previ
ousReleases
https://www.gov.uk/government/statistics/uk-local-authority-and-regional-carbon-dioxide-emissions-national-
statistics-2005-2013
3 GHG reduction policies http://www.covenantofmayors.eu/about/signatories_en.html?q=Search+for+a+Signatory...&country_search=gb&
population=&date_of_adhesion=&status=
4 Renewable electricity generation https://www.gov.uk/government/statistics/regional-renewable-statistics
5 Renewable heat generation http://www.energysavingtrust.org.uk/domestic/renewable-heat-incentive?gclid=CIiChObCnsgCFSP4wgod-CUGlA
6 Renewable energy policies http://www.nottinghamcity.gov.uk/CHttpHandler.ashx?id=19119&p=0
http://mycouncil.oxford.gov.uk/documents/s6892/Sustainability%20Strategy.pdf
https://www.oxford.gov.uk/downloads/file/1901/carbon_management_plan_2012-17
http://www.nottinghamcity.gov.uk/CHttpHandler.ashx?id=19119&p=0
7 Total energy consumption per https://www.gov.uk/government/statistical-data-sets/total-final-energy-consumption-at-regional-and-local-
capita authority-level-2005-to-2010
https://www.gov.uk/government/statistics/uk-local-authority-and-regional-carbon-dioxide-emissions-national-
statistics-2005-2013
8 Energy intensity per GVA https://www.gov.uk/government/statistical-data-sets/total-final-energy-consumption-at-regional-and-local-
authority-level-2005-to-2010
http://www.ons.gov.uk/economy/grossvalueaddedgva/bulletins/regionalgrossvalueaddedincomeapproach/previ
ousReleases
9 Domestic energy consumption https://www.gov.uk/government/statistical-data-sets/total-final-energy-consumption-at-regional-and-local-
authority-level-2005-to-2010
10 Industrial and commercial energy https://www.gov.uk/government/statistical-data-sets/total-final-energy-consumption-at-regional-and-local-
consumption authority-level-2005-to-2010
11 Fuel poverty https://www.gov.uk/government/statistics/2013-sub-regional-fuel-poverty-data-low-income-high-costs-indicator
12 Domestic energy reductions for https://www.gov.uk/government/statistical-data-sets/total-final-energy-consumption-at-regional-and-local-
households authority-level-2005-to-2010
20Oxford Sustainability Index – 2016
# Indicator Data Sources
13 Use of non-car transport modes http://webarchive.nationalarchives.gov.uk/20160105160709/http://www.ons.gov.uk/ons/rel/census/2011-
census-analysis/method-of-travel-to-work-in-england-and-wales/art-method-of-travel-to-work.html
http://www.scotlandscensus.gov.uk/origin-destination-statistics
14 Cycling infrastructure http://www.sustrans.org.uk/ncn/map/national-cycle-network
15 Bus efficiencies and running on https://www.gov.uk/government/statistical-data-sets/bus09-frequency-and-waiting-times
time
16 Number of electric vehicle http://www.national-charge-point-registry.uk/
charging points https://www.zap-map.com/live/
17 Change in per capita transport https://www.gov.uk/government/statistics/uk-local-authority-and-regional-carbon-dioxide-emissions-national-
emissions statistics-2005-2013
18 Per capita water consumption http://www.southeastwater.co.uk/media/1109891/4.DemandForcast_WRMP_0614.pdf
http://www.deevalleywater.co.uk/article_files/192/english/dee-valley-water-wrmp-final-v3.0.pdf
http://www.anglianwater.co.uk/_assets/media/WRMP_2015.pdf
http://www.cambridge-water.co.uk/home/wrmp
https://stakeholder.affinitywater.co.uk/docs/FINAL-WRMP-Jun-2014.pdf
http://www.thameswater.co.uk/tw/common/downloads/wrmp/WRMP14_Section_3.pdf
http://www.sitesplus.co.uk/user_docs/274/File/Draft%20WRMP-6v3%202013.pdf
http://www.bristolwater.co.uk/environment/water-resource-plan/2014-water-resource-plan/
https://www.eswater.co.uk/_assets/documents/ESW_Final_Published_PR14_WRMP_Report_-_V3_-
_08OCT14.pdf
19 Water system leakage rates See indicator 19
20 Water policies http://www.bristolwater.co.uk/environment/water-resource-plan/2014-water-resource-plan/
http://mycouncil.oxford.gov.uk/documents/s6892/Sustainability%20Strategy.pdf
https://webcache.googleusercontent.com/search?q=cache:Ivn9jAJk5vAJ:https://www.oxford.gov.uk/download/d
ownloads/id/1905/sustainability_strategy_2011-2020.pdf+&cd=1&hl=sv&ct=clnk&gl=uk
http://www.wyreforestdc.gov.uk/media/107600/EB040Water-Reources-July2012update4.pdf
https://www.bristol.gov.uk/documents/20182/33395/Water%20case%20study.pdf/c798e014-0514-4fa8-a1d0-
86e727ea2526
http://www.thameswater.co.uk/tw/common/downloads/wrmp/WRMP14_Section_3.pdf
http://ec.europa.eu/environment/emas/emasawards/pdf/EC%20presss%20release_winners.pdf
http://www.bristolwater.co.uk/wp/wp-content/uploads/2013/05/WRMP-final-V1-1406121.pdf
21Oxford Sustainability Index – 2016
# Indicator Data Sources
21 Waste generation https://www.gov.uk/government/statistical-data-sets/env18-local-authority-collected-waste-annual-results-
tables
http://www.sepa.org.uk/environment/waste/waste-data/waste-data-reporting/household-waste-data/
https://www.cardiff.gov.uk/ENG/resident/Planning/Local-Development-
Plan/Documents/Population%20and%20Housing.pdf
22 Recycling rates See indicator 22
23 Waste reduction policies See indicator 22
24 Nitrogen Dioxide (NO2) - Roadside http://uk-air.defra.gov.uk/data/
Annual Mean
25 Nitrogen Dioxide (NO2) - Urban http://uk-air.defra.gov.uk/data/
Background Annual Mean
26 Particulate Matter (PM10) - http://uk-air.defra.gov.uk/data/
Roadside Annual Mean
27 Particulate Matter (PM10) - Urban http://uk-air.defra.gov.uk/data/
Background Annual Mean
28 Low Emission Zone Coverage https://tfl.gov.uk/modes/driving/low-emission-zone/check-if-your-vehicle-is-affected?intcmp=2285
http://urbanaccessregulations.eu/countries-mainmenu-147/united-kingdom-mainmenu-205/norwich
http://laqm.defra.gov.uk/documents/Norwich_lez.pdf
http://urbanaccessregulations.eu/countries-mainmenu-147/united-kingdom-mainmenu-205/Nottingham
http://urbanaccessregulations.eu/countries-mainmenu-147/united-kingdom-mainmenu-205/brighton
http://urbanaccessregulations.eu/countries-mainmenu-147/united-kingdom-mainmenu-205/oxford
http://webarchive.nationalarchives.gov.uk/20160105160709/http://www.ons.gov.uk/ons/guide-
method/geography/products/other/uk-standard-area-measurements--sam-/index.html
https://www.daftlogic.com/projects-google-maps-area-calculator-tool.htm
29 Clean air policies https://www.sheffield.gov.uk/environment/air-quality/action-plan.html
http://www.sheffieldairmap.org/view_map.html
https://www.oxford.gov.uk/info/20052/air_quality
https://www.oxford.gov.uk/info/20216/air_quality_management/206/air_quality_management_in_oxford
http://www.oxford-airwatch.aeat.co.uk/
30 Green space cover CEH Landcover map 2007 https://eip.ceh.ac.uk/lcm
31 Green space policies http://www.birmingham.gov.uk/greenlivingspaces
https://www.oxford.gov.uk/downloads/file/1928/green_spaces_strategy_2013-27
https://www.oxford.gov.uk/downloads/download/572/green_spaces_strategy_2013-2027
22Oxford Sustainability Index – 2016
# Indicator Data Sources
32 Biodiversity policies http://www2.peterborough.gov.uk/environment/nature,_conservation,_wildlife/current_biodiversity_strategy.as
px
https://www.oxford.gov.uk/downloads/file/1450/oxford_core_strategy
http://www.nottinghamcity.gov.uk/bees
http://www.nottinghamcity.gov.uk/CHttpHandler.ashx?id=24390&p=0
http://www.nottinghamcity.gov.uk/article/22334/Biodiversity
33 Urban tree cover Oxford i-Tree Canopy Cover Assessment
https://www.woodlandtrust.org.uk/mediafile/100229275/stake-of-uk-forest-
report.pdf?cb=58d97f320cab43d78739766e71084f76
https://naturalresources.wales/media/4123/tree-cover-in-wales-towns-and-cities-2014-study.pdf page 107
34 Urban tree policies https://www.southwark.gov.uk/downloads/download/2621/tree_strategy
https://webcache.googleusercontent.com/search?q=cache:YKPoKMQqNjYJ:https://www.oxford.gov.uk/downloa
d/downloads/id/1907/tree_management_policy.pdf+&cd=5&hl=sv&ct=clnk&gl=uk
Oxford i-Tree Canopy Cover Assessment
35 Properties at risk of flooding http://www.theccc.org.uk/wp-content/uploads/2012/07/ASC-floodplain-development-by-local-authority-for-
website.xls
36 Flood risk policies Oxford Flood Risk Management Strategy (by EA)
https://www.oxfordshire.gov.uk/cms/sites/default/files/folders/documents/environmentandplanning/flooding/Fl
oodStrategyActionPlan.pdf
https://bristol.citizenspace.com/city-
transport/floodstrategy/supporting_documents/Local%20Flood%20Risk%20Management%20Strategy_Final.pdf
https://bristol.citizenspace.com/city-transport/floodstrategy
https://www.theccc.org.uk/flooding-indicators/figure-2-1/
37 Land quality policies https://www.oxford.gov.uk/downloads/file/580/oxfordshire_planning_advice_note_-
_dealing_with_land_contamination
https://webcache.googleusercontent.com/search?q=cache:_w-
jCwRaMWkJ:https://www.oxford.gov.uk/download/downloads/id/581/land_quality_strategy.pdf+&cd=3&hl=sv&
ct=clnk&gl=uk
https://www.cambridge.gov.uk/sites/default/files/docs/Contaminated%20Land%20Strategy.pdf
https://www.cambridge.gov.uk/sites/default/files/docs/Developers%20guide%20to%20contaminated%20land.pd
f
23Oxford Sustainability Index – 2016
Appendix C – Data matrix
The summary data matrix is included below.
Category Indicator Unit Worst Best Oxford Weighting
CO2 intensity CO2/capita 16.3 3.2 5.9 40%
CO2
CO2 intensity CO2/£million 0.4 0.0 0.1 40%
Emissions
CO2 reduction policy % reduction/year (CoM) 0.0 0.0 0.0 20%
Renewable electricity % renewables 0.0 0.2 0.0 40%
Renewable
Renewable heat RHI accredited installations 0.0 1.8 0.4 40%
Energy
Renewable energy policies Renewable Policy Score 1.0 4.6 2.8 20%
Total Energy consumption MWh/Capita 32.1 10.8 18.7 25%
Energy intensity MWh/£million 1117.0 95.2 299.6 25%
Domestic Energy consumption
MWh/dwelling/year 22.2 10.4 16.9 15%
Energy residential buildings
Efficiency Energy consumption of 2
MWh/m /year 1.7 0.3 1.3 15%
commercial/industrial buildings
Fuel poverty % living in fuel poverty 18.9 5.6 11.9 10%
Energy efficient building policies % average energy reduction/dwelling/year 0.0 0.0 0.0 10%
Use of non-car transport % travelling by active/public transport 0.1 0.5 0.3 30%
2
Bicycle network km cycling network / km 0.0 0.7 0.5 25%
Public transport network Percentage of buses running on time 63.0 96.0 74.0 15%
Transport Number of charging points per 1000
Public Charging Posts 0.0 0.6 0.1 15%
citizens
% reduction of per capita transport
Transport policies 0.0 0.0 0.0 15%
emissions
Water consumption litres PCC 175.0 123.1 129.0 50%
Water Water system leakages % leakage 0.3 0.2 0.3 30%
Water policies Potable Water Policy Score 1.0 2.8 1.9 20%
Waste Residential waste production kg waste/capita/year 489.9 261.5 298.8 40%
24You can also read


