Capital Markets Story - May 2020

Page created by Dale Phillips
 
CONTINUE READING
Capital Markets Story - May 2020
Capital Markets Story
                 May 2020
Capital Markets Story - May 2020
Table of contents

1   E.ON’s Q1 2020 Update

2   Strategic Update

3   Financial Update

4   Appendix
Capital Markets Story - May 2020
E.ON’s Q1 2020 Update
Capital Markets Story - May 2020
E.ON Q1 2020 results
Q1 2020: Solid financial and operational performance

              innogy integration progressing as planned,                                           Key Financials1
              synergy delivery on track                                                              €m                                            € bn
                                                                                                     1,548
              Virtual Annual General Meeting scheduled,                                                       1,460
                                                                                                                                                          40.2
              dividend proposal of €0.46/share                                                                                                     39.4

              Accelerated network investments feed RAB
              growth and better opportunities for customers
                                                                                                                                752
                                                                                                                                        691
              +150k customer accounts in Q1 2020

              Q1 2020 financials in line with expectations,
              but impacted by warm weather

              Group guidance for FY 2020 confirmed,                                                       EBIT                Adj. Net Income   Economic Net Debt2
              reflection of Covid-19 impact as of 30th April                                            Q1 2019 pro forma          Q1 2020

1. Adjusted for non operating effects, pro forma figures Q1 2019, not audited 2. Economic Net Debt as per 31 Mar 2020 and 31 Dec 2019                                 4
Capital Markets Story - May 2020
Energy Networks: ~90% of EBIT protected against
volume variation
 1 Germany (schematic)                                                  2 Mechanisms in other main markets
                                                  Unutilized allowed
Allowed revenue                                   revenue reversed1        • Sweden: Revenue cap, full flexibility of recovery
 utilization (%)                                                           • Czech Republic: Revenue cap, recovery in t+2 in
     100%        100%    >100%      >100%
                                                                             line with ‘modest’ price increases

                                                                        3 Investments
      t=0          t=0         t+1          t+2        t+3        t+4
    expected      actual
                                                                           • Investment program not impacted
                                                                           • Energy Networks Capex plan up for 2020,
                    Recovery of unutilized revenues                          now at ~€3.3bn (+€100m)
                    2020 via regulatory account
                    between 2022 - 2024

1. Provided for in regulatory mechanisms
                                                                                                                                 5
Capital Markets Story - May 2020
Customer Solutions: proactive sell-back management
and focus on operational excellence in bad debt steering
1 Covid-19 related sell-back volumes as of 30th April
             Share of 2020 volumes              … of which sold    • Total Group impact of Covid-19 related sell back
          exposed to demand fluctuation       back to the market
                                                                     volumes for 2020 currently at high double digit
   GER                16%                            9%              million € level.
   UK                 13%                            9%            • EBIT realization only with settlement of
   NL                 10%                            7%
                                                                     contract and thus only limited impact on Q1
                                                                     earnings.
2 Key metrics for payment behavior as of 30th April
             Government          Change of                Day of
             intervention     payment behavior            sales
                                                                   • Total Group write-offs for bad debt related to
   GER
                                                                     Covid-19 at a low double digit million euro level
   UK
                                                                     in Q1.
   NL
                                                                   • No major change in payment behavior observed
   unchanged/low       slight change/medium        worsened/high     across E.ON markets
                                                                                                                         6
Capital Markets Story - May 2020
EBIT development impacted by mild weather in Q1 2020                                                                               E.ON Q1 2020 results

EBIT1 Q1 2020 vs. Q1 2019 pro forma                                             Key drivers
€m
        Q1 2019
                                                                1,548
       pro forma
                                                                                     Energy      –•   Germany: weather-related lower volumes

         Energy                                                                    Networks      –•   Sweden: lower WACC in new regulatory
                                            -89                                                       period
       Networks

       Customer
                                    -52
       Solutions

Corp. Functions                                                                    Customer      –•   Weather impact on volumes
                                               +34
 & Other, Cons.                                                                    Solutions     +•   UK: restructuring benefits

       Non-Core                                   +19

                                                                                               +/–•   PreussenElektra: higher achieved prices,
        Q1 2020                                   1,460                             Non-Core          higher depreciation from purchase of
                                                                                                      production rights

1. Adjusted for non operating effects; pro forma figures Q1 2019, not audited                                                                         7
Capital Markets Story - May 2020
Adjusted Net Income in line with EBIT development                                           E.ON Q1 2020 results

Q1 2020
€m
 Group EBIT1                                                   1,460

    Economic
                                                        -297
interest result

        Profit
                                                      1,163
before Taxes1

Income taxes                                   -291                    Tax rate at   ~25%
    Minorities                          -181

                                                        0.27 EPS (€ per share)
    Adjusted
                                        691
 Net Income1

1. Adjusted for non operating effects                                                                          8
Capital Markets Story - May 2020
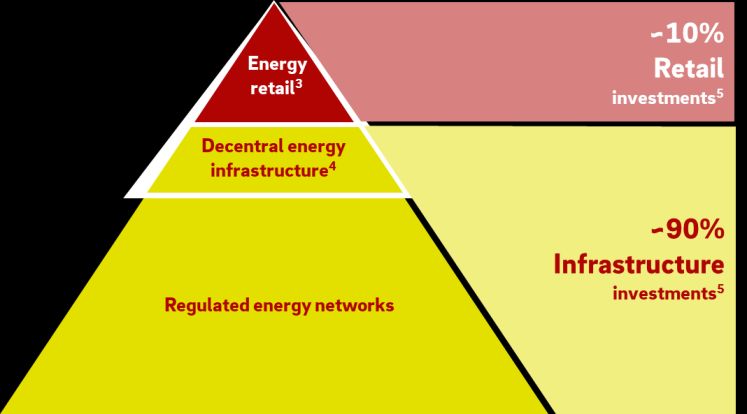
Q1 2020 Economic Net Debt reconciliation                                                                                                                    E.ON Q1 2020 results

  € bn

          -8.9             Asset Retirement Obligations (ARO)                                                                                                     -8.8

                           Pension provisions                                                                                                                     -6.8
          -7.2             Net financial position

         -23.4                                                                                                                                                   -24.6

                                                                                                               +0.3
         -39.4                                                                        +1.1

                                   -0.9                                                                                                  -0.7                    -40.2
                                                             -0.7
         END                       OCF                Net Investments          Transfer of Nord             Pensions2            Other (incl. AROs)              END
       FY 2019                   Q1 2020                 Q1 20201             Stream 1 into CTA                                                                 Q1 2020

1. Net of divestments 2. w/o effects from CTA funding and pensions contributions; actuarial interest rates for German pensions at 1.7% (vs. 1.3% @ FY 2019), for UK            9
pensions at 2.6% (vs. 2.0% @ FY 2019)
Strategic Update
Why invest in E.ON?

                                             1   We commit to a sustainable dividend per share
                                                 growth of up to 5% annually until 2022 and further
                                                 growth beyond

                    Dividend
                    growth
                                             2   We are the green investment opportunity and we
                                                 enable the energy transition

              Customer centric
                   energy
               infrastructure                3   We focus on customer centric energy infrastructure
                                                 which is the core of our resilient portfolio

   Sustainability              Performance
                                             4   Performance culture is part of our DNA and we
                                                 continuously deliver on operational excellence
                                                                                                      11
Why invest in E.ON?

                                       Dividend
                                       growth

                                   Customer centric
                                        energy
                                    infrastructure

                      Sustainability              Performance

                                                                12
Net zero is the new normal – E.ON is driving carbon reduction

Global challenges                                                           E.ON’s contribution                                                     Focus SDGs5

 IPCC1 long term goal to limit global                                         Avoided emissions together with our clients

 warming to        1.5°C                                                      2019:     >100m tons CO2
 German greenhouse gas emissions to be cut
                                                                              One out of five renewable
 by 55% by 2030
               2
                                                                              assets in Europe3 connected to E.ON’s grids

 Green Deal: The EU will be climate neutral                                   E.ON will become carbon neutral4

 by   2050                                                                    by   2040
1. Intergovernmental Panel on Climate Change 2. Pre Green Deal 3. Considering EU27 4. Carbon neutrality by 2040 (Scope 1 and 2), 75% carbon reduction by 2030         13
(Scope 1 and 2), 50% reduction of Scope 3 emissions by 2030, carbon neutrality by 2050 (including Scope 3). Base year: 2019 pro forma 5. UN Sustainable Development
Goals
Decarbonization means deep electrification

European1 energy demand 2015 vs. 2050…                                              … with huge impact on energy infrastructure
TWh
                                                                                      Increase of electricity demand (+90%)
         ~12,500                                                                      • Deep electrification of different sectors and
                           -40%                    ~7,000
                                                                                        decentral generation creates the need for
                                                                                        substantial grid investments
                                                                                      • Substitution of fossil fuel consumption through
                                                                                        green electricity

                           +90%
                                                    ~67%                              Reduction of total energy demand (-40%)
            ~20%
             2015                                    2050                             • Major decarbonization goals provide business
                                                                                        opportunities for energy efficiency products and
                                                                                        services
    Power       Other
1. Considering EU27, Source: https://www.eea.europa.eu/data-and-maps/figures/primary-and-final-energy-consumption (energy demand)/ http://inrestruct.com/wp-   14
content/uploads/2015/04/Practical-guide-to-a-low-carbon-Europe-2050.pdf (power demand)
Decentralization means digitalization and efficiency potential

The complexity within DSOs is increasing ...
Decentralization drives system complexity                                                               E.ON provides digital solutions to capitalize on it
                                       Energy Management System
                                                                        Regional Energy Market
                                                                                                        EnergieMonitor & Klima-Navi
    Customer                                   Smart Home                                               Transparency about CO2-footprint and
     interface        Storage
                                                                                        CO2 Footprint
                                                                                                        impact of energy transition to
                                                                                        App
   (data usage)
                                                                                                        municipalities and customers
                                Asset Control Systems      Local Energy System

                                         Predictive
                                         Maintenance
                                                                          System
                                                                          Flexibility
                                                                                                        Predictive Maintenance
    Network
    operation                                           Data, AI                        Control         Data-driven decisions with
                                                                                        Center
(data distribution)                                                                                     machine learning
                                         Asset                           Automated Grid
                                         Monitoring                      Planning

                          Generation                    Network                 Buildings               Grid Smartification
     Physical                                                                                           Intelligent substation collects real-time
       assets
 (data generation)                         E-mobility                                                   data from our networks to enhance grid
                                                            Broadband                                   management
                                                                                                                                                              15
Why invest in E.ON?

                                       Dividend
                                       growth

                                   Customer centric
                                        energy
                                    infrastructure

                      Sustainability              Performance

                                                                16
E.ON transformed into Europe’s energy infrastructure powerhouse

E.ON’s strategy implementation accelerated by innogy takeover

 Long-term                    2x                          2x                   ~80%                 Integration              ~€740m
 energy infrastructure        Regulated Asset     Base1   customer accounts    regulated earnings   bundling of synergies    delivery of annual net
 substitutes increasingly                                                      with benefits for    for the benefit of our   synergies by 2022
 merchant renewable                                                            credit   rating2     customers
 assets

1. German RAB 2. Based on 2020 EBIT, EBIT adjusted for non operating effects                                                                          17
Infrastructure is at the heart of E.ON’s capital allocation

                                                                                                                                                              ~10%
                                                                                   Energy                                                                     Retail
  Customer Solutions1                                                              retail2                                                                investments4
                                                                          Decentral energy
                                                                           infrastructure3

                                                                                                                                                       ~90%
                                                                                                                                               Infrastructure
  Energy Networks1                                                  Regulated energy networks                                                             investments4

1. IFRS segments used in external reporting 2. Includes Energy Sales and Services and New Solutions 3. Includes City Energy Solutions and B2B Solutions                  18
4. Excludes investments in Corporate Functions & Other and Non-Core
Energy transition driving multi-decade investment
opportunities
Industry investments in German power distribution networks excluding Green Deal upside
€ bn

          Drivers

                                                                                                        6.7
                                                               4.7
                      2.5

                      2010
                      2009                                     2020                                    2030                   2050
Source: Historic values: Bundesnetzagentur Monitoringbericht 2019. Future outlook: dena-Leitstudie Integrierte Energiewende          19
1. Assuming 2% inflation beyond 2020
E.ON is the leading energy network company in
Northern and Central Europe
E.ON Regulated Asset Base (RAB) – regional split
€ bn

     Total RAB1, 2

    33.2                               Sweden                                          Germany                                      CEE2 &Turkey2

    Power RAB           Gas RAB

                                       3.8                                             21.9                                                 7.6

1. RAB is the value of all distribution assets determined by the regulator. In general, RABs from different regulatory regimes are not directly comparable due to significant
                                                                                                                                                                                  20
methodical differences. These include for example different regulatory asset lifetimes, asset valuation methods or treatment of customer contributions for network connections.
Central Eastern Europe including: Czech Republic, Hungary, Poland, Romania, Slovakia 2. 100% view for Slovakia and Turkey
Long-term RAB growth with further upside potential

E.ON Regulated Asset Base1 growth
€ bn
                                                                                                                       Power
                         33.2                  3-5%                                                            • Multi-decade growth potential
                                                  CAGR2                                                          stemming from mega-trends

                                                                                                                       Gas
    Power                27.7
                                                                                                               • Optimizing our existing gas asset
                                                                                                                 base with limited investment needs
                                                                                                               • Future growth option from hydrogen
        Gas               5.5
                          2019                                                2022                                                         Beyond

1. RAB is the value of all distribution assets determined by the regulator. In general, RABs from different regulatory regimes are not directly comparable due to significant
                                                                                                                                                                                21
methodical differences. These include for example different regulatory asset lifetimes, asset valuation methods or treatment of customer contributions for network
connections, including 100% view for Turkey and Slovakia. Constant year-end 2019 FX-rates 2. Relates to power RAB
Gas distribution with stable earnings and limited capex

Gas activities closely coupled with power business                              Limited capex spent on gas

 ~90% of German gas network business is                                                         ~5% of Group capex is spent
                                                                                                                          1

 linked to electricity concessions                                                              on our gas business

The role of gas in German heating market2                                       Future potential for industry and transport

             37%                       37%
                                                             Other
      14%

             50%
                                       26%                   District heating
                                                             Gas
                                                                                    H2
                                       37%

     Existing connections           New-builds
1. Cash effective investments, average for 2020-2022 2. Source: BDEW 2020
                                                                                                                              22
Four years of regulatory stability

Regulatory periods per country
                       2020             2021             2022             2023             2024            2025              2026    2027      2028

 Germany (Gas)
Slovakia1
         Turkey
  Poland
Czech Republic1
        Hungary
       Romania

                                                                                                           70%2 of the Energy Networks
       Germany
        (Power)

                                                                                                           EBIT is highly visible until 2024

        Sweden

1. Length of upcoming regulatory period still under discussion 2. Based on 2019 pro forma EBIT, adjusted for non operating effects
                                                                                                                                                      23
Exemplary earnings components beyond allowed return

                           Opex efficiencies         Regulatory cost
                             Actual opex vs.
                              allowed opex
                                                       recognition                  Total
   Allowed      RAB
               growth
                                                                             =   regulated
   return
                          Capex efficiencies
                        Outperformance of standard
                                                     Special incentives
                                                      E.g. reliability and
                                                                                  earnings
                          prices set by regulator      network losses

    Allowed return       Additional earnings components in our markets

                                                                                             24
Leveraging strong partnerships and core competencies to
drive additional businesses
Long-term partnerships with municipalities …       … create a competitive edge for additional businesses

                                                     Technical grid services              Smart meters
   Non-concession-                   Concession-
   based RAB                          based RAB
                                                           e.g. O&M                      e.g. installation
   ~1/3                                    ~2/3
                            RAB
                                                           Broadband                Water and waste-water
                          €21.9bn1
                                                       e.g. new customer               e.g. supply and
                                                          connections                     operations

                      >9,000                       … including other areas benefitting from our partnerships

                concessions in Germany                           City Energy Solutions (CES)
                                                            Local heating and cooling solutions for
                                                            municipalities, districts and single sites

1. German power and gas RAB
                                                                                                               25
Earnings growth from reducing carbon emissions via
decentral energy infrastructure
Low temperature heating                                                        Large B2B solutions/district
and cooling grids                                                              heating grids

                                                                                                                                          Top 2
E.g. ectogrid: zero emission                                                   On-site generation solutions
energy hybrid system with up                                                   Average contract duration: 15-40 years
to 20% cost savings
                                                                                                                                          market position in
                                                                                                                                          Sweden and Germany1

                                                                                                                                          ~25%
City quarter solutions
Integrated energy concepts
                                                                            Single/multi-site solutions
                                                                            Decentralized sustainable local energy
                                                                                                                                          CAGR
                                                                                                                                          EBIT 2020-20222
e.g. Werksviertel Munich
                                                                            solutions (e.g. PV at Audi in Győr, Hungary)
Average contract duration: 20-40 years
1. City Energy Solutions, based on heating volumes sold 2. City Energy Solutions and B2B Solutions, EBIT adjusted for non operating effects
                                                                                                                                                                26
Continuous customer growth outside the UK

B2C Customer accounts (m)                                                            Creating a future proof business

               49.3                               49.2
                                                                                       Loyalty through                Scaling bundles, value-added services and
                                                                                       Bundling                        referral programs
               13.0              ~380k            13.4
                                                                                                                      >150k bundle contracts in Germany and >220k
                                                                                                                       bundles in Czech Republic

                                                                                        Customer                      Digitalization of customer interactions
                                 ~510k
               26.1                               26.6                                  Experience                    Data driven insights and personalized offers

                                                                                       Market Excellence              Predictive churn management
                                 ~1m                                                                                  Shift towards digital channels to reduce CtA2
               10.2                                9.2
                                                                                                                       and CtS3
              2018                                2019

      Germany           Other1         UK
1. Incl. Benelux, Poland, Sweden, Italy, Hungary, Czech Republic, Romania, Slovakia, Croatia, Slovenia, Turkey 2. Cost-to-Acquire 3. Cost-to-Serve
                                                                                                                                                                       27
Why invest in E.ON?

                                       Dividend
                                       growth

                                   Customer centric
                                        energy
                                    infrastructure

                      Sustainability              Performance

                                                                28
Performance culture is part of our DNA

Transaction related synergies                             npower & E.ON customers migrated          Operational excellence
                                                          onto new platform E.ONnext
✓ Synergy delivery on track                               EBIT1 development                               Continuous improvement
                                                          GBP m
                                                                          ~100m

✓ 5% achieved in 2019
                                                                                                          Digitalization & innovation
                                                            2019              2022   2023   >2023

✓ Measures validated and                                    Earnings improvement: Combined
  delivery de-risked                                         EBIT1 of at least GBP100m in 2022            Regulatory outperformance
                                                             and improvement beyond

✓ €740m confirmed target                                    Free cash flow will be                       Customer satisfaction
    by 2022                                                  positive2 from 2023 onwards
                                               Top priorities                                            Performance culture
1. Adjusted for non operating effects 2. After smart meter investments
                                                                                                                                        29
Synergy delivery fully on track

Estimated transaction related net synergies1 of ~€740m                                                                     Synergy delivery by division

                                                                                                       ~100%
                                                                                                                                                                 27%
                                                                         ~45%
                                                                                                                                   53%
                                          ~20%
             5% ✓                                                                                                                                                20%

            2019                           2020                           2021                          2022

                                 1. Start of voluntary           1. Full integration of          1. Synergies in Energy                     Customer Solutions
                                    leave program                   headquarter                     Networks
                                                                                                                                            Energy Networks
                                 2. External budget cut          2. Organizational               2. Integration of
                                 3. Optimization of IT              integration of                  customer portfolios                     Central Functions, IT and Other
                                    services                        Customer Solutions           3. Consolidation of IT
                                                                    businesses                      landscape

1. Net accretive to EBIT, EBIT adjusted for non operating effects and before implementation costs (implementation costs not included in adjusted EBIT)
                                                                                                                                                                              30
Renewal of IT architecture to drive operational excellence
in Customer Solutions
Germany: Digital Attacker                                                           UK: Migration to new platform ensures higher profitability

Continuous ramp up of contracts to new                                               Step 1                                      Step 2
platform (schematic)                                                                 Migration of npower’s B2C and               Migration of E.ON’s B2C and
                                                                                     SME customers onto E.ONnext                 SME customers onto E.ONnext
15m

10m

  5m
                                                                                     • Combined EBIT of at least GBP100m in 2022
              2020                                 2025                              • Compared to previous plan: EBIT improvement 2023
                                                                                       by more than GBP50m and more than GBP100m
• Already today at competitive Cost-to-Serve level                                     beyond 20231
• Ambition: reduction to market leading level at                                     • Free cash flow positive from 2023 onwards2
  low teens (€/customer)
                                                                                     • Total restructuring charges3 remain at up to GBP500m
1. Compared to business plan announced in November 2019 2. After smart meter investments 3. Majority to be shown in non operating result
                                                                                                                                                               31
E.ON’s performance culture adds sustainable
value to businesses and customers
German power network efficiency scores                                     Sweden power network efficiency scores

      >€600m additional revenues                                            100%
      in regulatory period1                                                                           E.ON grids

          100%
                                                                                     Very efficient
                                                                             85%
                                   95%
                                              Industry average 94%

                                                                                     Efficient
                                                                             70%
     8/9 E.ON grids          1/9 E.ON grids

8/9 E.ON networks obtain a 100% efficiency score,                          All E.ON grids considered very efficient, with 2/3
with 3 obtaining a super efficiency bonus                                  being 100% efficient

1. Based on ~€4bn allowed power cost base relevant for efficiency factor
                                                                                                                                32
Financial Update
We commit to annually grow the dividend per share by up to 5%

Dividend per share (DPS)

                               €0.43       €0.46

                   €0.30
      €0.21

                                                                            Growth beyond
      2016
              ✓     2017
                           ✓   2018
                                       ✓   2019
                                                   ✓   2020   2021   2022

                                                                                            34
We commit to our 2020-2022 delivery plan

                  Dividend per share (DPS) growth up to 5% p.a.

                     EBIT1 growth
                  Group                                                                         EPS1 growth
                                                                                             Group

                  7-9% CAGR                                                                  10-15% CAGR
                       cash conversion
                  Average                                                                                     strong
                                                                                                    Capital structure with

                  rate2of 95%                                                                       BBB/Baa rating
1. Adjusted for non operating effects; reflection of Covid-19 impact as of 30th April 2020 2. Excluding provision utilization for nuclear decommissioning, average for 2020-2022
                                                                                                                                                                                   35
Strict capital allocation framework leads to sound
investment profile
Sustainability focus                                    Return framework                                 Capital allocation in line with business priorities

Sustainability criteria:                                  Hurdle rate composition:                       Indicative hurdle rates2:

✓    Enable energy transition                                     WACC
                                                      (country & technology specific)
     Supporting SDGs1
                                                                                                                       6-11%
✓
✓    Reduce customers‘ emissions                        Project specific risk premium                              4-9%
     Human rights violations
                                                     E.ON Group excess return target
                                                                                                          3-8%
     Carbon heavy generation

     Environmental degradation                                    Hurdle rate

1. UN Sustainable Development Goals 2. Illustrative hurdle rate ranges; post tax. Final hurdle is risk adjusted for each project and might vary 3. Includes New Solutions and
                                                                                                                                                                                36
Commodity Sales and Services 4. Includes City Energy Solutions and B2B Solutions 5. Excludes investments in Corporate Functions & Other and Non-Core
E.ON allocates ~75% of investments to Energy Networks

Investments 2020                                                                        Investments 2020-2022
€ bn                                                                                    € bn

                                                        ~90%2                                                                                            ~90%2
                                                        infrastructure                                                                                   infrastructure
                        ~4.51                                                                                         ~131

                                                      Energy Networks           Customer Solutions          Other3

1. Cash effective investments including Corporate Functions & Other and Non-Core, reflection of Covid-19 impact as of 30th April 2020 2. Based on investments in Energy
                                                                                                                                                                          37
Networks and Customer Solutions 3. Corporate Functions & Other and Non-Core
Investments with strong focus on infrastructure

Energy Networks 2020-2022                                                            Customer Solutions 2020-2022
€ bn                                                                                 € bn

                                                             100%                                                           ~65%
                         ~9.71                               infrastructure
                                                                                                      ~2.71                 infrastructure

                                                                                             B2B Solutions             IT driven retail investments
                                                                                             City Energy Solutions     New Solutions
                   Power          Gas        Other                                           UK smart meter roll-out   E-mobility
1. Cash effective investments, reflection of Covid-19 impact as of 30th April 2020
                                                                                                                                                      38
Attractive Group earnings growth

EBITDA1                                                         EBIT1                                              Outlook1
€ bn                                                            € bn                                               CAGR

                                                                                                                         3-4%
                           7.1-7.3
               6.9
       0.6
                1.1                                                             4.1          3.9-4.1
                                                                                                                                  EBITDA
                                                                        0.5               0.4

                5.4
                                                                                 3.6                                      7-9%
                                                                                                                                      EBIT
               2019           2020                                              2019            2020                          2020-2022
             pro forma                                                        pro forma

Guidance:          Energy Networks            Customer Solutions          Corporate Functions & Other   Non-Core
1. Adjusted for non operating effects; reflection of Covid-19 impact as of 30th April 2020
                                                                                                                                             39
Mid-term growth in Energy Networks earnings backed by
organic RAB growth
EBITDA1                                                         EBIT1                                  Outlook1
€ bn                                                            € bn
               5.4         5.2-5.4
               1.0                                                              3.6          3.3-3.5
               0.7                                                               0.6
                                                                                 0.5

               3.7
                                                                                 2.4

              2019            2020                                             2019           2020                2020-2022
            pro forma                                                        pro forma

Guidance:          Germany            Sweden           CEE & Turkey
1. Adjusted for non operating effects; reflection of Covid-19 impact as of 30th April 2020
                                                                                                                              40
Customer Solutions earnings growth driven by digitalization and
UK turnaround
EBITDA1,2                                                      EBIT1                                                       Outlook1                           Guidance as of
€ bn                                                           € bn                                                                                           May 2020

                           1.0-1.2
              1.1
                                                                               0.5         0.4-0.6
               0.3
                                                                               0.1
               0.2                             Decentral energy                0.1
                                                 infrastructure
               0.6                                        ~30%                 0.5

              2019            2020                                             -0.2           2020                                               2020-2022
            pro forma
                                                                              2019
                                                                            pro forma

Guidance:          Germany           UK        Benelux         Other
1. Adjusted for non operating effects; reflection of Covid-19 impact as of 30th April 2020 2. ~30% EBITDA share relating to decentral energy infrastructure
                                                                                                                                                                               41
Strong EPS growth of 10-15%

Adjusted Net Income1                                            Earnings per share1                 Outlook1
€ bn                                                            €                                   CAGR
                 1.7-1.9
         1.6

                                                                               0.63 0.65-0.73
                                                                               Payout
                                                                                                       10-15%
                                                                                ratio
                                                                                73%

              2019            2020                                             2019          2020              2020-2022
            pro forma                                                        pro forma

1. Adjusted for non operating effects; reflection of Covid-19 impact as of 30th April 2020
                                                                                                                           42
Significant refinancing benefits over the next three years

Bond maturities as of May 20201,2
€ bn
                                                                                                      Refinancing benefits                                        17.2

     Volume
                                                                                                                   until 2022 of up to
%    Coupon
                                1.8                                                                               ~€200m3
                                                              1.5
                               0.4%                                                                   1.3
                                                    1.2
                                          5.7%               0.0%                           1.1
                                                                                  5.9%               5.6%                                     0.9
                                                                                                                          0.8
  0.6                 0.6                          0.0%                                                                                               3.9%
                                                                                                                                    0.5
                               6.5%                                                        0.4%
                                                             0.8%                 0.3                0.0%                3.0%                0.0%
 3.2%                6.5%                          5.5%                                                                            0.9%
                                                                                 5.5%
  Q4                  Q2         Q3                 Q3        Q4                   Q1       Q2        Q4                  Q1        Q2        Q3                 >2024
 20202               2021       2021               2022      2022                 2023     2023      2023                2024      2024      2024

1. Bonds issued by E.ON SE and E.ON International Finance B.V. (fully guaranteed by E.ON SE); bonds issued by innogy SE and innogy Finance B.V. (fully guaranteed by innogy SE)
                                                                                                                                                                                  43
2. Including innogy EIB-loan €645m 3. Amount of refinancing benefits depends largely on refinancing conditions at time of bond issuance.
Green financing is an integral part of our funding strategy

Total investments 2020-2022                                                            To finance our investments we have tapped the
€ bn                                                                                   green bond market …
                                                  95%                                  €4.6bn outstanding                       4
                                                  energy transition
                                                  investments2
                                                                                         … and intend to issue more:

                             131                                                       ~€1bn p.a.
                                                                                       Revolving credit facility linked to sustainability ratings:

                                                                                       €3.5bn
     Energy Networks           Customer Solutions          Other3

1. Cash effective investments including Corporate Functions & Other and Non-Core, reflection of Covid-19 impact as of 30th April 2020 2. Based on investments in Energy
                                                                                                                                                                          44
Networks and Customer Solutions 3. Corporate Functions & Other and Non-Core 4. €3.75bn issued by E.ON SE and €0.85bn issued by innogy Finance B.V., including Green
Bond issuance April and May 2020.
E.ON’s approach to manage Economic Net Debt

Economic Net Debt
€ bn
     Q 1 2020

                           “Beat the           • 0% real discount rate floor reached: only upside
       -8.8
                           provisions”         • Further upside: outperforming provisions by operational excellence

                           “Focus on the • UK pension obligations largely funded
       -6.8                long end”     • Sensitivity GER pensions: -50bps +€1.6bn2
                                         • Duration of pension obligation ~18 years
      -24.6
                           “Manage for         • Sound management of cash flow
                           cash”               • Re-financing benefits from lower interest rates
     -40.2
   AROs1        Pensions       Net financial position
                                                                                                                      45
Debt management to bring leverage down

Leverage factor1                                                                         Selected Economic Net Debt effects 2020-20222
                                                                                         • 95% Cash conversion rate3
Strong      BBB/Baa rating target
                                                                                         • Working Capital optimization program &
              5.7x                                                                         ARO4 reduction ~+€1bn
                                                                                               (ARO reduction: ~€200m already achieved 2019)

                                                                                         • Nord Stream 1 transfer to pension fund ~+€1bn
                                              ~5x
                                                                                         • Transaction effects ~-€0.5bn
                                                                                               Remedy proceeds, locked box settlement, merger squeeze out,
                                                                                               restructuring Hungary

              2019                            2022
                                                                                         • Integration costs up to ~-€1bn
            pro forma
1. Economic Net Debt/EBITDA, EBITDA adjusted for non-operating effects 2. Negative effect indicates increase of Economic Net Debt and vice versa; reflection of Covid-19
                                                                                                                                                                           46
impact as of 30th April 2020 3. Excluding provision utilization for nuclear decommissioning, average for 2020-2022 4. Asset Retirement Obligations
Dividend commitment fully in line with deleveraging

EPS1 above DPS growth…                                           …lowers payout ratio…              … allowing deleveraging and
                                                                                                    sustainable dividend growth

                                                                                                      5.7x      Strong BBB/Baa rating
                                                                                                                        target
                                                                        73%
                                                                    Payout ratio
                                                                                                                        ~5x

   2019         2020         2021          2022                          2019                2022     2019              2022
 pro forma                                                             pro forma                    pro forma

1. Adjusted for non operating effects; reflection of Covid-19 impact as of 30th April 2020
                                                                                                                                        47
Appendix
Guidance overview as of May 2020
                                                                                                                                                               Change in guidance
                                                                                                                                                               May 2020
 € bn                                                                                    2019 pro forma3                                20204                          2020-20224
 EBITDA1                                                                                             6.897                           7.1-7.3                          3-4% CAGR
           Energy Networks                                                                            5.359                           5.2-5.4
           Customer Solutions                                                                         1.124                           1.0-1.2
           Non-Core                                                                                   0.617                           0.8-1.0
           Corporate Functions & Other                                                               -0.203                             ~-0.3
 EBIT1                                                                                               4.134                           3.9-4.1                          7-9% CAGR
           Energy Networks                                                                            3.582                           3.3-3.5
           Customer Solutions                                                                         0.526                           0.4-0.6
           Non-Core                                                                                   0.366                           0.3-0.5
           Corporate Functions & Other                                                               -0.340                             ~-0.4
 ANI1                                                                                                1.638                          1.7-1.9                        10-15% CAGR
 EPS1                                                                                                €0.63                     €0.65-0.73                          10-15% CAGR
 Dividend                                                                                            €0.46                    up to 5% p.a.                         up to 5% p.a.
 Capex2                                                                                              4.435                             ~4.5                                 ~13
           Energy Networks                                                                            3.149                               ~3.3                               ~9.7
           Customer Solutions                                                                         1.008                               ~0.8                               ~2.7
 Leverage                                                                                              5.7x                                                                  ~5x
1. Adjusted for non operating effects 2. Cash effective investments 3. Pro forma figures FY 2019, not audited 4. Reflection of Covid-19 impact as of   30th   April 2020
                                                                                                                                                                                    49
E.ON new segmentation from 2020 onwards

  IFRS reporting divisions
             Energy Networks                                       Customer Solutions                            Corporate                         Non-Core
                                                                                                                Functions &
        DE             SWE         CEE1 & TR               Benelux2        DE         UK       Other3                                          PE4            TR Gen5
                                                                                                                   Other

                    Power grid                                  City Energy                 Energy
                                                                 Solutions                 sales and
                     Gas grid                                      (CES)                    services
                                                                                             New
             Additional businesses                            B2B Solutions
                                                                                           Solutions

                  Regulated                           Decentral energy                   Energy
                  networks                             infrastructure                     retail

                                  Infrastructure
1. Central and Eastern Europe, including Czech Republic, Hungary, Poland, Romania, Slovakia, Croatia and Slovenia 2. Belgium, The Netherlands and Luxemburg             50
3. Including Czech Republic, Hungary, Italy, Poland, Romania, Sweden 4. PreussenElektra 5. Turkey Generation
E.ON’s strong ESG profile

Environmental                                             Social                                                     Governance

                Climate neutrality by 2040                                 Variety of nationalities, cultures,
                                                                           generations and genders                    Supervisory
                (Scope 1 & 2) & by 2050                     Diversity                                                                 Experienced, diverse and independent
                                                                           in management & workforce                  Board
                (including Scope 3)1

                Avoided emission together with              Health &       Creation of a work environment
                                                                                                                                      Efficient cooperation in Board
                our clients                                                that protects the health and safety
                                                            Safety                                                                    Committees
                2019: > 100mtons                                           of customers and employees
                                                                                                                      Supervisory
  Climate                                                                                                             Board
                                                                           Commitment to respect                      Committees
                Driving the energy transition
                through decentral & digital
                                                            Human          human rights, uphold labor                                 Creation of Innovation and
                                                            Rights         standards, and fight against                               Sustainability Committee
                local networks
                                                                           corruption

                                                            Security of
                                                                           Energy Networks: High                                  Remuneration system closely
                Energy efficiency solutions with our        energy
                clients to reduce carbon emissions          supply
                                                                           resilience due to high degree             Remuneration aligns management’s and
                                                                           of underground cabling                                 shareholder’s interest

1. Carbon neutrality by 2040 (Scope 1 and 2), 75% carbon reduction by 2030 (Scope 1 and 2), 50% reduction of Scope 3 emissions by 2030, carbon neutrality by 2050            51
(including Scope 3). Base year: 2019 pro forma
E.ON’s sustainability awards, ratings and rankings

                                                                             CDP Score: B
      Text 1                Result: AA                              Text 1
                                                                             Sector Average: C

                                                                             Overall ESG Score: 3.2
                            Overall ESG Score = 81 (Leader Group)
      Text 1                                                        Text 1   Sub Sector Average Multiutilities: 2.8
                            Relative Position 11 out of 192
                                                                             Industry Average Utilities: 2.7

                            E.ON is index member1, i.e. one                  E.ON ranks 4th in the Green Utilities
      Text 1                of the 120 most advanced                Text 1   Report from Energy Intelligence (EI)
                            companies in Europe + Eurozone                   Group

                            Rating: C+                              Text 1   E.ON ranks 6th out of 30

1. Vigeo/EIRIS was acquired by Moody’s in 2019                                                                        52
Building blocks of allowed revenues in Germany

Schematic illustration for 2019 (power & gas)
€ bn
                    ~21.2
       Gas           ~1.1
     (New)                                                                                  Totex indexed to
      Gas            ~3.4                                                                   CPI and subject to            Thereof:                             Thereof:
      (Old)                                                                                 general and individual     ~4.0 power                            ~8.3 power
                                                                                            efficieny targets          ~0.7 gas                              ~1.2 gas

     Power          ~10.2
     (New)                                                                                                                                         ~9.5

                                                                                                     ~4.7
                     ~6.5                              40% Cap                       Opex            ~3.0
     Power
      (Old)
                                                                                                     ~1.7        Capital Costs

              Regulated asset            Debt   base2            Regulated equity             Total allowed             Adjustment of       Allowed revenues
                  base1                                               base                      cost base              revenues, lagged
                                        (related to actual
              Old assets: current                                (related to regulatory          (Totex)                recoveries and
              costs; new assets:        capital structure,          capital structure,
                                         minimum 60%)                                                                 pass-through items
                historic costs                                      maximum 40%)

1. Old assets are those capitalized before January 1, 2006. New assets are those capitalized after January 1, 2006. Old assets are indexed up to 40% with asset-specific indices to   53
determine the current costs. Relevant asset base for calculation of allowed return in 2019 is 2016 for power and 2015 for gas 2. Debt base consists of non-interest and interest
bearing capital
Energy Networks Germany - Earnings components

Illustrative average EBITDA1 split (2019-2020)                                                      Illustrative average EBIT1 split (2019-2020)

                             0%                                                                                                             0%

                                     ~5%
                                                                  Regulated return & depreciation2                                                     ~5%
                                           ~10%
                                                                  Operational efficiency                                                                  ~5%
                                                                  Other infrastructure business3
          ~60%                                ~10%                Additional network-related business4                  ~50%
                                                                                                                                                           ~15%
                                                                  Other regulated earnings/temporary effects
                                                                  Income from participations
                                           ~10%
                                                                                                                                                  ~15%

                                        Income from participations portfolio is at-equity accounted
1. Adjusted for non operating effects 2. Includes return on RAB, difference between regulatory and IFRS D&A and revenues for grid expansion 3. Other infrastructure businesses   54
include e.g. water business 4. Additional network-related business includes broadband, smart meter and technical network services
Continuous improvement in operative
performance increases security of supply
SAIDI1,2 2014 vs. 2019                                                                  Power losses2 2014 vs. 2019
Germany                                                                                Germany

              48.0              -40%                                                                   4.4              -14%
                                                                                                                                              3.8
                                                     29.0

              2014                                   2019                                             2014                                  2019

Sweden                                                                                 Sweden
              144.0
                               +18%3                170.0                                              3.9              -23%                  3.0

              2014                                   2019                                             2014                                  2019

CEE4                                                                                   CEE4
              336.0             -36%                                                                   9.1              -22%                 7.1
                                                    214.0

              2014                                   2019                                             2014                                  2019
1. System Average Interruption Duration Index 2. E.ON stand-alone figures 3. SAIDI increase due to weather related effects in 2019 22 minutes of disturbances (2014-2019),   55
includes: weather effects and other system disturbances 4. Calculated as arithmetic average of respective countries
RAB growth further supported by local drivers

Power RAB development                                                                 Local drivers
€ bn
                   2-4% CAGR
                                                                                                               • Renewable connections
Germany1               17.3                                                                                    • Replacement
                                                                                                               • Digitalization
                      2019                                2022

                                  3-5% CAGR
                                                                                                                • Storm proofing
Sweden2                3.8                                                                                      • Renewable connections
                                                                                                                • Demand growth
                      2019                                2022
                                  4-6% CAGR
                                                                                                                • New connections of B2B customers
Czech
                       1.6                                                                                      • Reliability
Republic
                                                                                                                • Modernization
                      2019                                2022
1. Assuming constant number of network concessions 2. Excluding RAB re-evaluation following the beginning of new regulatory period                   56
Network charges are only a small portion of German power price

Composition of average electricity price        Decarbonization currently not optimally supported,
                                                electricity disadvantaged

                                                 • Renewables surcharge to be borne by more customers
                    Electricity Renewable
                                                 • Carbon minimum price or tax
                procurement, surcharge
                                                 • Electricity tax to be redesigned
                 retail margin

                                Further taxes
                 Network
                                and levies
                  charges                          German power price needs to be ‘cleaned up’
Only

23%
                                                                                                        57
EU financing successful for major growth projects across Europe
with up to ~€250 m funding grants

  • More than €500m investments planned                                       ACON2,3 1.0 / ACON 2.0
  • Around 50% approved in EU grants                                          • Increasing cross-border power distribution capacity and
  • All projects included in EU PCI1 list                                       grid modernization through implementation of smart grids

                                                                              Danube InGrid3,4
                                                                              • Improved security of supply and capacity in the boarder regions
                                                                              • Implementation of smart grids

                                                                              Smart Border Initiative3 (SBI)
                                                                              • Commission a cross-border smart distribution grid at low cost
                                                                              • Solving network bottlenecks and voltage problems intelligently

1. Project of Common Interest (EU Horizon 2020) 2. Again Connected Networks 3. Projects are part of the 4 th PCI list of EU 4. Danube Intelligent Grid
                                                                                                                                                         58
City Energy Solutions selected projects

Key figures                                   Project examples
                             Countries with   Högbytorp
                             CES projects              • 50% increase of renewable/recovered energy
      >750k customers                                  • 99% efficiency of CHP
                                                       • 659 GWh total output
                                              Hanseviertel Lüneburg
      ~5k installations                                • 8,100t CO2 savings per year
      under management                                 • 90% CHP efficiency
                                                       • 88% of heat demand covered by bio natural gas
                                              Werksviertel München
      350 heating, cooling                             • 50% less CO2
      & steam networks                                 • 10% lower energy cost
                                                       • High level of energy self-sufficiency
                                              Elephant & Castle London
                                                       • Inhouse construction management
       €1.5bn revenue                                  • 100% renewable heating supply
                                                         from 2023 (biogas)
                                                                                                         59
Customer numbers B2B & B2C

Continued growth outside UK (in m)1                                                        Thereof: electricity customers (in m) 1
Customer accounts                                                                                                           +0.3%
                                +0.2%                                                                      40.5                        40.6
               51.0                                51.1                                                    11.9                        12.0
                                                                                                            5.9                         5.9
                                                                                                    2.3                                         2.3
               14.2                                14.3                                                    10.5                        10.5
                                                                                                            9.8                         9.9
                9.6                                 9.6                                                   FY 2019                     Q1 2020

                4.3                                 4.3                                    Thereof: gas customers (in m) 1
                                                                                                           10.5             +0.0%      10.5
               13.0                                13.1                                                                                 2.3
                                                                                                            2.3
                                                                                                            3.7                         3.7
                9.8                                 9.9                                             2.0                                         2.0
                                                                                                            2.5                         2.5
             FY 2019                             Q1 2020
                                                                                                          FY 2019                     Q1 2020
      Germany           UK        Benelux         Other         Turkey

1. Including at-equity participations; Customer Solutions business of Croatia and Slovenia allocated to Energy Networks due to size                   60
21 TWh of production rights for PreussenElektra already
transferred - Terms challenged

                                                              Nuclear power plant Krümmel1
                                                           88 TWh of production rights (before transfer)

                                                               21 TWh                          ~€27.8/MWh preliminary price

                                                                         PreussenElektra
 Transferred
 production rights                   10 TWh                                               6 TWh                                                5 TWh

                 Grohnde plant                                                 Isar II plant                                            Brokdorf plant
  Production rights secured until Oct 2020                    Production rights secured until Jan 2021                   Production rights secured until Jan 2021
    5-10 TWh production rights required2                       15-20 TWh production rights required2                       5-10 TWh production rights required2

1. Krümmel OHG is a joint venture between E.ON and Vattenfall, each party owning 50% equity share 2. Volumes shown after transfer/purchase from Krümmel, excluding
                                                                                                                                                                     61
minority stakes (16.7% minorities in Grohnde, 20% in Brokdorf and 25% in Isar II)
Regulated earnings split share

EBITDA 20201
€ bn
                                                                                                         regulated
                                                                                           • Regulated or quasi

                                                                                                Earnings share of ~75%
                                                       ~75%
                                                       (Quasi-)regulated
                                                       earnings
                                                                                                                 strong
                                                                                           • Network operations in countries with
              7.1 – 7.3
                                                                                                regulatory frameworks
                                                                                           • Customer Solutions and Energy Networks

         Energy Networks            Customer Solutions          Other2
                                                                                                diversified across European countries
1. Adjusted for non operating effects; reflection of Covid-19 impact as of 30th April 2020 2. Other includes Corporate Functions & Other and Non-Core
                                                                                                                                                        62
Past delivery on guidance

EBIT1 vs. guidance                                        Adjusted Net Income1 vs. guidance
€ bn                                                      € bn

         3.1            3.1             3.0    3.2             0.9      1.4       1.5         1.5
         2016           2017            2018   2019            2016     2017     2018     2019
                                               reported                                   reported

       Guidance range
1. Adjusted for non operating effects
                                                                                                     63
Networks Capex breakdown 2020-2022

Germany                                                       Sweden                                           CEE
€ bn                                                          € bn                                             € bn

                      6.61                                                           1.11                                     2.01

  ~50%                                                          ~50%                                            ~60%
  investment in expansion                                       investment in expansion                         investment in expansion

                                                                   Maintenance        Grid expansion   Other
1. Cash effective investments; reflection of Covid-19 impact as of 30th April 2020
                                                                                                                                          64
Maintaining a substantial liquidity buffer is a cornerstone of
E.ON’s risk management
                                • €1.9bn in cash & equivalents                    Key takeaways
   Large volume of
                                • €1.2bn in short-term securities
   liquidity1
                                • €2.4bn of non-current securities               • Well-filled liquidity buffer

                                                                                 • Funding needs for 2020
                                • Early de-risking of refinancing needs for
   Bond refinancing
                                  2020: All bond maturities covered in January     already covered by bonds
   already covered                                                                 and credit facilities
                                  2020

                                                                                 • Back-up RCF undrawn and
                                • Remaining funding need for squeeze-out           fully committed
   Squeeze-out funding
                                  largely covered by €1.75bn undrawn
   need also secured
                                  acquisition facility (no MAC-clause1)          • Liquidity risk minimized,
                                                                                   even in highly volatile capital
                                • Undrawn €3.5bn Revolving Credit Facility         markets
   Plus further back-up
                                  (RCF), fully committed by 21 banks, no
   RCF available
                                  MAC-clause2
1. As per December 2019 2. MAC = Material Adverse Change
                                                                                                                     65
Benchmark bonds of E.ON Group as of May 20201

                                 Volume in millions in                                                                       Volume in millions in
Issuer                            respective currency       Coupon        Maturity        Issuer                              respective currency     Coupon        Maturity
innogy Finance B.V.                        570 GBP          6.500%         Apr-21         E.ON SE                                    1,000 EUR        0.375%         Sep-27
innogy Finance B.V.                      1,000 EUR          6.500%        Aug-21          innogy Finance B.V.                          850 EUR        1.250%         Oct-27
E.ON SE                                    750 EUR          0.375%        Aug-21          E.ON SE                                      500 EUR        0.750%         Feb-28
innogy Finance B.V.                        500 GBP          5.500%          Jul-22        E.ON SE                                      750 EUR        1.625%        May-29
E.ON SE                                    500 EUR          0.000%         Sep-22         innogy Finance B.V.                        1,000 EUR        1.500%          Jul-29
E.ON SE                                    750 EUR          0.000%         Oct-22         E.ON SE                                      750 EUR        0.350%         Feb-30
innogy Finance B.V.                        750 EUR          0.750%        Nov-22          innogy Finance B.V.                          760 GBP        6.250%         Jun-30
E.ON SE                                  1,000 EUR          0.375%         Apr-23         E.ON SE                                      500 EUR        0.750%         Dec-30
innogy Finance B.V.                        488 GBP          5.625%         Dec-23         E.ON SE                                      500 EUR        0.875%        Aug-31
E.ON SE                                    750 EUR          0.000%         Dec-23         E.ON SE                                      500 EUR        0.625%        Nov-31
innogy Finance B.V.                        800 EUR          3.000%         Jan-24         E.ON International Finance B.V.2             975 GBP        6.375%         Jun-32
E.ON SE                                    500 EUR          0.875%        May-24          innogy Finance B.V.                          600 EUR        5.750%         Feb-33
E.ON SE                                    750 EUR          0.000%        Aug-24          innogy Finance B.V.                          600 GBP        4.750%         Jan-34
innogy Finance B.V.                        750 EUR          1.000%         Apr-25         E.ON International Finance B.V.              900 GBP        5.875%         Oct-37
E.ON SE                                    750 EUR          1.000%         Oct-25         E.ON International Finance B.V.3           1,000 USD        6.650%         Apr-38
innogy Finance B.V.                        500 EUR          1.625%        May-26          E.ON International Finance B.V.              700 GBP        6.750%         Jan-39
E.ON SE                                    750 EUR          0.250%         Oct-26         innogy Finance B.V.                        1,000 GBP        6.125%          Jul-39

innogy also has a €645m, 3.23% coupon, Oct-20 maturity European Investment Bank loan outstanding 1. All bonds ≥€500m equivalent, all bonds are listed in Luxemburg, with
                                                                                                                                                                               66
exception of the unlisted USD bond under 144A/Regulation S 2. The bond was increased from £850m to £975m 3. Bond issued under rule 144A/Regulation S
Funding strategy

    Volumes
                      €2-4bn p.a.         • Bond refinancings
                                          • Cash utilization of asset retirement obligations

     Tenors
                   3-12 years preferred   • Optimize maturity profile & interest costs
                                          • Redemptions on any single day capped at €1bn

  Currencies
                       EUR preferred      • Predominantly Euro-based asset base

                                          • Regular & green bonds

                   Instrument variety
                                          • Private placements & promissory notes
                                            (Schuldscheindarlehen)
 Diversification                          • Commercial paper
                                                                                               67
innogy’s bondholders will be offered to switch to E.ON

 • E.ON is and will be the only active issuer going forward           Step 1 – Issuer Substitution in Q1 2020
 • Rating agencies have attested that the degree of
   structural subordination is not significant
                                                                       innogy SE                 innogy Finance B.V.
                                                                                                + innogy SE guarantee

• innogy’s ratings will be cancelled in 2020 and innogy’s             Step 2 – Offer of Bond Transfer in 2020
  group financial reporting discontinued post squeeze-out1
• E.ON offers to move all innogy bonds to E.ON level and
  standards with ratings and transparent reporting
                                                                   innogy Finance B.V.                  E.ON
• Launch expected post squeeze-out1                               + innogy SE guarantee

1. Merger squeeze-out of the minority shareholders of innogy SE
                                                                                                                        68
E.ON’s Green Bond Framework

                                            Evaluate &                      Management                                                External
       Use of proceeds                                                                                    Reporting
                                                                                                                                 +
                                          select projects                   of proceeds                                              verification
• Finance and/or                   • Project selection based         • E.ON will strive to       • Allocation and impact
  refinance eligible green           on eligibility criteria           maintain a portfolio        reporting after a year
  projects in the following        • Green bond committee:             matching/exceeding        • Renewal on an annual
  eligible categories:                •    Sustainability              outstanding green bonds     basis until full allocation
   •    Renewable energy              •    Energy Networks           • Projects will be added on   of proceeds
   •    Energy efficiency             •    Customer Solutions          an on-going basis
   •    Clean transportation          •    Group Finance

Aligned with the ICMA Green Bond Principles1
Eligible Green Projects are aligned with draft EU taxonomy
1. https://www.icmagroup.org/green-social-and-sustainability-bonds/green-bond-principles-gbp/
                                                                                                                                                    69
PreussenElektra – Further ambition to „beat the provisions“

Solid track-record already until 2019                                                 Nuclear Asset Retirement Obligations1
• Bundling of decommissioning activities                                              € bn
                                                                                                    2016     2017    2018     2019
• Procurement successes by „convoy approach“
• Operational progress according to plan

Further optimization already planned and in execution                                                                          -9
                                                                                                             -10      -10
• Decommissioning preparations starting early
• Operational excellence lifting dismantling performance
  to next level (e.g. by increasing industrialization)

                                                                                                     -21

1. In 2017 implementation of KFK solution (transfer of ~€10bn to German government fund)
                                                                                                                                     70
E.ON’s Q1 2020 Results
               Financial Appendix
Segment outlook 2020 remaining year                                                                                                     E.ON Q1 2020 results

EBIT1 key drivers Q2 – Q4 2020
   Energy Networks                                          Customer Solutions                              Non-Core
      Germany:                                               Germany/UK/Netherlands:                         PreussenElektra:
      •+  Organic RAB growth                                 ––
                                                             •    Weather impact                             •+ Higher hedged prices
      •– Lower volumes                                       •–   Sell-back of volumes (B2B)                 •– Higher depreciation from purchase of
                                                                                                                 production rights
      Sweden:                                                Germany:
      – Lower allowed WACC
      •
                                                             •+ Positive customer development and
                                                                  transaction synergy delivery
      CEE & Turkey:                                          UK:
      + Czech Republic: organic RAB growth
      •                                                      •+ Operational improvements

                                                             Other:
                                                             •+ Growth in decentral energy infrastructure
                                                                  and commodity sales & services Italy

1. Adjusted for non operating effects
                                                                                                                                                           72
Note: Reflection of Covid-19 impact as of 30th April 2020
Financial highlights                                                                                                     E.ON Q1 2020 results

                                              Q1 2019
   €m                                                                  Q1 2020               % YoY
                                             pro forma
  Sales                                                  -               17.665                      -
  EBITDA1                                         2.184                    2.184                     -
  EBIT1                                           1.548                    1.460                   -6
  Adjusted Net Income 1                              752                      691                  -8
  OCFbIT                                                 -                   -400                    -
  Investments                                        678                      918                +35
  Economic Net Debt²                           -39.430                  -40.249                    -2

1. Adjusted for non operating effects; pro forma figures Q1 2019, not audited 2. Economic Net Debt as per 31 Mar
2020 and 31 Dec 2019; Economic Net Debt definition takes into account the decommissioning provisions calculated
with a real discount rate of 0.0% as opposed to IFRS AROs; bonds issued by innogy are recorded at their nominal value:                      73
the amount in the consolidated balance sheets is €2.4 bn higher
Cash conversion in Q1 seasonally low                                                                                                                        E.ON Q1 2020 results

Q1 2020
€ bn

       2.2
                            0.5

                                                -3.0                -0.4                -0.2
                                                                                                             -0.3               -0.9
                                                                                                                                                     -0.9           -1.8
     Group                 Cash           Change in WC           OCFbIT               Interest         Tax payments             OCF                 Capex           FCF
    EBITDA1            adjustments2                                                  payments

1. Adjusted for non operating effects 2. Net non cash effective EBITDA items incl. provision utilizations and payments related to non operating earnings                       74
Divisions: Energy Networks                                                                                                                                                E.ON Q1 2020 results

EBIT1                                                                                              Drivers
€m

CEE & Turkey
                            1,150
                             180
                                                –7%                    1,061                                 Germany                   –•       Weather-related lower volumes

                             143                                        198
        Sweden                                                                    97

      Germany                 827                                        766
                                                                                                             Sweden                    –•       Lower WACC in new regulatory period
                                                                                                                                       –•       Higher transmission fees and grid losses

                         Q1 2019                                     Q1 2020
                         pro forma
 €m                                             Germany                        Sweden                        CEE & Turkey                          Total
                                     Q1 2019                       Q1 2019                        Q1 2019                            Q1 2019
                                                Q1 2020   % YoY                Q1 2020   % YoY                 Q1 2020      % YoY                 Q1 2020   % YoY
                                    pro forma                     pro forma                      pro forma                          pro forma
Revenue                                   -       3.746      -          -         235       -          -           732         -          -         4.713       -
        1
 EBITDA                               1.128       1.093     -3        184         136     -26        263           276        +5      1.575         1.505      -4
 EBIT1                                  827         766     -7        143          97     -32        180           198       +10      1.150         1.061      -8
 thereof equity-method earnings           -          55      -          -           0       -          -            36         -          -            91       -
 OCFbIT                                   -         372      -          -         149       -          -           206         -          -           727       -
Investments                             278         377    +35         56          66     +18         96           132       +37        431           575     +33

1. Adjusted for non operating effects; pro forma figures Q1 2019, not audited                                                                                                                75
Divisions: Customer Solutions                                                                                                                                                E.ON Q1 2020 results

EBIT1                                                                                            Drivers
€m
                                                                                                                      All            –•
                                               –15%
                                                                                                                                              Weather impact on volumes
                             352
                                                                       300
      Germany                234
                                                                       175                                 Germany                   +•       Growing customer numbers
        Benelux
                              52                                        57
            Other             85                                        81
                                                                                                                      UK             +•       Restructuring benefits
               UK
                         Q1 2019                                    Q1 2020
                         pro forma
 €m                                            Germany                       Benelux                          UK                                Other                            Total
                                    Q1 2019                       Q1 2019                       Q1 2019                            Q1 2019                         Q1 2019
                                               Q1 2020   % YoY               Q1 2020   % YoY                Q1 2020     % YoY                  Q1 2020    % YoY                 Q1 2020   % YoY
                                   pro forma                     pro forma                     pro forma                          pro forma                       pro forma
Revenue                                  -       6.151      -           -        947      -           -       4.574           -         -        2.679        -          -       14.351       -
        1
 EBITDA                                263         205    -22          68         74     +9          24          22          -8       127          130       +2        482          431     -11
 EBIT1                                 234         175    -25          52         57    +10         -19         -13         +32        85           81       -5        352          300     -15
 thereof equity-method earnings          -           2      -           -          1      -           -           0           -         -            1        -          -            4       -
 OCFbIT                                  -        -927      -           -       -107      -           -           0           -         -          -43        -          -       -1.077       -
Investments                             30          43    +45           9         11    +18          49          33         -32       111           68      -39        199          155     -22

1. Adjusted for non operating effects; pro forma figures Q1 2019, not audited                                                                                                                     76
Non-Core business
                                                                                                                                                                               E.ON Q1 2020 results

EBIT1                                                                                                            Drivers
€m
                                                   +12%
                                                                                   183
                              164                                                                                                                +•   Higher achieved power prices

                                                                                                                             Preussen            –•   Higher depreciation from purchase of
        Preussen
                              135                                                  155                                         Elektra                production rights
         Elektra
                                                                                                                                                 –•   Transfer of minority stakes2 to RWE
      Generation
         Turkey                   29                                                28
                          Q1 2019                                              Q1 2020                                                           PreussenElektra: Hedged Prices (€/MWh)
                          pro forma                                                                                                              as of 31 March 2020
 €m                                                PreussenElektra                   Generation Turkey                          Total
                                        Q1 2019                               Q1 2019                             Q1 2019                        2019                  100%          33
                                                      Q1 2020        % YoY               Q1 2020         % YoY                 Q1 2020   % YoY
                                       pro forma                             pro forma                           pro forma
Revenue                                      -             386          -           -           0            -         -           386      -    2020                  86%                     46
 EBITDA1                                   184             272        +48          29          28           -3       213           300    +41
      1
 EBIT                                      135             155        +15          29          28           -3       164           183    +12
 thereof equity-method earnings              -              23          -           -          28            -         -            51      -
                                                                                                                                                 2021                  65%                     46
 OCFbIT                                      -              79          -           -           0            -         -            79      -
Investments                                  2             156          -           0           0            -         2           156      -    2022                  34%                     46

1. Adjusted for non operating effects; pro forma figures Q1 2019, not audited 2. NPP Emsland & Gundremmingen C                                                                                  77
Adjusted Net Income                                                                               E.ON Q1 2020 results

                                                         Q1 2019
  €m                                                                            Q1 2020   % YoY
                                                        pro forma
  EBITDA1                                                    2.184                2.184      +0

  Depreciation/amortization                                    -636                -724     -14
         1
  EBIT                                                       1.548                1.460      -6

  Economic interest expense (net)                              -294                -297      -1
        1
  EBT                                                        1.254                1.163      -7
                             1
  Income Taxes on EBT                                          -321                -291      +9
             1
  % of EBT                                                   -26%                 -25%        -
  Non-controlling interests                                    -181                -181      +0
                             1
  Adjusted Net Income                                           752                691       -8

1. Adjusted for non operating effects; pro forma figures Q1 2019, not audited                                        78
Reconciliation of EBIT to IFRS net income                                                   E.ON Q1 2020 results

  €m                                                           Q1 2019   Q1 2020   % YoY
            1
 EBITDA                                                          1.671     2.184     +31
  Depreciation/Amortization/Impairments                           -496      -724     -46
        1
 EBIT                                                            1.175     1.460     +24
  Reclassified businesses of Renewables                           -204        0     +100
  Interest result                                                 -261      -415     -59
  Net book gains                                                   12         5      -58
  Restructuring                                                    -38       -93    -145
  Mark-to-market valuation of derivatives                         -211      -590    -180
  Impairments (net)                                                 0        -17        -
  Other non-operating earnings                                      -9      -254   -2.722
  Income/Loss from continuing operations before income taxes      464        96      -79
  Income taxes                                                    -149      -197     -32
  Income/loss from continuing operations                          315       -101    -132
  Income/loss from discontinued operations, net                   172        -88    -151
  Net income/loss                                                 487       -189    -139

1. Adjusted for non operating effects                                                                          79
Cash effective investments1                                               E.ON Q1 2020 results

                                             Q1 2019
  €m                                                    Q1 2020   % YoY
                                            pro forma
  Energy Networks                                431       575     +33
  Customer Solutions                             199       155      -22
  Corporate Functions & Other                     46        33      -28
  Consolidation                                    0         -1       -
  Non-Core                                         2       156        -
  Investments                                    678       918     +35

1. Pro forma figures Q1 2019, not audited                                                    80
Economic Net Debt1                                                                                             E.ON Q1 2020 results

  €m                                                          31 Dec 2019              31 Mar 2020
  Liquid funds                                                         3.602                     3.629
  Non-current securities                                               2.353                     2.326
  Financial liabilities                                             -29.482                   -30.783
  Adjustment FX hedging²                                                  167                      261
  Net Financial Position                                            -23.360                   -24.567
  Provisions for pensions                                             -7.201                    -6.843
  Asset retirement obligations                                        -8.869                    -8.839
  Economic Net Debt                                                 -39.430                   -40.249

1. Economic Net Debt definition takes into account the decommissioning provisions calculated with a real
discount rate of 0.0% as opposed to IFRS AROs; bonds issued by innogy are recorded at their nominal value:
the amount in the consolidated balance sheets is €2.4 bn higher 2. Net figure; does not include transactions                      81
relating to our operating business or asset management
Economic interest expense (net)2                                                                                        E.ON Q1 2020 results

                                                                               Q1 2019                Difference
  €m                                                                                      Q1 2020
                                                                              pro forma                (in € m)
  Interest from financial assets/liabilities                                      -252       -265           -13
  Interest cost from provisions for pensions and similar provisions                -31        -23            +8
  Accretion of provisions for retirement obligations and similar provisions        -20        -11            +9
  Construction period interests¹                                                     3         3             +0
  Others                                                                             6         -1            -7
  Net interest result                                                             -294       -297            -3

1. Borrowing cost that are directly attributable to the acquisition, construction or production of a qualified asset.
Borrowing cost are interest costs incurred by an entity in connection with the borrowing of funds (interest rate:
3.86%) 2. Pro forma figures Q1 2019, not audited                                                                                           82
E.ON’s Proforma
 Financials 2019
E.ON’s Proforma Financials1 — 2019

Adjusted EBITDA1                                                Adjusted EBIT1

€m                                                   FY 20192   €m                          FY 20192
Energy Networks                                         5,359   Energy Networks                3,582
 Germany                                                3,717    Germany                       2,438
 Sweden                                                   692    Sweden                         539
 CEE & Turkey                                             950    CEE & Turkey                   605
Customer Solutions                                      1,124   Customer Solutions              526
 Benelux                                                  192    Benelux                        125
 Germany                                                  646    Germany                        484
 UK                                                       -10    UK                             -180
 Other                                                    296    Other                           97
Corporate Functions/Other                                -203   Corporate Functions/Other      -340
Non-Core business                                         617   Non-Core business               366
Total                                                   6,897   Total                         4,134
1. Adjusted for non operating effects 2. Pro forma
                                                                                                       84
E.ON’s Proforma Financials1 — 2019

OCFbIT                                                          Investments (cash-effective)

€m                                                   FY 20192   €m                             FY 20192
Energy Networks                                         4,255   Energy Networks                   3,149
 Germany                                                2,455    Germany                          2,254
 Sweden                                                   718    Sweden                            313
 CEE & Turkey                                           1,082    CEE & Turkey                      582
Customer Solutions                                        378   Customer Solutions               1,008
 Benelux                                                   84    Benelux                            90
 Germany                                                  71     Germany                           226
 UK                                                      128     UK                                211
 Other                                                    95     Other                             481
Corporate Functions/Other                               -657    Corporate Functions/Other          130
Non-Core business                                        313    Non-Core business                  148
Total                                                  4,289    Total                            4,435
1. Adjusted for non operating effects 2. Pro forma
                                                                                                          85
E.ON’s Proforma Financials1 — 2019

At-equity contribution to adjusted EBITDA/EBIT1                 E.ON Financials P&L

€m                                                   FY 20192    €m                                                 FY 20192
Energy Networks                                           349   Adjusted EBITDA1                                       6,897
 Germany                                                 219
                                                                Depreciation/amortization recognized in Adjusted
 Sweden                                                    0                                                          -2,763
                                                                EBIT
 CEE & Turkey                                            130
                                                                Adjusted EBIT1                                         4,134
Customer Solutions                                        22
                                                                Economic interest expense (net)                       -1,252
 Benelux                                                   4
 Germany                                                   6    Adjusted EBT1                                          2,882
 UK                                                        0    Income Taxes on Adjusted EBT                            -760
 Other                                                    12    % of Adjusted EBT                                       26%
Corporate Functions/Other                                 70    Non-controlling interest on results of operations       -484
Consolidation                                              -1
                                                                Adjusted Net Income1                                   1,638
Non-Core business                                        125
Total                                                    565
1. Adjusted for non operating effects 2. Pro forma
                                                                                                                               86
Financial calendar & important links
                      Financial calendar
                      May 28, 2020           2020 Annual Shareholders Meeting (online)

                      June 2, 2020           Dividend Payment Day

                      August 12, 2020        Half-Year Financial Report: January – June 2020

                      November 11, 2020      Quarterly Statement: January – September 2020

                      March 24, 2021         Annual Report 2020

                      Important links
                      Presentations          https://www.eon.com/en/investor-relations/presentations.html

                      Facts & Figures 2020   https://www.eon.com/content/.../presentations/facts-and-figures-2020.pdf

                      Annual Reports         https://www.eon.com/en/investor-relations/financial-publications/annual-report.html

                      Interim Reports        https://www.eon.com/en/investor-relations/financial-publications/interim-report.html

                      Shareholder Meeting    https://www.eon.com/en/investor-relations/shareholders-meeting.html

                      Green Bond Framework   https://www.eon.com/en/investor-relations/bonds/green-bonds.html

                                                                                                                                    87
E.ON Group Investor Relations Contacts
Analysts & Institutional Investors                                           Private Shareholders
           Verena Nicolaus-Kronenberg           Martin Jäger                                 Sandra Schuck
           Head of Investor Relations           Manager Investor Relations                   Manager Investor Relations
           verena.nicolaus-kronenberg@eon.com   martin.jaeger@eon.com                        sandra.schuck@eon.com
           +49 152 09331400                     +49 162 2754355                              +49 172 2982483

           Martina Burger                       Max Sadrina                  Event & Roadshow Management
           Manager Investor Relations           Manager Investor Relations
           martina.burger@eon.com               max.sadrina@eon.com          Lydia Beck
           +49 151 19773784                     +49 152 59602298             Assistant Investor Relations
                                                                             lydia.beck@eon.com
                                                                             +49 152 54310267
           Sebastian Gaßner                     Andreas Thielen
           Manager Investor Relations           Manager Investor Relations   Vanessa Brinkmann
           sebastian.gassner@eon.com            andreas.thielen@eon.com      Assistant Investor Relations
           +49 171 3003753                      +49 151 67114918             vanessa.brinkmann@eon.com
                                                                             +49 152 09340725

           Tobias Harburg                       Britta Wöhner                Carmen Mombour
           Manager Investor Relations           Manager Investor Relations   Assistant Investor Relations
           tobias.harburg@eon.com               britta.woehner@eon.com       carmen.mombour@eon.com
           +49 162 2969560                      +49 152 54607527             +49 151 16310345

                                                                             General Contact:
                                                                             +49 201 184 2806
                                                                             investorrelations@eon.com
                                                                                                                          88
Disclaimer

This presentation contains information relating to E.ON Group ("E.ON") that must not be relied upon for any purpose and may not be redistributed, reproduced,
published, or passed on to any other person or used in whole or in part for any other purpose. By accessing this document you agree to abide by the limitations set out
in this document as well as any limitations set out on the webpage of E.ON SE on which this presentation has been made available.
This document is being presented solely for informational purposes. It should not be treated as giving investment advice, nor is it intended to provide the basis for any
evaluation or any securities and should not be considered as a recommendation that any person should purchase, hold or dispose of any shares or other securities.
The information contained in this presentation may comprise financial and similar information which is neither audited nor reviewed and should be considered
preliminary and subject to change.
Some of the information presented herein is based on statements by third parties. No representation or warranty, express or implied, is made as to, and no reliance
should be placed on, the fairness, accuracy, completeness or correctness of this information or any other information or opinions contained herein, for any purpose
whatsoever.
This presentation may contain forward-looking statements based on current assumptions and forecasts made by E.ON management and other information currently
available to E.ON. Various known and unknown risks, uncertainties and other factors could lead to material differences between the actual future results, financial
situation, development or performance of the company and the estimates given here. E.ON does not intend, and does not assume any liability whatsoever, to update
these forward-looking statements or to conform them to future events or developments.
Neither E.ON nor any respective agents of E.ON undertake any obligation to provide the recipient with access to any additional information or to update this
presentation or any information or to correct any inaccuracies in any such information.
Certain numerical data, financial information and market data (including percentages) in this presentation have been rounded according to established commercial
standards. As a result, the aggregate amounts (sum totals or interim totals or differences or if numbers are put in relation) in this presentation may not correspond in all
cases to the amounts contained in the underlying (unrounded) figures appearing in the consolidated financial statements. Furthermore, in tables and charts, these
rounded figures may not add up exactly to the totals contained in the respective tables and charts.
                                                                                                                                                                               89
You can also read