Capital Markets Story - October 2020

Page created by Bradley Gonzalez
 
CONTINUE READING
Capital Markets Story - October 2020
Capital Markets Story
               October 2020
Capital Markets Story - October 2020
Table of contents

1   H1 2020 Update ………………..……………..……………………………………………………… 4

2   CMD: Strategic Update ….…….……………….…..…………………………………………… 16

3   CMD: Financial Update ..………………...……………………………………………………… 39

4   Appendix …………………………..……………..………………………………………………………… 54
Capital Markets Story - October 2020
H1 2020 Update
Capital Markets Story - October 2020
High visibility despite Covid-19, mid-term targets                                              E.ON H1 2020 results

confirmed

✓ 2020 EBIT guidance updated to €3.6 – 3.8bn reflecting
  largely recoverable expected Covid-19 effects until year end1

✓ Strong operational performance in H1 2020                                     Dividend
      despite adverse weather conditions                                        growth

                                                                           Customer centric
✓ Mid-term targets confirmed and investment                                     energy
      proposition further underpinned                                       infrastructure

✓ Dividend guidance confirmed                                  Sustainability              Performance

1. Assuming no further severe lockdowns in our major markets
                                                                                                                   4
Capital Markets Story - October 2020
European recovery program and Green Deal will boost                                            E.ON H1 2020 results

our growth potential
Maximum grants for each member        Additional investment               Hydrogen as strategic long-term
state under EU Recovery and           opportunities to foster growth in   growth pillar
Resilience Facility                   energy infrastructure

      Italy                   63.4
                                          €500m                             €9bn public funds for
   Poland         26.8                    additional                        German hydrogen ramp up
 Germany        21.5
                                          investments
                                                                            50 projects in E.ON‘s H      2
  Romania     13.5                                                          project pipeline
                                          (3-5%)
Other E.ON
                                          4-5%                              Being active in multiple parts
                       38.6    € bn
 Markets
                                                                            of H2 value chain offers
                                          power RAB CAGR
E.ON markets total:   >€160bn             until 2022
                                                                            large opportunities
                                                                                                                  5
Capital Markets Story - October 2020
Further milestones of innogy integration delivered                                                                                                       E.ON H1 2020 results

No Covid-19 impact on net synergy1 targets                                                     Delivering on transaction and integration
€m
                                                   ~740            ~780
                                                                                               ✓ Squeeze-out completed
                                   ~310
                                                                                               ✓ Closing 2 completed
                    ~125
     40 ✓                                                                                      ✓ All remedies successfully executed or signed
                                                                                               ✓
    2019            2020            2021            2022            2024                             achieving higher proceeds than planned

✓ First wave of voluntary leave program
  successfully completed

✓ Further waves to start end 2020/2021
✓

1. Net accretive to EBIT, EBIT adjusted for non operating effects and before implementation costs (implementation costs not included in adjusted EBIT)                      6
Capital Markets Story - October 2020
Digitalization at E.ON as core value driver                                                               E.ON H1 2020 results

Energy Networks                                  Customer Solutions
Cooperation with SAP                             Germany: Substantial ramp up of contracts to digital platform
                                                                                                             All German
• E.ON and SAP plan new cloud based                 million contracts
                                                                                                         contracts migrated1
    technology platform
                                                                                                  ~4
• New industry standard for network operations                           ~1

• Significant reduction in network IT cost by        Mar 20             Jun 20    Sep 20        Dec 20         Dec 22
  process re-design and digitization
                                                 UK: npower customer migration started in July 2020 as scheduled
                                                    million contracts                                       All E.ON UK
                                                                                                         contracts migrated
                                                                                               All npower
                                                                                           contracts migrated
                                                       > 0.1            > 0.4      > 0.8

1. E.ON and innogy core brand                         Aug 20             Oct 20   Dec 20         Q2 21          H2 22          7
Capital Markets Story - October 2020
Guidance 2020 update for Covid-19 impact in line with                                                                                       E.ON H1 2020 results

Q1 communication, now providing visibility until year end
EBIT1,2                                                                                         Key takeaways:
€m 4,100                                      4,100
        –
      3,900
                                                –
                                              3,900
                                                                Volumes,
                                                                recoverable
                                                                                                •      Covid-19 impact materialized as indicated
                                                                                   3,800
                                  100       “lower end”
                                                                                     –
                                                                         ~150      3,600        ••     Effects now specified versus Q1 guidance largely
                                                                         ~50       3,700
                    Sell-backs: “high
                    double-digit million“
                                                                                                       recoverable
                                                                Bad debt &
                    Bad debt: “low
                                                                Volumes
                    double-digit million“
                                                                                                •      No additional unexpected impact
                                                                                                       on Customer Solutions

                                                                                                ••     Updated guidance now covers Covid-19 impact
                                                                                                       for the remainder of the year2
  Guidance as of      Covid included        Guidance as      Further Covid-19      Updated
   March 2020         in Q1 guidance        of May 2020       impact until YE   guidance 2020

              Covid-19 Energy Networks           Covid-19 Customer Solutions

1. Adjusted for non-operational effects 2. Assuming no further severe lockdowns in our major markets                                                           8
Capital Markets Story - October 2020
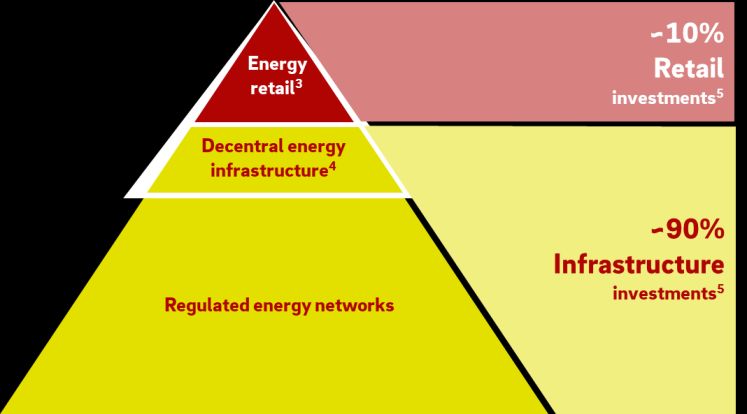
No further significant Covid-19 impact expected                                                                                      E.ON H1 2020 results

until year end
Energy Networks: Power demand down since                                         Customer Solutions: Key metrics for payment
Covid-19 breakout                                                                behavior as of 31st July
110%                     Germany relative to 20191                                            Government             Change of          Day of
100%                                                                                          intervention        payment behavior      sales
 90%                                                              ∕
                                                                  ○-~10%            GER
 80%                                                                                UK
 70%                                                                                NL
 60%
       March         April            May            June
                                                                                     unchanged/low           slight change/medium    worsened/high

Q1 assumptions re-confirmed:
                                                                                 • Payment behavior: No major change across E.ON markets
• H1 2020: Volumes down by ~10%: ~€100m impact
                                                                                 • Working capital increase due to Covid-19 ~€100 million only,
• FY 2020: Gradual recovery would add additional ~€50m                             due to active receivables management
   impact for remainder of the year
                                                                                 • Bad debt: Covid-19 related total Group bad debt provision low to
• Volume related effects recoverable in 2022 –               20242                  mid double-digit million Euro level at the end of Q2 2020
1. Source: entso-e 2. Period for recovery of lower revenues in 2020 in Germany                                                                          9
Strong EBIT development despite Covid-19 impact and                                                                                            E.ON H1 2020 results

mild weather
EBIT1 H1 2020 vs. H1 2019 pro forma                                                                          Key drivers
€m
        H1 2019                                                                                              –•   Covid-19-related lower volumes
                                                                2,323
       pro forma                                                                                 Energy
                                                                                                             –•   Germany: weather-related lower volumes
                                                                              ~-100            Networks
         Energy
                                           -251                          Covid-19 impact                     –•   Sweden: lower WACC in new regulatory
       Networks                                                             (volumes)                             period

       Customer                                                                ~-100
       Solutions
                                                   +14                    Covid-19 impact                    –•   Covid-19: sell-back of volumes (B2B) &
                                                                        (sell-backs, volumes                      bad debt
                                                                             & bad debt)       Customer
Corp. Functions
                                                        +80                                    Solutions     –•   Weather impact on volumes
 & Other, Cons.
                                                                                                             +•   UK: restructuring benefits

       Non-Core                                    -4
                                                                                                           +/–•   PreussenElektra: higher achieved prices,

        H1 2020                      2,162              2,162    ~€2.4bn (excl. Covid-19)      Non-Core           higher depreciation from purchase of
                                                                                                                  production rights
                                                                                                             –•   Turkey Generation: one-off effect in
                                                                                                                  H1 2020
1. Adjusted for non operating effects; pro forma figures H1 2019, not audited                                                                                     10
Adjusted Net Income in line with EBIT development                                                E.ON H1 2020 results

H1 2020
€m
 Group EBIT1                                                      2,162

    Economic
                                                         -559
interest result

        Profit
                                                      1,603
before Taxes1

Income taxes                                   -401                         Tax rate at   ~25%
    Minorities                          -269

                                                              0.36 EPS (€ per share)
    Adjusted
                                        933
 Net Income1

1. Adjusted for non operating effects                                                                             11
Temporary Economic Net Debt (END) increase largely due                                                                                                     E.ON H1 2020 results

to squeeze-out and timing effects
 € bn
     -8.9                                                                                                                                                            -8.8

     -7.2                                                                                                                                                            -8.0
                                                                            Asset Retirement Obligations (ARO)
                                                                            Pension provisions
                                                                            Net financial position

    -23.4
                                                                                                                                                                    -26.2

                                                                                      -1.7           +1.1            -1.5
                                    -38.9            +1.2                                                                           -0.8
    -39.4            +0.5                                            -1.6

                                                                                                                                                    -0.9            -43.1
     END         Transaction         END            OCF             Net           Transaction Transfer of         Dividend       Pensions5         Other            END
   FY 2019       adjustment1       FY 2019        H1 20202      Investments         effects4  Nord Stream1                                      (incl. AROs)       H1 2020
                                   adjusted                      H1 20203                       into CTA

1. Adjustment of the underlying interest rate for selected leases 2. Excl. transactional effects 3. Net of divestments 4. Transaction effects include merger squeeze-out,    12
locked-box and sale of German heating customer business 5. Actuarial interest rates for German pensions at 1.2% (vs. 1.3% @ FY 2019), for UK pensions at 1.6% (vs. 2.0% @
FY 2019)
Rating target re-confirmed, positive END effects above                                                                                                       E.ON H1 2020 results

initial expectations
Leverage factor1                                                                         Selected END effects 2020-20223
                                                                                         • 95% Cash conversion rate4
Strong      BBB/Baa rating target                                                      ↑•      Working Capital optimization program &
                                                                                               ARO5 reduction ~+€1.5bn (before: ~+€1bn)
              5.6x                                                                             (ARO reduction: ~€200m already achieved 2019)

                                                                                         • Nord Stream 1 transfer to pension fund executed ~+€1bn

                                              ~5x
                                                                                         • Transaction effects +/-€0bn (before: -€0.5bn)
                                                                                               Remedies, merger squeeze-out, locked box, restructuring Hungary

                                                                                         • Integration costs up to ~-€1bn

             2019                             2022
           pro forma2
1. Economic Net Debt/EBITDA, EBITDA adjusted for non-operating effects 2. Reflecting transaction adjustment (END FY 2019 reduced by ~€0.5bn) 3. Negative effect                 13
indicates increase of Economic Net Debt and vice versa 4. Excluding provision utilization for nuclear decommissioning, average for 2020-2022 5. Asset Retirement Obligations
Updated Group outlook 2020                                                                                                                                    E.ON H1 2020 results

Group Guidance
EBITDA1: €6.8-7.0bn                                EBIT1: €3.6-3.8bn                                 ANI1: €1.5-1.7bn                           Capex2: ~€4.2bn
                  (€7.1-7.3 bn)                                 (€3.9-4.1bn)                                    (€1.7-1.9bn)                                   (~€4.5bn)

Segment Guidance1
Energy Networks                                                         Customer Solutions                                                    Non-Core
EBITDA: €5.0-5.2bn (€5.2-5.4bn)                                          EBITDA: €1.0-1.2bn            ✓                                      EBITDA: €0.8-1.0bn             ✓
   EBIT: €3.1-3.3bn (€3.3-3.5bn)                                            EBIT: €0.4-0.6bn           ✓                                         EBIT: €0.3-0.5bn            ✓
 Capex: ~€3.4bn                                                           Capex: ~€0.8bn               ✓

1. Adjusted for non operating effects, assuming no further severe lockdowns in our major markets 2. Includes transaction related effects; cash effective capex outlook           14
excluding transaction related effects amounts to ~€4.6bn
Guidance overview                                                                                                                                           E.ON H1 2020 results

                                                                                                                                                  Change in guidance vs. Q1

 € bn                                                                                    2019 pro forma3                                20204                     2020-20224
 EBITDA1                                                                                             6.904                           6.8-7.0                      5-6% CAGR
           Energy Networks                                                                           5.364                            5.0-5.2
           Customer Solutions                                                                        1.126                            1.0-1.2
           Non-Core                                                                                  0.617                            0.8-1.0
           Corporate Functions & Other                                                              -0.203                              ~-0.3
 EBIT1                                                                                               4.065                           3.6-3.8                  11-13% CAGR
           Energy Networks                                                                           3.499                            3.1-3.3
           Customer Solutions                                                                        0.541                            0.4-0.6
           Non-Core                                                                                  0.366                            0.3-0.5
           Corporate Functions & Other                                                              -0.341                              ~-0.4
 ANI1                                                                                                1.573                          1.5-1.7                   17-22% CAGR
 EPS1                                                                                                €0.60                     €0.58-0.65                     17-22% CAGR
 Dividend                                                                                            €0.46                    up to 5% p.a.                    up to 5% p.a.
 Capex2                                                                                              4.435                            ~4.25                            ~13
           Energy Networks                                                                            3.149                               ~3.4                            ~9.7
           Customer Solutions                                                                         1.008                               ~0.8                            ~2.7
 Leverage                                                                                              5.6x                                                                ~5x
1. Adjusted for non operating effects 2. Cash effective investments 3. Pro forma figures FY 2019, not audited, reflecting transaction adjustment 4. Assuming no further
                                                                                                                                                                                 15
severe lockdowns in our major markets 5. Includes transaction related effects; capex outlook excluding transaction related effects amounts to ~€4.6bn
Strategic Update
Why invest in E.ON?

                                             1   We commit to a sustainable dividend per share
                                                 growth of up to 5% annually until 2022 and further
                                                 growth beyond

                    Dividend
                    growth
                                             2   We are the green investment opportunity and we
                                                 enable the energy transition

              Customer centric
                   energy
               infrastructure                3   We focus on customer centric energy infrastructure
                                                 which is the core of our resilient portfolio

   Sustainability              Performance
                                             4   Performance culture is part of our DNA and we
                                                 continuously deliver on operational excellence
                                                                                                      17
Why invest in E.ON?

                                       Dividend
                                       growth

                                   Customer centric
                                        energy
                                    infrastructure

                      Sustainability              Performance

                                                                18
Net zero is the new normal – E.ON is driving carbon reduction

Global challenges                                                           E.ON’s contribution                                                     Focus SDGs5

 IPCC1 long term goal to limit global                                         Avoided emissions together with our clients

 warming to        1.5°C                                                      2019:     >100m tons CO2
 German greenhouse gas emissions to be cut
                                                                              One out of five renewable
 by 55% by 2030
               2
                                                                              assets in Europe3 connected to E.ON’s grids

 Green Deal: The EU will be climate neutral                                   E.ON will become carbon neutral4

 by   2050                                                                    by   2040
1. Intergovernmental Panel on Climate Change 2. Pre Green Deal 3. Considering EU27 4. Carbon neutrality by 2040 (Scope 1 and 2), 75% carbon reduction by 2030         19
(Scope 1 and 2), 50% reduction of Scope 3 emissions by 2030, carbon neutrality by 2050 (including Scope 3). Base year: 2019 pro forma 5. UN Sustainable Development
Goals
Decarbonization means deep electrification

European1 energy demand 2015 vs. 2050…                                              … with huge impact on energy infrastructure
TWh
                                                                                      Increase of electricity demand (+90%)
         ~12,500                                                                      • Deep electrification of different sectors and
                           -40%                    ~7,000
                                                                                        decentral generation creates the need for
                                                                                        substantial grid investments
                                                                                      • Substitution of fossil fuel consumption through
                                                                                        green electricity

                           +90%
                                                    ~67%                              Reduction of total energy demand (-40%)
            ~20%
             2015                                    2050                             • Major decarbonization goals provide business
                                                                                        opportunities for energy efficiency products and
                                                                                        services
    Power       Other
1. Considering EU27, Source: https://www.eea.europa.eu/data-and-maps/figures/primary-and-final-energy-consumption (energy demand)/ http://inrestruct.com/wp-   20
content/uploads/2015/04/Practical-guide-to-a-low-carbon-Europe-2050.pdf (power demand)
Decentralization means digitalization and efficiency potential

The complexity within DSOs is increasing ...
Decentralization drives system complexity                                                               E.ON provides digital solutions to capitalize on it
                                       Energy Management System
                                                                        Regional Energy Market
                                                                                                        EnergieMonitor & Klima-Navi
    Customer                                   Smart Home                                               Transparency about CO2-footprint and
     interface        Storage
                                                                                        CO2 Footprint
                                                                                                        impact of energy transition to
                                                                                        App
   (data usage)
                                                                                                        municipalities and customers
                                Asset Control Systems      Local Energy System

                                         Predictive
                                         Maintenance
                                                                          System
                                                                          Flexibility
                                                                                                        Predictive Maintenance
    Network
    operation                                           Data, AI                        Control         Data-driven decisions with
                                                                                        Center
(data distribution)                                                                                     machine learning
                                         Asset                           Automated Grid
                                         Monitoring                      Planning

                          Generation                    Network                 Buildings               Grid Smartification
     Physical                                                                                           Intelligent substation collects real-time
       assets
 (data generation)                         E-mobility                                                   data from our networks to enhance grid
                                                            Broadband                                   management
                                                                                                                                                              21
Why invest in E.ON?

                                       Dividend
                                       growth

                                   Customer centric
                                        energy
                                    infrastructure

                      Sustainability              Performance

                                                                22
E.ON transformed into Europe’s energy infrastructure powerhouse

E.ON’s strategy implementation accelerated by innogy takeover

 Long-term                    2x                          2x                   ~80%                 Integration              ~€740m
 energy infrastructure        Regulated Asset     Base1   customer accounts    regulated earnings   bundling of synergies    delivery of annual net
 substitutes increasingly                                                      with benefits for    for the benefit of our   synergies by 2022
 merchant renewable                                                            credit   rating2     customers
 assets

1. German RAB 2. Based on 2020 EBIT, EBIT adjusted for non operating effects                                                                          23
Infrastructure is at the heart of E.ON’s capital allocation

                                                                                                                                                              ~10%
                                                                                   Energy                                                                     Retail
  Customer Solutions1                                                              retail2                                                                investments4
                                                                          Decentral energy
                                                                           infrastructure3

                                                                                                                                                       ~90%
                                                                                                                                               Infrastructure
  Energy Networks1                                                  Regulated energy networks                                                             investments4

1. IFRS segments used in external reporting 2. Includes Energy Sales and Services and New Solutions 3. Includes City Energy Solutions and B2B Solutions                  24
4. Excludes investments in Corporate Functions & Other and Non-Core
Energy transition driving multi-decade investment
opportunities
Industry investments in German power distribution networks excluding Green Deal upside
€ bn

          Drivers

                                                                                                        6.7
                                                               4.7
                      2.5

                      2010
                      2009                                     2020                                    2030                   2050
Source: Historic values: Bundesnetzagentur Monitoringbericht 2019. Future outlook: dena-Leitstudie Integrierte Energiewende          25
1. Assuming 2% inflation beyond 2020
E.ON is the leading energy network company in
Northern and Central Europe
E.ON Regulated Asset Base (RAB) – regional split
€ bn

     Total RAB1, 2

    33.2                               Sweden                                          Germany                                      CEE2 &Turkey2

    Power RAB           Gas RAB

                                       3.8                                             21.9                                                 7.6

1. RAB is the value of all distribution assets determined by the regulator. In general, RABs from different regulatory regimes are not directly comparable due to significant
                                                                                                                                                                                  26
methodical differences. These include for example different regulatory asset lifetimes, asset valuation methods or treatment of customer contributions for network connections.
Central Eastern Europe including: Czech Republic, Hungary, Poland, Romania, Slovakia 2. 100% view for Slovakia and Turkey
Long-term RAB growth with further upside potential

E.ON Regulated Asset Base1 growth
€ bn
                                                                                                                       Power
                         33.2                  4-5%                                                            • Multi-decade growth potential
                                                  CAGR2                                                          stemming from mega-trends

                                                                                                                       Gas
    Power                27.7
                                                                                                               • Optimizing our existing gas asset
                                                                                                                 base with limited investment needs
                                                                                                               • Future growth option from hydrogen
        Gas               5.5
                          2019                                                2022                                                         Beyond

1. RAB is the value of all distribution assets determined by the regulator. In general, RABs from different regulatory regimes are not directly comparable due to significant
                                                                                                                                                                                27
methodical differences. These include for example different regulatory asset lifetimes, asset valuation methods or treatment of customer contributions for network
connections, including 100% view for Turkey and Slovakia. Constant year-end 2019 FX-rates 2. Relates to power RAB
Gas distribution with stable earnings and limited capex

Gas activities closely coupled with power business                              Limited capex spent on gas

 ~90% of German gas network business is                                                         ~5% of Group capex is spent
                                                                                                                          1

 linked to electricity concessions                                                              on our gas business

The role of gas in German heating market2                                       Future potential for industry and transport

             37%                       37%
                                                             Other
      14%

             50%
                                       26%                   District heating
                                                             Gas
                                                                                    H2
                                       37%

     Existing connections           New-builds
1. Cash effective investments, average for 2020-2022 2. Source: BDEW 2020
                                                                                                                              28
Four years of regulatory stability

Regulatory periods per country
                       2020             2021             2022             2023             2024            2025              2026    2027      2028

 Germany (Gas)
Slovakia1
         Turkey
  Poland
Czech Republic1
        Hungary
       Romania

                                                                                                           70%2 of the Energy Networks
       Germany
        (Power)

                                                                                                           EBIT is highly visible until 2024

        Sweden

1. Length of upcoming regulatory period still under discussion 2. Based on 2019 pro forma EBIT, adjusted for non operating effects
                                                                                                                                                      29
Exemplary earnings components beyond allowed return

                           Opex efficiencies         Regulatory cost
                             Actual opex vs.
                              allowed opex
                                                       recognition                  Total
   Allowed      RAB
               growth
                                                                             =   regulated
   return
                          Capex efficiencies
                        Outperformance of standard
                                                     Special incentives
                                                      E.g. reliability and
                                                                                  earnings
                          prices set by regulator      network losses

    Allowed return       Additional earnings components in our markets

                                                                                             30
Leveraging strong partnerships and core competencies to
drive additional businesses
Long-term partnerships with municipalities …       … create a competitive edge for additional businesses

                                                     Technical grid services              Smart meters
   Non-concession-                   Concession-
   based RAB                          based RAB
                                                           e.g. O&M                      e.g. installation
   ~1/3                                    ~2/3
                            RAB
                                                           Broadband                Water and waste-water
                          €21.9bn1
                                                       e.g. new customer               e.g. supply and
                                                          connections                     operations

                      >9,000                       … including other areas benefitting from our partnerships

                concessions in Germany                           City Energy Solutions (CES)
                                                            Local heating and cooling solutions for
                                                            municipalities, districts and single sites

1. German power and gas RAB
                                                                                                               31
Earnings growth from reducing carbon emissions via
decentral energy infrastructure
Low temperature heating                                                        Large B2B solutions/district
and cooling grids                                                              heating grids

                                                                                                                                          Top 2
E.g. ectogrid: zero emission                                                   On-site generation solutions
energy hybrid system with up                                                   Average contract duration: 15-40 years
to 20% cost savings
                                                                                                                                          market position in
                                                                                                                                          Sweden and Germany1

                                                                                                                                          ~25%
City quarter solutions
Integrated energy concepts
                                                                            Single/multi-site solutions
                                                                            Decentralized sustainable local energy
                                                                                                                                          CAGR
                                                                                                                                          EBIT 2020-20222
e.g. Werksviertel Munich
                                                                            solutions (e.g. PV at Audi in Győr, Hungary)
Average contract duration: 20-40 years
1. City Energy Solutions, based on heating volumes sold 2. City Energy Solutions and B2B Solutions, EBIT adjusted for non operating effects
                                                                                                                                                                32
Customer numbers B2B & B2C

Stable customer base (m)1                                                                 Thereof: electricity customers (m)1
Customer accounts                                                                                                          -0.2%
                                +0.0%                                                                     41.2                                41.1
               52.2                                52.2                                                   11.6                                11.6
                                                                                                           6.6                                6.5
                                                                                                   2.6                                                2.5
               13.9                                13.8                                                   10.5                                10.5
                                                                                                           9.8                                9.9
               10.9                                10.7                                                  FY 2019                           H1 2020

                4.6                                 4.6                                   Thereof: gas customers (m)1
                                                                                                          11.0             +0.9%             11.1
               13.0                                13.1                                                    2.3                                2.3
                                                                                                           4.2                                4.2
                9.8                                 9.9                                            2.0                                                2.1
                                                                                                           2.5                                2.6
             FY 2019                            H1 2020
                                                                                                         FY 2019                           H1 2020
      Germany 2         UK3         Benelux4         Other         Turkey

1. Including at-equity participations; Customer Solutions business of Croatia and Slovenia allocated to Energy Networks due to size 2. 2019 adjusted due to the disposal of   33
substantial parts of the heating customer business 3. To standardize reporting, the definition of customers was adjusted 4. 2019 adjusted for the acquisition of the Dutch
energy utility VandeBron.
Why invest in E.ON?

                                       Dividend
                                       growth

                                   Customer centric
                                        energy
                                    infrastructure

                      Sustainability              Performance

                                                                34
Performance culture is part of our DNA

Transaction related synergies                             npower & E.ON customers migrated          Operational excellence
                                                          onto new platform E.ONnext
✓ Synergy delivery on track                               EBIT1 development                               Continuous improvement
                                                          GBP m
                                                                          ~100m

✓ 5% achieved in 2019
                                                                                                          Digitalization & innovation
                                                            2019              2022   2023   >2023

✓ Measures validated and                                    Earnings improvement: Combined
  delivery de-risked                                         EBIT1 of at least GBP100m in 2022            Regulatory outperformance
                                                             and improvement beyond

✓ €740m confirmed target                                    Free cash flow will be                       Customer satisfaction
    by 2022                                                  positive2 from 2023 onwards
                                               Top priorities                                            Performance culture
1. Adjusted for non operating effects 2. After smart meter investments
                                                                                                                                        35
Synergy delivery fully on track

Estimated transaction related net synergies1 of ~€740m                                                                     Synergy delivery by division

                                                                                                       ~100%
                                                                                                                                                                  27%
                                                                         ~45%
                                                                                                                                   53%
                                          ~20%
             5% ✓                                                                                                                                                20%

            2019                           2020                           2021                          2022

                                 1. Start of voluntary           1. Full integration of          1. Synergies in Energy                     Customer Solutions
                                    leave program                   headquarter                     Networks
                                                                                                                                            Energy Networks
                                 2. External budget cut          2. Organizational               2. Integration of
                                 3. Optimization of IT              integration of                  customer portfolios                     Central Functions, IT and Other
                                    services                        Customer Solutions           3. Consolidation of IT
                                                                    businesses                      landscape

1. Net accretive to EBIT, EBIT adjusted for non operating effects and before implementation costs (implementation costs not included in adjusted EBIT)
                                                                                                                                                                              36
Renewal of IT architecture to drive operational excellence
in Customer Solutions
Germany: Digital Attacker                                                           UK: Migration to new platform ensures higher profitability

Continuous ramp up of contracts to new                                               Step 1                                      Step 2
platform (schematic)                                                                 Migration of npower’s B2C and               Migration of E.ON’s B2C and
                                                                                     SME customers onto E.ONnext                 SME customers onto E.ONnext
15m

10m

  5m
                                                                                     • Combined EBIT of at least GBP100m in 2022
              2020                                 2025                              • Compared to previous plan: EBIT improvement 2023
                                                                                       by more than GBP50m and more than GBP100m
• Already today at competitive Cost-to-Serve level                                     beyond 20231
• Ambition: reduction to market leading level at                                     • Free cash flow positive from 2023 onwards2
  low teens (€/customer)
                                                                                     • Total restructuring charges3 remain at up to GBP500m
1. Compared to business plan announced in November 2019 2. After smart meter investments 3. Majority to be shown in non operating result
                                                                                                                                                               37
E.ON’s performance culture adds sustainable
value to businesses and customers
German power network efficiency scores                                     Sweden power network efficiency scores

      >€600m additional revenues                                            100%
      in regulatory period1                                                                           E.ON grids

          100%
                                                                                     Very efficient
                                                                             85%
                                   95%
                                              Industry average 94%

                                                                                     Efficient
                                                                             70%
     8/9 E.ON grids          1/9 E.ON grids

8/9 E.ON networks obtain a 100% efficiency score,                          All E.ON grids considered very efficient, with 2/3
with 3 obtaining a super efficiency bonus                                  being 100% efficient

1. Based on ~€4bn allowed power cost base relevant for efficiency factor
                                                                                                                                38
Financial Update
We commit to annually grow the dividend per share by up to 5%

Dividend per share (DPS)

                               €0.43       €0.46

                   €0.30
      €0.21

                                                                            Growth beyond
      2016
              ✓     2017
                           ✓   2018
                                       ✓   2019
                                                   ✓   2020   2021   2022

                                                                                            40
E.ON’s 2020-2022 delivery plan confirmed

                  Dividend per share (DPS) growth up to 5% p.a.

                     EBIT1 growth
                  Group                                                                          EPS1 growth
                                                                                              Group

                  11-13% (before: 7-9%) CAGR                                                  17-22% (before: 10-15%) CAGR

                       cash conversion
                  Average                                                                                      strong
                                                                                                     Capital structure with

                  rate2of 95%                                                                        BBB/Baa rating
1. Adjusted for non operating effects; CAGR’s technically adjusted to new 2020 guidance, recovery of Covid-19 effects not yet reflected 2. Excluding provision utilization for   41
nuclear decommissioning, average for 2020-2022
Strict capital allocation framework leads to sound
investment profile
Sustainability focus                                    Return framework                                 Capital allocation in line with business priorities

Sustainability criteria:                                  Hurdle rate composition:                       Indicative hurdle rates2:

✓    Enable energy transition                                     WACC
                                                      (country & technology specific)
     Supporting SDGs1
                                                                                                                       6-11%
✓
✓    Reduce customers‘ emissions                        Project specific risk premium                              4-9%
     Human rights violations
                                                     E.ON Group excess return target
                                                                                                          3-8%
     Carbon heavy generation

     Environmental degradation                                    Hurdle rate

1. UN Sustainable Development Goals 2. Illustrative hurdle rate ranges; post tax. Final hurdle is risk adjusted for each project and might vary 3. Includes New Solutions and
                                                                                                                                                                                42
Commodity Sales and Services 4. Includes City Energy Solutions and B2B Solutions 5. Excludes investments in Corporate Functions & Other and Non-Core
E.ON allocates ~75% of investments to Energy Networks

Investments 2020                                                                        Investments 2020-2022
€ bn                                                                                    € bn

                                                       ~90%2                                                                                           ~90%2
                                                       infrastructure                                                                                  infrastructure
                        ~4.21                                                                                       ~131

                                                     Energy Networks           Customer Solutions          Other3

1. Cash effective investments including Corporate Functions & Other and Non-Core, assuming no further severe lockdowns in our major markets, includes transaction related
                                                                                                                                                                            43
effects; Capex outlook excluding transaction related effects amounts to ~€4.6bn for 2020 2. Based on investments in Energy Networks and Customer Solutions 3. Corporate
Functions & Other and Non-Core
Investments with strong focus on infrastructure

Energy Networks 2020-2022                                                                  Customer Solutions 2020-2022
€ bn                                                                                       € bn

                                                           100%                                                                   ~65%
                      ~9.71                                infrastructure
                                                                                                            ~2.71                 infrastructure

                                                                                                   B2B Solutions             IT driven retail investments
                                                                                                   City Energy Solutions     New Solutions
                  Power          Gas        Other                                                  UK smart meter roll-out   E-mobility
1. Cash effective investments, assuming no further severe lockdowns in our major markets
                                                                                                                                                            44
Attractive Group earnings growth

EBITDA1                                                       EBIT1                                             Outlook1
€ bn                                                          € bn                                              CAGR

       0.6
               6.9
                1.1
                          6.8-7.0

                                                                              4.1
                                                                                                                      5-6%
                                                                                         3.6-3.8                               EBITDA
                                                                      0.4

                                                                                                            11-13%
                                                                      0.5

                5.4
                                                                               3.5
                                                                                                                                   EBIT
               2019          2020                                             2019          2020                           2020-2022
             pro forma                                                      pro forma

Guidance:          Energy Networks          Customer Solutions         Corporate Functions & Other   Non-Core
1. Adjusted for non operating effects; assuming no further severe lockdowns in our major markets
                                                                                                                                          45
Mid-term growth in Energy Networks earnings backed by
organic RAB growth
EBITDA1                                                       EBIT1                                Outlook1
€ bn                                                          € bn
              5.4
                          5.0-5.2
               1.0                                                           3.5
               0.7
                                                                                         3.1-3.3
                                                                              0.6
                                                                              0.5

               3.7
                                                                              2.4

             2019            2020                                           2019            2020              2020-2022
           pro forma                                                      pro forma

Guidance:          Germany          Sweden            CEE & Turkey
1. Adjusted for non operating effects; assuming no further severe lockdowns in our major markets
                                                                                                                          46
Customer Solutions earnings growth driven by digitalization and
UK turnaround
EBITDA1,2                                                     EBIT1                                                      Outlook1
€ bn                                                          € bn

                          1.0-1.2
              1.1
                                                                             0.5         0.4-0.6
               0.3
                                                                              0.1
               0.2                            Decentral energy                0.1
                                                infrastructure
               0.6                                       ~30%                 0.5

             2019            2020                                            -0.2           2020                                              2020-2022
           pro forma
                                                                             2019
                                                                           pro forma

Guidance:          Germany          UK         Benelux        Other
1. Adjusted for non operating effects; assuming no further severe lockdowns in our major markets 2. ~30% EBITDA share relating to decentral energy infrastructure
                                                                                                                                                                    47
Strong EPS growth of 17-22%

Adjusted Net Income1                                          Earnings per share1                  Outlook1
€ bn                                                          €                                    CAGR
                          1.5-1.7
              1.6

                                                                            0.60 0.58-0.65
                                                                             Payout
                                                                                                      17-22%
                                                                              ratio
                                                                              77%

             2019            2020                                           2019            2020              2020-2022
           pro forma                                                      pro forma

1. Adjusted for non operating effects; assuming no further severe lockdowns in our major markets
                                                                                                                          48
Significant refinancing benefits over the next three years

Bond maturities as of end H1 20201,2
€ bn
                                                                                           Refinancing benefits                                                17.2

     Volume
                                                                                                       until 2022 of up to
%    Coupon
                                1.8                                                                    ~€200m3
                                                             1.5
                               0.4%                                                                  1.3
                                                    1.2
                                         5.7%               0.0%                           1.1
                                                                                 5.9%               5.6%                                    0.9
                                                                                                                         0.8
  0.6                 0.6                         0.0%                                                                                              3.9%
                                                                                                                                  0.5
                               6.5%                                                       0.4%
           3.2%                                             0.8%                 0.3                0.0%               3.0%                0.0%
 3.2%                6.5%                         5.5%                                                                           0.9%
                                                                                5.5%
  Q4                  Q2        Q3                  Q3        Q4                 Q1        Q2        Q4                  Q1       Q2        Q3                >2024
 20202               2021      2021                2022      2022               2023      2023      2023                2024     2024      2024

1. Bonds issued by E.ON SE and E.ON International Finance B.V. (fully guaranteed by E.ON SE); bonds issued by innogy SE and innogy Finance B.V. (fully guaranteed by innogy SE)
                                                                                                                                                                                  49
2. Including innogy EIB-loan €645m 3. For entire period 2020 - 2022
Green financing is an integral part of our funding strategy

Total investments 2020-2022                                                           To finance our investments we have tapped the
€ bn                                                                                  green bond market …
                                                  95%                                 €4.6bn outstanding                       4
                                                  energy transition
                                                  investments2
                                                                                        … and intend to issue more:

                             131                                                      ~€1bn p.a.
                                                                                      Revolving credit facility linked to sustainability ratings:

                                                                                      €3.5bn
     Energy Networks           Customer Solutions          Other3

1. Cash effective investments including Corporate Functions & Other and Non-Core, assuming no further severe lockdowns in our major markets 2. Based on investments in
                                                                                                                                                                         50
Energy Networks and Customer Solutions 3. Corporate Functions & Other and Non-Core 4. €3.75bn issued by E.ON SE and €0.85bn issued by innogy Finance B.V., including
Green Bond issuance April and May 2020.
E.ON’s approach to manage Economic Net Debt

Economic Net Debt
€ bn
     H1 2020

                        “Beat the        • 0% real discount rate floor reached: only upside
        -8.8
                        provisions”      • Further upside: outperforming provisions by operational excellence

                        “Focus on the • UK pension obligations largely funded
        -8.0            long end”     • Sensitivity GER pensions: -50bps +€1.6bn
                                      • Duration of pension obligation ~18 years
       -26.2
                        “Manage for      • Sound management of cash flow
                        cash”            • Re-financing benefits from lower interest rates
      -43.1
   Asset Retirement Obligations   Pensions   Net financial position
                                                                                                                51
Rating target re-confirmed, positive END effects above
initial expectations
Leverage factor1                                                                         Selected END effects 2020-20223
                                                                                         • 95% Cash conversion rate4
Strong      BBB/Baa rating target                                                      ↑•      Working Capital optimization program &
                                                                                               ARO5 reduction ~+€1.5bn (before: ~+€1bn)
              5.6x                                                                             (ARO reduction: ~€200m already achieved 2019)

                                                                                         • Nord Stream 1 transfer to pension fund executed ~+€1bn

                                              ~5x
                                                                                         • Transaction effects +/-€0bn (before: -€0.5bn)
                                                                                               Remedies, merger squeeze-out, locked box, restructuring Hungary

                                                                                         • Integration costs up to ~-€1bn

             2019                             2022
           pro forma2
1. Economic Net Debt/EBITDA, EBITDA adjusted for non-operating effects 2. Reflecting transaction adjustment (END FY 2019 reduced by ~€0.5bn) 3. Negative effect                52
indicates increase of Economic Net Debt and vice versa 4. Excluding provision utilization for nuclear decommissioning, average for 2020-2022 5. Asset Retirement Obligations
Dividend commitment fully in line with deleveraging

EPS1 above DPS growth…                                         …lowers payout ratio…                      … allowing deleveraging and
                                                                                                          sustainable dividend growth

                                                                                                            5.6x      Strong BBB/Baa rating
                                                                                                                              target
                                                                      77%
                                                                  Payout ratio
                                                                                                                              ~5x

   2019        2020         2021         2022                         2019                         2022     2019              2022
 pro forma                                                          pro forma                             pro forma

1. Adjusted for non operating effects; assuming no further severe lockdowns in our major markets
                                                                                                                                              53
Appendix
E.ON new segmentation from 2020 onwards

  IFRS reporting divisions
             Energy Networks                                       Customer Solutions                            Corporate                         Non-Core
                                                                                                                Functions &
        DE             SWE         CEE1 & TR               Benelux2        DE         UK       Other3                                          PE4            TR Gen5
                                                                                                                   Other

                    Power grid                                  City Energy                 Energy
                                                                 Solutions                 sales and
                     Gas grid                                      (CES)                    services
                                                                                             New
             Additional businesses                            B2B Solutions
                                                                                           Solutions

                  Regulated                           Decentral energy                   Energy
                  networks                             infrastructure                     retail

                                  Infrastructure
1. Central and Eastern Europe, including Czech Republic, Hungary, Poland, Romania, Slovakia, Croatia and Slovenia 2. Belgium, The Netherlands and Luxemburg             55
3. Including Czech Republic, Hungary, Italy, Poland, Romania, Sweden 4. PreussenElektra 5. Turkey Generation
E.ON’s strong ESG profile

Environmental                                             Social                                                     Governance

                Climate neutrality by 2040                                 Variety of nationalities, cultures,
                                                                           generations and genders                    Supervisory
                (Scope 1 & 2) & by 2050                     Diversity                                                                 Experienced, diverse and independent
                                                                           in management & workforce                  Board
                (including Scope 3)1

                Avoided emission together with              Health &       Creation of a work environment
                                                                                                                                      Efficient cooperation in Board
                our clients                                                that protects the health and safety
                                                            Safety                                                                    Committees
                2019: > 100mtons                                           of customers and employees
                                                                                                                      Supervisory
  Climate                                                                                                             Board
                                                                           Commitment to respect                      Committees
                Driving the energy transition
                through decentral & digital
                                                            Human          human rights, uphold labor                                 Creation of Innovation and
                                                            Rights         standards, and fight against                               Sustainability Committee
                local networks
                                                                           corruption

                                                            Security of
                                                                           Energy Networks: High                                  Remuneration system closely
                Energy efficiency solutions with our        energy
                clients to reduce carbon emissions          supply
                                                                           resilience due to high degree             Remuneration aligns management’s and
                                                                           of underground cabling                                 shareholder’s interest

1. Carbon neutrality by 2040 (Scope 1 and 2), 75% carbon reduction by 2030 (Scope 1 and 2), 50% reduction of Scope 3 emissions by 2030, carbon neutrality by 2050            56
(including Scope 3). Base year: 2019 pro forma
E.ON’s sustainability awards, ratings and rankings

                                                                             CDP Score: B
      Text 1                Result: AA                              Text 1
                                                                             Sector Average: C

                                                                             Overall ESG Score: 3.2
                            Overall ESG Score = 81 (Leader Group)
      Text 1                                                        Text 1   Sub Sector Average Multiutilities: 2.8
                            Relative Position 11 out of 192
                                                                             Industry Average Utilities: 2.7

                            E.ON is index member1, i.e. one                  E.ON ranks 4th in the Green Utilities
      Text 1                of the 120 most advanced                Text 1   Report from Energy Intelligence (EI)
                            companies in Europe + Eurozone                   Group

                            Rating: C+                              Text 1   E.ON ranks 6th out of 30

1. Vigeo/EIRIS was acquired by Moody’s in 2019                                                                        57
Building blocks of allowed revenues in Germany

Schematic illustration for 2019 (power & gas)
€ bn
                    ~21.2
       Gas           ~1.1
     (New)                                                                                  Totex indexed to
      Gas            ~3.4                                                                   CPI and subject to            Thereof:                             Thereof:
      (Old)                                                                                 general and individual     ~4.0 power                            ~8.3 power
                                                                                            efficieny targets          ~0.7 gas                              ~1.2 gas

     Power          ~10.2
     (New)                                                                                                                                         ~9.5

                                                                                                     ~4.7
                     ~6.5                              40% Cap                       Opex            ~3.0
     Power
      (Old)
                                                                                                     ~1.7        Capital Costs

              Regulated asset            Debt   base2            Regulated equity             Total allowed             Adjustment of       Allowed revenues
                  base1                                               base                      cost base              revenues, lagged
                                        (related to actual
              Old assets: current                                (related to regulatory          (Totex)                recoveries and
              costs; new assets:        capital structure,          capital structure,
                                         minimum 60%)                                                                 pass-through items
                historic costs                                      maximum 40%)

1. Old assets are those capitalized before January 1, 2006. New assets are those capitalized after January 1, 2006. Old assets are indexed up to 40% with asset-specific indices to   58
determine the current costs. Relevant asset base for calculation of allowed return in 2019 is 2016 for power and 2015 for gas 2. Debt base consists of non-interest and interest
bearing capital
Energy Networks Germany - Earnings components

Illustrative average EBITDA1 split (2019-2020)                                                      Illustrative average EBIT1 split (2019-2020)

                             0%                                                                                                             0%

                                     ~5%
                                                                  Regulated return & depreciation2                                                     ~5%
                                           ~10%
                                                                  Operational efficiency                                                                  ~5%
                                                                  Other infrastructure business3
          ~60%                                ~10%                Additional network-related business4                  ~50%
                                                                                                                                                           ~15%
                                                                  Other regulated earnings/temporary effects
                                                                  Income from participations
                                           ~10%
                                                                                                                                                  ~15%

                               Income from participations portfolio is at-equity/at-cost consolidated
1. Adjusted for non operating effects 2. Includes return on RAB, difference between regulatory and IFRS D&A and revenues for grid expansion 3. Other infrastructure businesses   59
include e.g. water business 4. Additional network-related business includes broadband, smart meter and technical network services
Continuous improvement in operative
performance increases security of supply
SAIDI1,2 2014 vs. 2019                                                                  Power losses2 2014 vs. 2019
Germany                                                                                Germany

              48.0              -40%                                                                   4.4              -14%
                                                                                                                                              3.8
                                                     29.0

              2014                                   2019                                             2014                                  2019

Sweden                                                                                 Sweden
              144.0
                               +18%3                170.0                                              3.9              -23%                  3.0

              2014                                   2019                                             2014                                  2019

CEE4                                                                                   CEE4
              336.0             -36%                                                                   9.1              -22%                 7.1
                                                    214.0

              2014                                   2019                                             2014                                  2019
1. System Average Interruption Duration Index 2. E.ON stand-alone figures 3. SAIDI increase due to weather related effects in 2019 22 minutes of disturbances (2014-2019),   60
includes: weather effects and other system disturbances 4. Calculated as arithmetic average of respective countries
RAB growth further supported by local drivers

Power RAB development                                                                 Local drivers
€ bn
                   3-5% CAGR
                                                                                                               • Renewable connections
Germany1               17.3                                                                                    • Replacement
                                                                                                               • Digitalization
                      2019                                2022

                                  3-5% CAGR
                                                                                                                • Storm proofing
Sweden2                3.8                                                                                      • Renewable connections
                                                                                                                • Demand growth
                      2019                                2022
                                  4-6% CAGR
                                                                                                                • New connections of B2B customers
Czech
                       1.6                                                                                      • Reliability
Republic
                                                                                                                • Modernization
                      2019                                2022
1. Assuming constant number of network concessions 2. Excluding RAB re-evaluation following the beginning of new regulatory period                   61
Network charges are only a small portion of German power price

Composition of average electricity price        Decarbonization currently not optimally supported,
                                                electricity disadvantaged

                                                 • Renewables surcharge to be borne by more customers
                    Electricity Renewable
                                                 • Carbon minimum price or tax
                procurement, surcharge
                                                 • Electricity tax to be redesigned
                 retail margin

                                Further taxes
                 Network
                                and levies
                  charges                          German power price needs to be ‘cleaned up’
Only

23%
                                                                                                        62
EU financing successful for major growth projects across Europe
with up to ~€250 m funding grants

  • More than €500m investments planned                                       ACON2,3 1.0/ACON 2.0
  • Around 50% approved in EU grants                                          • Increasing cross-border power distribution capacity and
  • All projects included in EU PCI1 list                                       grid modernization through implementation of smart grids

                                                                              Danube InGrid3,4
                                                                              • Improved security of supply and capacity in the boarder regions
                                                                              • Implementation of smart grids

                                                                              Smart Border Initiative3 (SBI)
                                                                              • Commission a cross-border smart distribution grid at low cost
                                                                              • Solving network bottlenecks and voltage problems intelligently

1. Project of Common Interest (EU Horizon 2020) 2. Again Connected Networks 3. Projects are part of the 4 th PCI list of EU 4. Danube Intelligent Grid
                                                                                                                                                         63
City Energy Solutions selected projects

Key figures                                   Project examples
                             Countries with   Högbytorp
                             CES projects              • 50% increase of renewable/recovered energy
      >750k customers                                  • 99% efficiency of CHP
                                                       • 659 GWh total output
                                              Hanseviertel Lüneburg
      ~5k installations                                • 8,100t CO2 savings per year
      under management                                 • 90% CHP efficiency
                                                       • 88% of heat demand covered by bio natural gas
                                              Werksviertel München
      350 heating, cooling                             • 50% less CO2
      & steam networks                                 • 10% lower energy cost
                                                       • High level of energy self-sufficiency
                                              Elephant & Castle London
                                                       • Inhouse construction management
       €1.5bn revenue                                  • 100% renewable heating supply
                                                         from 2023 (biogas)
                                                                                                         64
21 TWh of production rights for PreussenElektra already
transferred - Terms challenged

                                                              Nuclear power plant Krümmel1
                                                           88 TWh of production rights (before transfer)

                                                               21 TWh                          ~€27.8/MWh preliminary price

                                                                         PreussenElektra
 Transferred
 production rights                   10 TWh                                               6 TWh                                                5 TWh

                 Grohnde plant                                                 Isar II plant                                            Brokdorf plant
  Production rights secured until Oct 2020                    Production rights secured until Jan 2021                   Production rights secured until Jan 2021
    5-10 TWh production rights required2                       15-20 TWh production rights required2                       5-10 TWh production rights required2

1. Krümmel OHG is a joint venture between E.ON and Vattenfall, each party owning 50% equity share 2. Volumes shown after transfer/purchase from Krümmel, excluding
                                                                                                                                                                     65
minority stakes (16.7% minorities in Grohnde, 20% in Brokdorf and 25% in Isar II)
Regulated earnings split share

EBITDA 20201
€ bn
                                                                                                       regulated
                                                                                          • Regulated or quasi

                                                                                              Earnings share of ~75%
                                                      ~75%
                                                      (Quasi-)regulated
                                                      earnings
                                                                                                               strong
                                                                                          • Network operations in countries with
              6.8 – 7.0
                                                                                              regulatory frameworks
                                                                                          • Customer Solutions and Energy Networks

         Energy Networks           Customer Solutions          Other2
                                                                                              diversified across European countries
1. Adjusted for non operating effects; assuming no further severe lockdowns in our major markets 2. Other includes Corporate Functions & Other and Non-Core
                                                                                                                                                              66
Past delivery on guidance

EBIT1 vs. guidance                                        Adjusted Net Income1 vs. guidance
€ bn                                                      € bn

         3.1            3.1             3.0    3.2             0.9      1.4       1.5         1.5
         2016           2017            2018   2019            2016     2017     2018     2019
                                               reported                                   reported

       Guidance range
1. Adjusted for non operating effects
                                                                                                     67
Networks Capex breakdown 2020-2022

Germany                                                     Sweden                                             CEE
€ bn                                                        € bn                                               € bn

                     6.61                                                         1.11                                        2.01

 ~50%                                                         ~50%                                              ~60%
 investment in expansion                                      investment in expansion                           investment in expansion

                                                                 Maintenance          Grid expansion   Other
1. Cash effective investments; assuming no further severe lockdowns in our major markets
                                                                                                                                          68
Maintaining a substantial liquidity buffer is a cornerstone of
E.ON’s risk management

                                • €1.9bn in cash & equivalents                      Key takeaways
   Large volume of
                                • €1.2bn in short-term securities
   liquidity1                                                                       • Well-filled liquidity buffer
                                • €2.4bn of non-current securities
                                                                                    • Funding needs for 2020 already
                                                                                      covered by bonds and revolving
                                • Early de-risking of refinancing needs for 2020:     credit facility
   Bond refinancing
                                  All bond maturities covered in January 2020
   and squeeze-out                                                                  • Back-up RCF undrawn and fully
   already covered              • Funding need for squeeze-out covered by             committed
                                  recent bond issues
                                                                                    • Liquidity risk minimized, even in
                                                                                      highly volatile capital markets
   Plus further back- • Undrawn €3.5bn Revolving Credit Facility
                        (RCF), fully committed by 21 banks, no
   up RCF available     MAC-clause2

1. As per December 2019 2. MAC = Material Adverse Change
                                                                                                                          69
Benchmark bonds of E.ON Group as of July 20201

                                 Volume in millions in                                                                       Volume in millions in
Issuer                            respective currency       Coupon        Maturity        Issuer                              respective currency     Coupon        Maturity
innogy Finance B.V.                        570 GBP          6.500%         Apr-21         E.ON SE                                    1,000 EUR        0.375%         Sep-27
innogy Finance B.V.                      1,000 EUR          6.500%        Aug-21          innogy Finance B.V.                          850 EUR        1.250%         Oct-27
E.ON SE                                    750 EUR          0.375%        Aug-21          E.ON SE                                      500 EUR        0.750%         Feb-28
innogy Finance B.V.                        500 GBP          5.500%          Jul-22        E.ON SE                                      750 EUR        1.625%        May-29
E.ON SE                                    500 EUR          0.000%         Sep-22         innogy Finance B.V.                        1,000 EUR        1.500%          Jul-29
E.ON SE                                    750 EUR          0.000%         Oct-22         E.ON SE                                      750 EUR        0.350%         Feb-30
innogy Finance B.V. 2                      750 EUR          0.750%        Nov-22          innogy Finance B.V.                          760 GBP        6.250%         Jun-30
E.ON SE                                  1,000 EUR          0.375%         Apr-23         E.ON SE                                      500 EUR        0.750%         Dec-30
innogy Finance B.V.                        488 GBP          5.625%         Dec-23         E.ON SE                                      500 EUR        0.875%        Aug-31
E.ON SE                                    750 EUR          0.000%         Dec-23         E.ON SE                                      500 EUR        0.625%        Nov-31
innogy Finance B.V.                        800 EUR          3.000%         Jan-24         E.ON International Finance B.V.3             975 GBP        6.375%         Jun-32
E.ON SE                                    500 EUR          0.875%        May-24          innogy Finance B.V.                          600 EUR        5.750%         Feb-33
E.ON SE                                    750 EUR          0.000%        Aug-24          innogy Finance B.V.                          600 GBP        4.750%         Jan-34
innogy Finance B.V.                        750 EUR          1.000%         Apr-25         E.ON International Finance B.V.              900 GBP        5.875%         Oct-37
E.ON SE                                    750 EUR          1.000%         Oct-25         E.ON International Finance B.V.4           1,000 USD        6.650%         Apr-38
innogy Finance B.V.                        500 EUR          1.625%        May-26          E.ON International Finance B.V.              700 GBP        6.750%         Jan-39
E.ON SE                                    750 EUR          0.250%         Oct-26         innogy Finance B.V.                        1,000 GBP        6.125%          Jul-39

innogy also has a €645m, 3.23% coupon, Oct-20 maturity European Investment Bank loan outstanding 1. All bonds ≥€500m equivalent, all bonds are listed in Luxemburg, with
                                                                                                                                                                               70
exception of the unlisted USD bond under 144A/Regulation S 2. The bond was increased from €500m to €750m 3. The bond was increased from £850m to £975m 4. Bond
issued under rule 144A/Regulation S
Funding strategy

    Volumes
                      €2-4bn p.a.         • Bond refinancings
                                          • Cash utilization of asset retirement obligations

     Tenors
                   3-12 years preferred   • Optimize maturity profile & interest costs
                                          • Redemptions on any single day capped at €1bn

  Currencies
                       EUR preferred      • Predominantly Euro-based asset base

                                          • Regular & green bonds
                                          • Private placements & promissory notes

 Diversification
                   Instrument variety       (Schuldscheindarlehen)
                                          • Commercial paper
                                                                                               71
innogy’s bondholders will be offered to switch to E.ON

• E.ON is and will be the only active issuer going forward               Step 1 – Issuer Substitution in Q1 2020
• Rating agencies have attested that the degree of structural
  subordination is not significant

                                                                          innogy SE                 innogy Finance B.V.
                                                                                                   + innogy SE guarantee

• innogy’s ratings will be cancelled in 2020 and innogy’s group
                                                                         Step 2 – Offer of Bond Transfer in 2020
  financial reporting discontinued
• E.ON offers to move all innogy bonds to E.ON level and standards
  with ratings and transparent reporting
• Launch expected in H2                                               innogy Finance B.V.                  E.ON
                                                                     + innogy SE guarantee

                                                                                                                           72
E.ON’s Green Bond Framework

                                            Evaluate &                      Management                                                External
       Use of proceeds                                                                                    Reporting
                                                                                                                                 +
                                          select projects                   of proceeds                                              verification
• Finance and/or                   • Project selection based         • E.ON will strive to       • Allocation and impact
  refinance eligible green           on eligibility criteria           maintain a portfolio        reporting after a year
  projects in the following        • Green bond committee:             matching/exceeding        • Renewal on an annual
  eligible categories:                •    Sustainability              outstanding green bonds     basis until full allocation
   •    Renewable energy              •    Energy Networks           • Projects will be added on   of proceeds
   •    Energy efficiency             •    Customer Solutions          an on-going basis
   •    Clean transportation          •    Group Finance

Aligned with the ICMA Green Bond Principles1
Eligible Green Projects are aligned with draft EU taxonomy
1. https://www.icmagroup.org/green-social-and-sustainability-bonds/green-bond-principles-gbp/
                                                                                                                                                    73
PreussenElektra – Further ambition to „beat the provisions“

Solid track-record already until 2019                                                 Nuclear Asset Retirement Obligations1
• Bundling of decommissioning activities                                              € bn
                                                                                                    2016     2017    2018     2019
• Procurement successes by „convoy approach“
• Operational progress according to plan

Further optimization already planned and in execution                                                                          -9
                                                                                                             -10      -10
• Decommissioning preparations starting early
• Operational excellence lifting dismantling performance
  to next level (e.g. by increasing industrialization)

                                                                                                     -21

1. In 2017 implementation of KFK solution (transfer of ~€10bn to German government fund)
                                                                                                                                     74
E.ON’s H1 2020 Results
               Financial Appendix
Segment outlook 2020 remaining year                                                                                                  E.ON H1 2020 results

EBIT1 key drivers H2 2020
   Energy Networks                                            Customer Solutions                         Non-Core
      Germany & CEE:                                             All regions:                             PreussenElektra:
      –
      •   Covid-19 related lower volumes                        ––
                                                                 •   Covid-19 impact                      •+ Higher hedged prices
      Germany:                                                                                            •– Higher depreciation from purchase of
                                                                 Germany:
                                                                                                              production rights
      + Organic RAB growth
      •
                                                                 +
                                                                 •   Positive customer development and
                                                                     transaction synergy delivery
      Sweden:
                                                                 –
                                                                 •   Disposal of heating customers
     –
     •    Lower allowed WACC
                                                                 UK:
      CEE & Turkey:                                              +
                                                                 •   Operational improvements
      •+ Czech Republic: organic RAB growth
      •+ Slovakia: acquisition of VSE

      +
      •   Turkey: higher earnings in grid & retail

1. Adjusted for non operating effects, assuming no further severe lockdowns in our major markets
                                                                                                                                                        76
Financial highlights                                                                                                     E.ON H1 2020 results

                                              H1 2019
   €m                                                                  H1 2020               % YoY
                                             pro forma
  Sales                                                  -               30,503                      -
  EBITDA1                                         3,650                    3,656                   +0
  EBIT1                                           2,323                    2,162                   -7
  Adjusted Net Income 1                           1,052                       933                 -11
  OCFbIT                                          1,057                    1,521                 +44
  Investments                                     1,582                    1,422                  -10
  Economic Net Debt²                           -38,903                  -43,056                   -11

1. Adjusted for non operating effects; pro forma figures H1 2019, not audited 2. Economic Net Debt as per 30 June
2020 and 31 Dec 2019; Economic Net Debt definition takes into account the decommissioning provisions calculated
with a real discount rate of 0.0% as opposed to IFRS AROs; bonds issued by innogy are recorded at their nominal value:                      77
the amount in the consolidated balance sheets is €2.4 bn higher
Cash conversion in H1 seasonally low                                                                                                                          E.ON H1 2020 results

H1 2020
€ bn

                       44%              CCR1

                            0.3
       3.7

                                                                    1.5                                                         1.3
                                                                                                            0.2
                                               -2.4
                                                                                        -0.4

                                                                                                                                                    -1.4               -0.1
     Group                Cash            Change in WC           OCFbIT              Interest         Tax payments             OCF                 Capex                FCF
    EBITDA2           adjustments3                                                  payments

1. Cash Conversion Rate (CCR): (OCF bIT+ provision utilization nuclear) ÷ EBITDA 2. Adjusted for non operating effects 3. Net non cash effective EBITDA items incl. provision   78
utilizations and payments related to non operating earnings
Divisions: Energy Networks                                                                                                                                            E.ON H1 2020 results

EBIT1                                                                                         Drivers
€m
                                                                                                                                   –•
                                        –13%
                                                                                                                                        Covid-19-related lower volumes
                          1,903                                                                   Germany                          –•   Weather-related lower volumes
CEE & Turkey               316                                   1,652
                           262                                    321
       Sweden
                                                                            186
                                                                                                    Sweden
                                                                                                                                   –•   Lower WACC in new regulatory period

       Germany            1,325
                                                                                                                                   –•   Higher transmission charges
                                                                 1,145
                                                                                                                                   –•   Covid-19-related lower volumes

                        H1 2019                                 H1 2020
                                                                                                            CEE                    +•   Operational improvements
                        pro forma
  €m                                          Germany                       Sweden                          CEE & Turkey                             Total
                                   H1 2019                       H1 2019                         H1 2019                                 H1 2019
                                              H1 2020   % YoY               H1 2020   % YoY                   H1 2020      % YoY                    H1 2020   % YoY
                                  pro forma                     pro forma                       pro forma                               pro forma
 Revenue                                -       7,052      -          -         444      -            -         1,291         -               -       8,787      -
        1
 EBITDA                             1,975       1,841     -7        340         263    -23          486           481        -1           2,801       2,585     -8
      1
 EBIT                               1,325       1,145    -14        262         186    -29          316           321        +2           1,903       1,652    -13
 thereof equity-method earnings         -         119      -          -           0      -            -            67         -               -         186      -
 OCFbIT                               749       1,316    +76        323         296     -8          530           449       -15           1,602       2,061    +29
Investments                           728         873    +20        135         161    +19          226           264       +17           1,090       1,298    +19

1. Adjusted for non operating effects; pro forma figures H1 2019, not audited                                                                                                          79
Divisions: Customer Solutions                                                                                                                                                      E.ON H1 2020 results

EBIT1                                                                                                    Drivers
€m                                                                                                                                            –•     Weather-related impact on volumes

                              443                  +3%                      457
                                                                                                                            All               –•     Covid-19: sell-back of volumes (B2B) & bad
                                                                                                                                                     debt

                                                                            280
                                                                                                                                              +•     Restructuring benefits
      Germany                 321                                                                                           UK                +•     Positive customer development under E.ON
        Benelux                                                                          57                                                          brand
            Other                 74                                                     43
                                           50                                  77
                UK       H1 2019                                         H1 2020
                         pro forma
 €m                                                Germany                          Benelux                         UK                                Other                           Total
                                        H1 2019                       H1 2019                          H1 2019                            H1 2019                       H1 2019
                                                   H1 2020   % YoY                  H1 2020   % YoY               H1 2020     % YoY                  H1 2020   % YoY                 H1 2020   % YoY
                                       pro forma                     pro forma                        pro forma                          pro forma                     pro forma
Revenue                                      -      11,188      -          -          1,489      -          -       7,356            -         -       4,493       -         -        24,526       -
        1
 EBITDA                                    384         339    -12        104             90    -13         83         109         +31        135         178     +32       706           716      +1
 EBIT1                                     321         280    -13         74             57    -23         -2          43         n.a.        50          77     +54       443           457      +3
 thereof equity-method earnings              -           1      -          -              2      -          -           0            -         -           4       -         -             7       -
 OCFbIT                                   -314        -485    -54       -135            -74    +45        111          86         -23        158         159      +1      -180          -314     -74
Investments                                 78         103    +32         20             19     -3        108          52         -52        211         159     -25       417           333     -20

1. Adjusted for non operating effects; pro forma figures H1 2019, not audited                                                                                                                          80
Non-Core business                                                                                                                                                                E.ON H1 2020 results

EBIT1                                                                                                            Drivers
€m                                                                                                                                             +•    Higher achieved power prices

                                                     -2%                                                                                       +•
                              245                                                 241                                                                Higher production volumes
                                                                                                                        Preussen
                                                                                                                          Elektra              –•    Higher depreciation from purchase of
        Preussen                                                                                                                                     production rights
                              182
         Elektra                                                                  222                                                          –•    Transfer of minority stakes2 to RWE

      Generation                                                                                                        Turkey
         Turkey                   63                                                        19                       Generation                –•    One-off effect in H1 2020

                          H1 2019                                             H1 2020
                          pro forma
                                                                                                                                                    PreussenElektra: Hedged Prices (€/MWh)
 €m                                                PreussenElektra                   Generation Turkey                        Total                 as of 30 June 2020
                                        H1 2019                               H1 2019                             H1 2019
                                                      H1 2020        % YoY               H1 2020         % YoY               H1 2020   % YoY
                                       pro forma                             pro forma                           pro forma
                                                                                                                                                    2019                 100%        33
Revenue                                      -             696          -           -           -            -         -         696      -
        1
 EBITDA
      1
                                           283             461        +63          63          19          -70       346         480    +39         2020                 91%                   46
 EBIT                                      182             222        +22          63          19          -70       245         241     -2
 thereof equity-method earnings              -              27          -           -          19            -         -          46      -         2021                 73%                  45
 OCFbIT                                    158             251        +59           -           -            -       158         251    +59
Investments                                  4             158          -           -           -            -         4         158      -         2022                 46%                   45
1. Adjusted for non operating effects; pro forma figures H1 2019, not audited 2. NPP Emsland & Gundremmingen C                                                                                      81
Adjusted Net Income                                                                               E.ON H1 2020 results

                                                        H1 2019
  €m                                                                            H1 2020   % YoY
                                                       pro forma
  EBITDA1                                                   3,650                 3,656      +0

  Depreciation/amortization                                -1,327                -1,494     -13
         1
  EBIT                                                      2,323                 2,162      -7

  Economic interest expense (net)                            -542                  -559      -3
        1
  EBT                                                       1,781                 1,603     -10
                            1
  Income Taxes on EBT                                        -456                  -401     +12
             1
  % of EBT                                                  -26%                  -25%        -
  Non-controlling interests                                  -273                  -269      +1
                            1
  Adjusted Net Income                                       1,052                  933      -11

1. Adjusted for non operating effects; pro forma figures H1 2019, not audited                                      82
Reconciliation of EBIT to                                                                  E.ON H1 2020 results

IFRS Net Income
  €m                                                           H1 2019   H1 2020   % YoY
            1
 EBITDA                                                          2,710     3,656     +35

  Depreciation/Amortization/Impairments                           -993    -1,494     -50
        1
 EBIT                                                            1,717     2,162     +26
  Reclassified businesses of Renewables                           -266        0     +100
  Interest result                                                 -435      -332     +24
  Net book gains                                                   19       159     +737
  Restructuring                                                    -90      -305    -239
  Mark-to-market valuation of derivatives                         -337       -70     +79
  Impairments (net)                                                 0        -16       -
  Other non-operating earnings                                     -30      -307    -923
  Income/Loss from continuing operations before income taxes      578      1,291    +123
  Income taxes                                                    -245      -682    -178
  Income/loss from continuing operations                          333       609      +83
  Income/loss from discontinued operations, net                   209        -63    -130
  Net income/loss                                                 542       546       +1

1. Adjusted for non operating effects                                                                       83
Cash effective investments1                                               E.ON H1 2020 results

                                             H1 2019
  €m                                                    H1 2020   % YoY
                                            pro forma
  Energy Networks                              1,090      1,298    +19
  Customer Solutions                             417       333      -20
  Corporate Functions & Other                     72       -365    -610
  Consolidation                                    0         -2       -
  Non-Core                                         4       158        -
  Investments                                  1,582      1,422     -10

1. Pro forma figures H1 2019, not audited                                                    84
Economic Net Debt1                                                                                             E.ON H1 2020 results

   €m                                                          31 Dec 2019               30 Jun 2020
  Liquid funds                                                          3,602                     3,342
  Non-current securities                                                2,353                     2,079
  Financial liabilities                                              -28,955                   -31,833
  Adjustment FX hedging²                                                   167                       165
  Net Financial Position                                             -22,833                   -26,247
  Provisions for pensions                                              -7,201                    -7,972
  Asset retirement obligations                                         -8,869                    -8,837
  Economic Net Debt                                                  -38,903                   -43,056

1. Economic Net Debt definition takes into account the decommissioning provisions calculated with a real
discount rate of 0.0% as opposed to IFRS AROs; bonds issued by innogy are recorded at their nominal value:
the amount in the consolidated balance sheets is €2.4 bn higher 2. Net figure; does not include transactions                      85
relating to our operating business or asset management
Economic interest expense (net)2                                                                                        E.ON H1 2020 results

                                                                               H1 2019               Difference
  €m                                                                                      H1 2020
                                                                              pro forma               (in € m)
  Interest from financial assets/liabilities                                      -466       -526           -60
  Interest cost from provisions for pensions and similar provisions                -62        -47          +15
  Accretion of provisions for retirement obligations and similar provisions        -36         -2          +34
  Construction period interests¹                                                     7         4             -3
  Others                                                                            15        12             -3
  Net interest result                                                             -542       -559           -17

1. Borrowing cost that are directly attributable to the acquisition, construction or production of a qualified asset.
Borrowing cost are interest costs incurred by an entity in connection with the borrowing of funds (interest rate:
3.86%) 2. Pro forma figures H1 2019, not audited                                                                                           86
E.ON’s Proforma
 Financials 2019
E.ON’s Proforma Financials1 — 2019

Adjusted EBITDA1                                                             Adjusted EBIT1

€m                                                                FY 20192   €m                          FY 20192
Energy Networks                                                      5,364   Energy Networks                3,499
 Germany                                                             3,721    Germany                       2,358
 Sweden                                                                692    Sweden                         539
 CEE & Turkey                                                          951    CEE & Turkey                   602
Customer Solutions                                                  1,126    Customer Solutions              541
 Benelux                                                              192     Benelux                        132
 Germany                                                              648     Germany                        487
 UK                                                                   -10     UK                             -180
 Other                                                                296     Other                          102
Corporate Functions/Other                                            -203    Corporate Functions/Other      -341
Non-Core business                                                     617    Non-Core business               366
Total                                                               6,904    Total                         4,065
1. Adjusted for non operating effects 2. Pro forma, not audited
                                                                                                                    88
E.ON’s Proforma Financials1 — 2019

OCFbIT                                                                       Investments (cash-effective)

€m                                                                FY 20192   €m                             FY 20192
Energy Networks                                                      4,255   Energy Networks                   3,149
 Germany                                                             2,455    Germany                          2,254
 Sweden                                                                718    Sweden                            313
 CEE & Turkey                                                        1,082    CEE & Turkey                      582
Customer Solutions                                                     378   Customer Solutions               1,008
 Benelux                                                                84    Benelux                            90
 Germany                                                               71     Germany                           226
 UK                                                                   128     UK                                211
 Other                                                                 95     Other                             481
Corporate Functions/Other                                            -657    Corporate Functions/Other          130
Non-Core business                                                     313    Non-Core business                  148
Total                                                               4,289    Total                            4,435
1. Adjusted for non operating effects 2. Pro forma, not audited
                                                                                                                       89
E.ON’s Proforma Financials1 — 2019

At-equity contribution to adjusted EBITDA/EBIT1                              E.ON Financials P&L

€m                                                                FY 20192    €m                                                 FY 20192
Energy Networks                                                        349   Adjusted EBITDA1                                       6,904
 Germany                                                              219
                                                                             Depreciation/amortization recognized in Adjusted
 Sweden                                                                 0                                                          -2,839
                                                                             EBIT
 CEE & Turkey                                                         130
                                                                             Adjusted EBIT1                                         4,065
Customer Solutions                                                     22
                                                                             Economic interest expense (net)                       -1,304
 Benelux                                                                4
 Germany                                                                6    Adjusted EBT1                                          2,761
 UK                                                                     0    Income Taxes on Adjusted EBT                            -724
 Other                                                                 12    % of Adjusted EBT                                       26%
Corporate Functions/Other                                              70    Non-controlling interest on results of operations       -464
Consolidation                                                           -1
                                                                             Adjusted Net Income1                                   1,573
Non-Core business                                                     125
Total                                                                 565
1. Adjusted for non operating effects 2. Pro forma, not audited
                                                                                                                                            90
You can also read