Spatially Adjusted time-varying Reproductive numbers: Understanding the Geographical expansion of Urban Dengue outbreaks - Nature
←
→
Page content transcription
If your browser does not render page correctly, please read the page content below
www.nature.com/scientificreports

            OPEN           Spatially Adjusted Time-
                           varying Reproductive Numbers:
                           Understanding the Geographical
                           Expansion of Urban Dengue
                           Outbreaks
                           Ta-Chou Ng1 & Tzai-Hung Wen2*

                           The basic reproductive number (R0) is a fundamental measure used to quantify the transmission
                           potential of an epidemic in public health practice. However, R0 cannot reflect the time-varying nature
                           of an epidemic. A time-varying effective reproductive number Rt can provide more information
                           because it tracks the subsequent evolution of transmission. However, since it neglects individual-level
                           geographical variations in exposure risk, Rt may smooth out interpersonal heterogeneous transmission
                           potential, obscure high-risk spreaders, and hence hamper the effectiveness of control measures in
                           spatial dimension. Therefore, this study proposes a new method for quantifying spatially adjusted
                           (time-varying) reproductive numbers that reflects spatial heterogeneity in transmission potential
                           among individuals. This new method estimates individual-level effective reproductive numbers (Rj)
                           and a summarized indicator for population-level time-varying reproductive number (Rt). Data from the
                           five most severe dengue outbreaks in southern Taiwan from 1998–2015 were used to demonstrate the
                           ability of the method to highlight early spreaders contributing to the geographic expansion of dengue
                           transmission. Our results show spatial heterogeneity in the transmission potential of dengue among
                           individuals and identify the spreaders with the highest Rj during the epidemic period. The results also
                           reveal that super-spreaders are usually early spreaders that locate at the edges of the epidemic foci,
                           which means that these cases could be the drivers of the expansion of the outbreak. Therefore, our
                           proposed method depicts a more detailed spatial-temporal dengue transmission process and identifies
                           the significant role of the edges of the epidemic foci, which could be weak spots in disease control and
                           prevention.

                           The basic reproductive number (R0) is a fundamental measure used to quantify the transmission potential of an
                           epidemic1. It is defined as the number of infections caused by an index case within a completely susceptible pop-
                           ulation, i.e., a population in which there is no pre-existing immunity. R0 is a summary index suggesting both the
                           intrinsic transmissibility of a pathogen and the infrastructure that allows the disease to spread in a given setting.
                           In particular, the value of R0 is affected by transmission probability, contact rate and duration of infectiousness2.
                               Based on deterministic homogenous-mixing epidemic models3, public health practitioners usually regard
                           R0 = 1 as a useful threshold for ensuring the development of an outbreak, referred to as the epidemic threshold4.
                           The health authorities also use R0 for predicting final epidemic size3,5 and assessing the resources required to con-
                           tain the outbreak, e.g., determining what proportion of people should be vaccinated2. Therefore, it is of great prac-
                           tical importance to estimate R0 for a possible outbreak in public health practice. The value of R0 is estimated from
                           the initial growth rate of an epidemic based on mechanistic models, such as the susceptible-infected-recovered
                           model3,6. For example, R0 has been estimated at approximately 1.5 for 2009 H1N1 influenza7, at 3 for the 2003
                           severe acute respiratory syndrome (SARS) outbreak8, and at 12–18 for historical measles outbreaks9. As an epi-
                           demic unfolds, however, the depletion and recovery of the susceptible population cause fluctuating effective

                           1
                            Graduate Institute of Epidemiology and Preventive Medicine, College of Public Health, National Taiwan University,
                           Taipei, 100, Taiwan. 2Department of Geography, National Taiwan University, Taipei City, 106, Taiwan. *email:
                           wenthung@ntu.edu.tw

Scientific Reports |   (2019) 9:19172 | https://doi.org/10.1038/s41598-019-55574-0                                                            1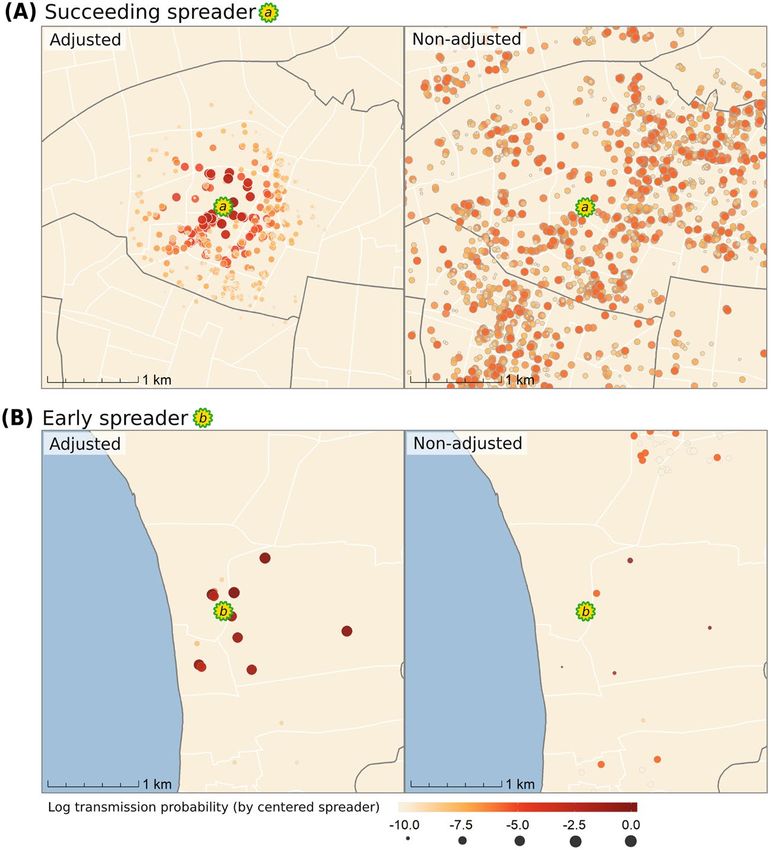
www.nature.com/scientificreports/                                                               www.nature.com/scientificreports

                           transmissibility, so the value of R0 cannot reflect the time-varying nature of an epidemic. Moreover, when an
                           epidemic occurs in a realistic contact network, R0 can also fail to characterize the transmission potential at the
                           initial stage10.
                               On the other hand, the effective reproductive number (R) is defined as the number of infections caused by any
                           case11. The difference between R and R0 is that the value of R does not depend on the assumption that the pop-
                           ulation is completely susceptible, which is often violated in later stages of an outbreak or in a situation in which
                           the population has been exposed to the pathogen previously. Therefore, R aims to characterize the progression
                           of an epidemic in a realistic scenario. Intuitively, counting the branches of infection on transmission trees (i.e.,
                           who infects whom6) precisely quantifies the value of R; however, doing this is impractical in most circumstances
                           except for confined outbreaks where contact tracing is feasible12. The epidemic curve (an illustration of the num-
                           ber of new infections) does not encode transmission dynamics and cannot be used to infer R directly. The renewal
                           equation11, which describes the temporal transmission relationship between propagating generations of infected
                           cases, is therefore proposed to estimate R from incidence data in different epidemic periods. More specifically,
                           the renewal equation estimates the values of the time-varying effective reproductive number (Rt), defined as the
                           population-level transmission potential at time t11,13. In a fully susceptible population, early values of Rt should
                           approximate R0, but Rt is more informative in that it tracks the subsequent evolution of transmission potential
                           during the course of an outbreak. The values of Rt can also reveal the time when an outbreak was contained by
                           monitoring the epidemic threshold. During the 2014 Ebola outbreak in West Africa, Rt captured a distinct tem-
                           poral pattern of transmission potential in different countries, signaling the different levels of control measures
                           needed14. As the change in transmission potential is highly correlated to control measures, public health practi-
                           tioners can evaluate the effectiveness of control measures by determining the change in Rt after implementation.
                           For example, sudden drops in Rt (from 3 to approximately 0.7) after the issuance of a global alert during the 2003
                           SARS outbreak indicated the effectiveness of the alert15.
                               Time-varying effective reproductive numbers can be estimated by the renewal equation with a weighted ratio
                           of infectors and infectees11. The generation interval, defined as the infection time interval between a potential
                           infector and an infectee, is the major component of the process of determining the temporal weights of possible
                           transmission. A major pitfall of the renewal equation method is that it automatically assumes homogeneous
                           mixing of individuals. In effect, the temporal weight assumes that transmission probability is determined only
                           by the temporal difference in onset of illness between the infector and infectees, regardless of possible variations
                           due to geographical and social proximity. Human mobility and contact patterns are highly structured in the real
                           world16–18 and inevitably violate the homogeneous mixing assumption19. Studies have demonstrated spatial het-
                           erogeneities in the transmission of dengue20, cholera21, influenza22, and foot-and-mouth disease23. Recent studies
                           have also shown that spatial distance between cases strongly influences short-term movement24 and, hence, the
                           spread of these diseases. Moreover, short-range transmission has served the essential mode of disease transmis-
                           sion25, i.e., patients typically have a higher chance of infecting others nearby. Although this spatial effect has been
                           considered in the aforementioned studies and in the transmission tree reconstruction of some diseases26,27, the
                           effect of spatial distance on the estimation of the effective reproductive number has not yet been explored. The
                           spatial relationship between individuals can be utilized to calculate the discriminative transmission potential
                           for each individual (Fig. 1; see the methods section for details). Neglecting the spatial variation, conversely, may
                           smooth out heterogeneities in transmission potential, obscure high-risk spreaders, and hamper the effectiveness
                           of control measures. In summary, the effect of spatial proximity or distance should be accounted for in the esti-
                           mation of effective reproductive numbers.
                               Therefore, the objective of this study is to propose such method for quantifying spatially adjusted reproductive
                           numbers that reflects spatial heterogeneity in exposure risk. It generates individual-level effective reproductive
                           numbers (Rj) and a summarized indicator for the whole population (Rt) by the transmission probability estimated
                           for all infector-infectee pairs, based on both temporal and spatial characteristics. Temporal weighting functions
                           account for the fact that infected cases can only transmit the disease effectively within a certain time window
                           (the generation interval). When only temporal weighting is considered, our method is equivalent to the renewal
                           equation, assuming homogeneous mixing. The spatial weighting function, on the other hand, accounts for the
                           decaying chance of transmission when the distance between individuals increases. The value of spatially adjusted
                           Rj can provide more information regarding spatial heterogeneities in transmission potential and can better aid in
                           the implementation of control measures. Data from dengue epidemics in southern Taiwan are used to demon-
                           strate the ability of this method to identify early spreaders contributing to the geographic expansion of dengue
                           transmission.

                           Methods
                           Study Area.       Taiwan (23.778°N, 120.930°E) is an island country at the border of tropical and subtropical
                           climate zones. Due to its geographic proximity to dengue endemic countries in Southeast Asia (Fig. 2A), dengue
                           outbreaks in Taiwan are triggered by imported index cases from endemic regions. Large outbreaks have occurred
                           in the tropical monsoon regions of southern Taiwan, particularly in the cities of Tainan (TN) and Kaohsiung
                           (KH). These two large tropical cities feature high temperatures and high humidity, high population density, and
                           highly urbanized landscapes, all of which provide appropriate breeding habitats for Aedes aegypti, the main vec-
                           tor mosquitoes of dengue virus. Thus, as dengue outbreaks occur frequently in late summer and wane in winter,
                           the two cities form natural settings for the repetitive observation of dengue invasion and epidemic propagation.

                           Dengue data. Dengue fever is listed as a notifiable infectious disease in Taiwan. This means that physicians
                           are mandated to report suspected cases in which the patient lives in or has a history of travel to a dengue-affected
                           area and has corresponding symptoms, including fever, rash, eye pain, leukopenia, etc. The reported cases are
                           then confirmed by standard laboratory tests, including real-time PCR, ELISA, and antigen detection28. These

Scientific Reports |   (2019) 9:19172 | https://doi.org/10.1038/s41598-019-55574-0                                                              2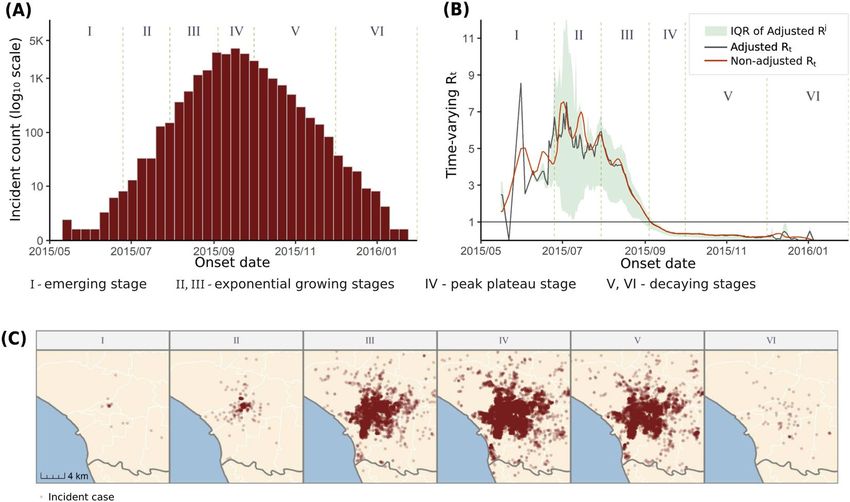
www.nature.com/scientificreports/                                                                   www.nature.com/scientificreports

                           Figure 1. Illustration of how individual reproductive numbers were calculated (panel A) and the difference
                           between the spatially adjusted and non-adjusted methods (panel B). The transmission probability from
                           individual j to all potential infectees (pi1 j , pi 2 j , p i 3 j ) is estimated first. The sum of these probabilities is, by
                           definition, the expected number of infectees caused by individual j, i.e., the individual reproductive number.
                           The transmission probability itself is estimated based on solely temporal relationships (non-adjusted) or in
                           combination with spatial relationships (spatially adjusted). In the non-adjusted method, p·j is proportional to
                           the temporal weight g(a) determined by the generation interval between infector j and its infectees. Cases in the
                           same temporal cohort (i.e., with the same onset day, a1 = a2 = a3) share the same transmission probability from
                           previous infectors. They also share the same individual reproductive number since their relationship to
                           subsequent cases is again identical. For the spatially adjusted method, p·j is proportional to the spatial weights
                           f(d), modulated by the distance between the infector and the infectees in space. Therefore, individual
                           reproductive numbers of cases in the same cohort can be distinguished.

                           Figure 2. Geographic locations of Tainan (TN) city and Kaohsiung (KH) city and their history of dengue
                           outbreaks. Panel A shows the location of the cities relative to other dengue endemic countries in Southeast
                           Asia. Panel B shows the annual number of indigenous dengue infections recorded in TN and KH. The five most
                           severe epidemics selected by the outbreak size were included in this study. The maps are generated by R package
                           ggplot2, and sf (version 3.6.1, https://cran.r-project.org).

                           surveillance data are recorded and provided by Taiwan Centers for Disease Control, Ministry of Health and
                           Welfare29. The dengue database starts in 1998, when the electronic reporting system was implemented, and we
                           include all records since 1998-01-01. Individual-level information, including date of disease onset and X-Y coor-
                           dinates of residence, is also provided. Each pair of residence coordinates is listed as the center of a basic statis-
                           tical area, which is the smallest geographic unit for socioeconomic surveying in Taiwan. There was a total of
                           78,749 confirmed dengue cases (4.4% of them were imported cases) in Taiwan from 1998 to 2017, 92.5% of which
                           occurred in Tainan and Kaohsiung cities.

Scientific Reports |   (2019) 9:19172 | https://doi.org/10.1038/s41598-019-55574-0                                                                     3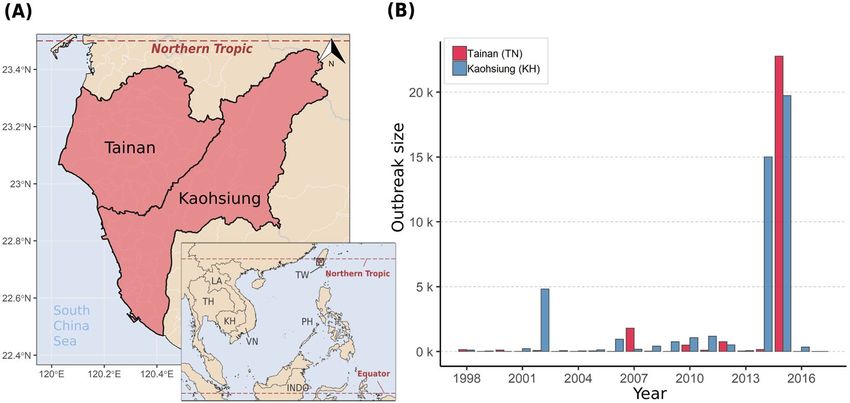
www.nature.com/scientificreports/                                                                        www.nature.com/scientificreports

                               Figure 2B shows the historical records of dengue epidemics in Taiwan since 1998; the five most severe out-
                           breaks were included in this study. Among the five outbreaks, two occurred in Tainan (2007TN, 2015TN), and
                           three occurred in Kaohsiung (2002KH, 2014KH, 2015KH). The sizes of the outbreaks ranged from 22,784 cases in
                           2015TN to 1,183 cases in 2011KH. Generally, dengue outbreaks start in June, reach their peak around September,
                           and end near the end of the year or early the next January. In this study, we analyzed the largest outbreak, 2015TN,
                           to demonstrating our method, while detailed results for the other four epidemics are presented in our supple-
                           mentary results. Of the 22,784 total infections in 2015TN, only 19 cases ( 0, g (tˆ ) is the
                           transmission weight of the case pair (i, j). The pairwise transmission weight is then normalized by all received
                           transmission weights of case i (from all potential infectors k ≠ i) to produce consistent estimation of transmission
                           probability. The resulting pij is interpreted as the probability of individual i being infected by individual j.
                           Therefore, Rj as the average number of secondary cases caused by individual j is the sum of all pij involving j as the
                           infector, as shown in Fig. 1A and Eq. (3).

                                                           Non‐adjusted R j =     ∑ i≠j , t i>t jNon‐adjusted pij                               (3)

                           Spatially adjusted reproductive number. In this study, we extend a previous method with a spatial
                                                    ij
                           weighting function, f (dˆ ), in order to account for the effect of spatial variation on dengue infections. We refer to
                           this extended method as the (spatially) adjusted method. The transmission probability for case pair (i, j) becomes
                                                                                              ij        ij
                                                                                          g (tˆ )f (dˆ )
                                                                    Adjusted pij =                           ik
                                                                                                   ik
                                                                                      ∑k≠i g (tˆ )f (dˆ )                                       (4)
                           where d̂ ij is the distance between the pair (i, j) and f is a function relating transmission weight to the distance
                           between cases. The specifications of the temporal difference t̂ij and g remain the same as in the previous method.
                           Likewise, the spatially adjusted individual reproductive number R jsp is the sum of those pijsp involving j as the infec-
                           tor (Eq. 5).

Scientific Reports |   (2019) 9:19172 | https://doi.org/10.1038/s41598-019-55574-0                                                                4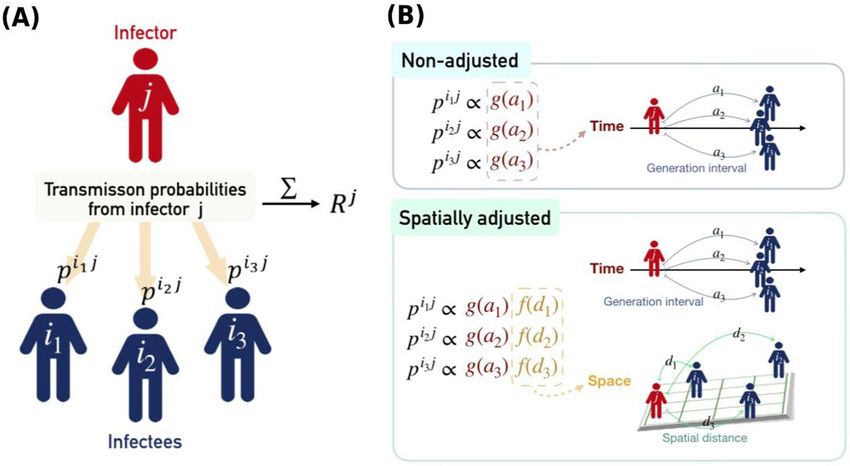
www.nature.com/scientificreports/                                                                                         www.nature.com/scientificreports

                                                                 Adjusted R j =              ∑ i≠j , t i>t jAdjusted pij                                 (5)
                               The spatial weighting function is also called the transmission kernel and is a monotonically decaying function
                           with respect to distance, reflecting neighborhood transmission32. Thus, unlike the generation interval, which
                           is typically marked with a temporally lagged effect because of the latency period of infectiousness, the spatial
                           weighting function decreases monotonically as distance increases, which means people would be easily get infec-
                           tions if they live near each other. It reflects people in the nearby neighborhood may share common environmental
                           sources of dengue infection. There are several kinds of spatial kernels used in the literature, including exponen-
                           tial decay25 and power-law decay33. In the context of dengue transmission, we adopted an exponential decaying
                           kernel with mean = 125 m27. This approach accounts for both temporal and spatial relationships when estimating
                           individual-level reproductive numbers. Apart from the component of the generation interval inherited from the
                           previous method, the distance-decayed spatial weighting function captures the spatial risk of dengue infection.
                               To calculate the population-level effective reproductive number from individual estimates, the Rj values can
                           be further aggregated to form the Adjusted Rt given a specified time step τ13:
                                                                                                                        j
                                                                                               ∑ t −0.5τ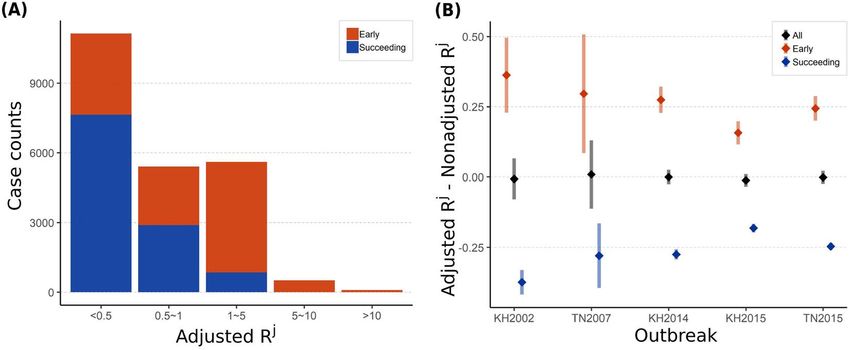
www.nature.com/scientificreports/ www.nature.com/scientificreports
Figure 3. (A) Epidemic curve for the 2015TN outbreak, which was divided into six stages as labeled in the
figure. The y-axis is log-transformed to show more clearly the incidence in in emerging stage (I) and illustrate
exponential growing pattern in rapidly growing stages (II and III). (B) Estimated time-varying reproductive
numbers through the course of the 2015TN outbreak. The curves denote the population-level Rt (black for
spatially adjusted estimates and orange for non-adjusted estimates). The shaded area presents the interquartile
range (IQR) of individual reproductive numbers (Rj) over time, which only exists for the spatially adjusted
estimates. The epidemic threshold of R = 1 is marked as a black, horizontal line. (C) Spatial distribution of
incident dengue cases at the six stages. The maps are generated by R package ggplot2, and sf (version 3.6.1,
https://cran.r-project.org).
Figure 3C shows the spatial distributions of incident cases in these stages. We can identify the linkages between
time-varying reproductive numbers (Fig. 3B) and spatial-temporal distributions of incident cases (Fig. 3A,C)
in different stages. In the emerging stage, the irregular growth of Adjusted Rt reflects the initial growth of the
outbreak with a sporadic distribution of incident cases and a small emerging cluster (Fig. 3C). Subsequently, in
the growing stages (from stage II to III), the epidemic curve started to show exponential growth (Fig. 3A); the
larger IQR of the individual reproductive numbers (Fig. 3B) reflects some incident cases with higher transmission
potential that occurred and resulted in vigorous expansion of disease clustering (Fig. 3C). In the stage of peak
plateau (stage IV), Adjusted Rt dropped under the epidemic threshold ( 10) and normal-
(Adjusted Rj < 10) spreaders. The figure also shows that long-range transmission links are from super-spreaders.
The result indicates that dengue cases with high transmissibility have the ability to spread pathogens to geograph-
ically distant areas.
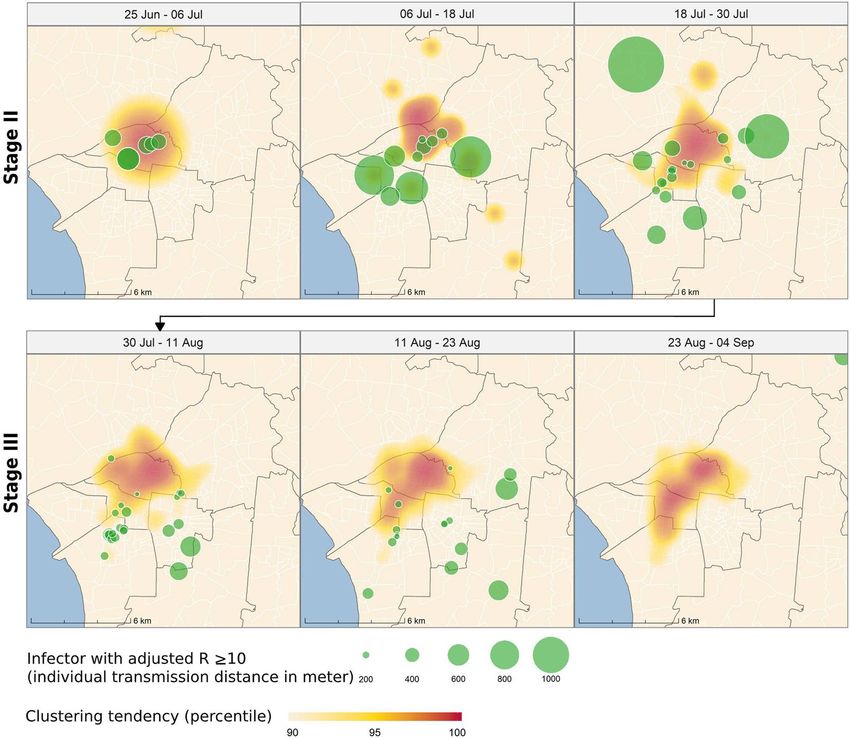
To further explore spatial relationships of super-spreaders and dengue epidemic expansion, we illustrated the
locations of super-spreaders and clustering tendency of the dengue epidemic during the rapidly growing period
(stages II and III), as shown in Fig. 5. Except the very beginning of the stage II (June-25–July-6), the figure shows
that super-spreaders tend to distribute at or outside the edge of the main clusters from July-06 to August-23. In
addition, the circle size of the super-spreaders in Fig. 5 represent their transmission range. Therefore, the loca-
tions of larger circles would reflect long-rage transmission occurred at the edge of dengue clusters. It implied that
the role of super-spreaders could be the drivers of geographic expansion of the dengue epidemic.
In order to profile the roles of different spreaders in detailed spatial transmission/expansion process, we classi-
fied the cases into two types, early spreaders and succeeding spreaders. Early spreaders are regarded as the sources
of new emerging clusters, and succeeding spreaders are those that come after early spreaders. Figure 6 presents
a succeeding spreader a (panel A) and an early spreader b (panel B). In each panel, we also compared different
methods (spatially adjusted and non-adjusted) that estimate the transmission probability from a spreader to its
potential infectees. The time of the incident cases on these maps is the 30th day after the onset day of the given
spreader. Infectees labeled with darker colors have a higher probability of becoming infected by spreader a or b.
Scientific Reports | (2019) 9:19172 | https://doi.org/10.1038/s41598-019-55574-0 6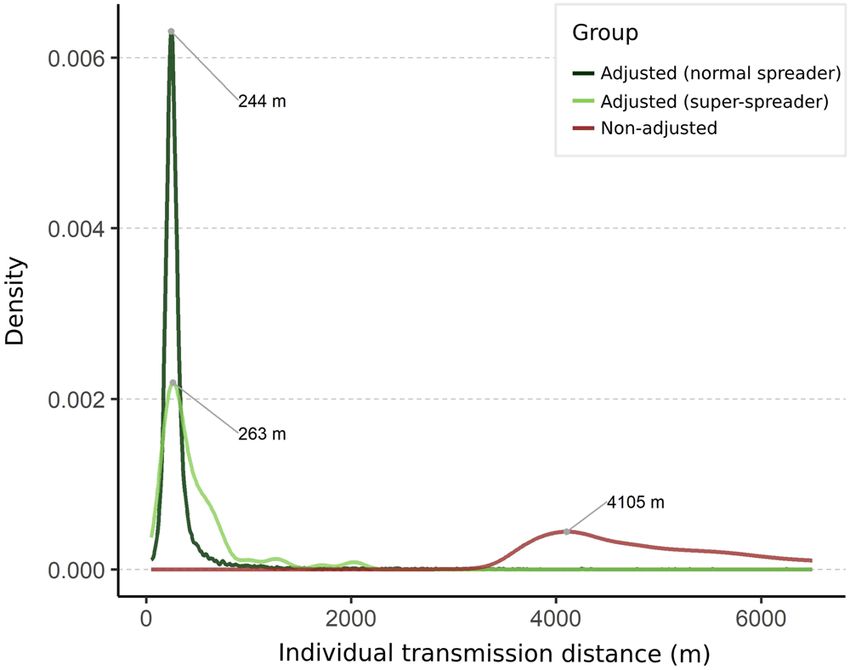
www.nature.com/scientificreports/                                                             www.nature.com/scientificreports

                           Figure 4. The distribution of individual transmission distance of super-spreaders (Rj ≥ 10) or normal spreaders
                           (Rj < 10). The estimates by spatially adjusted method are shown in green (dark green for normal spreaders, and
                           light green for super-spreaders), while the estimates by non-adjusted method are shown in dark red.

                           Figure 5. Spatial distribution of super-spreaders (Rj ≥ 10), compared with the main clusters of the dengue
                           outbreak during the rapidly growing stages (II and III). The red area represents the most clustered region,
                           the center of the ongoing outbreak, while the light yellow area represents the edge of the outbreak. The green
                           circles represent the locations of the super-spreaders, with the radius being proportional to their transmission
                           distances. The maps are generated by R package ggplot2, and sf (version 3.6.1, https://cran.r-project.org).

Scientific Reports |   (2019) 9:19172 | https://doi.org/10.1038/s41598-019-55574-0                                                            7
www.nature.com/scientificreports/ www.nature.com/scientificreports
Figure 6. Comparisons of the transmission likelihood calculation for the two spreader types (panels A and
B) between two methods. In each map, the potential infectees are shown in dots of different sizes and colors
corresponding to their transmission probability by the infector (aligned at the center). (A) Illustration of a
succeeding spreader a (Non-adjusted Ra = 4.15; Adjusted Ra = 1.85). (B) Illustration of an early spreader b
(Non-adjusted Rb =4.15; Adjusted Rb = 5.74). The maps are generated by R package ggplot2, and sf (version
3.6.1, https://cran.r-project.org).
By the non-adjusted method, the two spreaders have identical transmission probabilities and individual repro-
ductive number because of the homogenous mixing assumption (Non-adjusted Ra = Non-adjusted Rb = 4.15).
However, they should play different roles in the spatial expansion of the outbreak. Spreader a (the succeeding
spreader) occurred in an ongoing cluster; thus, this case is unlikely to be the primary source that triggered this
local outbreak. Spreader b (the early spreader), on the contrary, initiated a new cluster where no case had occurred
before, and the following cases that emerged were centered on spreader b. Thus, a subsequent local outbreak can
be logically attributed to spreader b as the primary ancestor. The adjusted method (left-side maps in Fig. 6), which
takes into account the spatial-temporal relationships of incident cases, differentiates the individual reproductive
numbers of early and succeeding spreaders (Adjusted Ra = 1.84, Adjusted Rb = 5.74). It also yields more reasona-
ble spatial transmission potential by upweighting the potential infectees proximity to spreader a in Fig. 6A.
To clarify the distinct roles of early and succeeding spreaders in the outbreak expansion process, we com-
pared the distributions of Adjusted Rj between different types of spreaders in Fig. 7A. We found that all the
super spreaders (Adjusted Rj > 10) are early spreaders and most of succeeding spreaders have low Adjusted Rj.
To examine the generalization of this pattern, we estimated Adjusted Rj of dengue cases in top five largest dengue
epidemics since 1990 in Taiwan, including KH2002, TN2007, KH2014, KH2015, TN2015, as shown in Fig. 7B.
Non-adjusted Rj were used as the baseline to control for the fluctuations across different stages of the outbreak.
The figure showed consistent patterns among these large-scale dengue outbreaks, which means early spreaders
with high transmissibility can be generally highlighted by the spatially adjusted method.
Discussion
The effective time-varying reproductive number is a commonly used indicator for measuring disease trans-
missibility. However, the index conventionally does not capture spatial dynamics of disease transmission. We
proposed a new method of calculating the spatially adjusted effective reproductive number by incorporating a
spatial-weighting function that captures the nature of heterogeneous mixing. Unlike the averaged time-varying
reproductive number, this method estimates different individual-level reproductive numbers (Rj) for given onset
Scientific Reports | (2019) 9:19172 | https://doi.org/10.1038/s41598-019-55574-0 8www.nature.com/scientificreports/ www.nature.com/scientificreports
Figure 7. (A) The individual-level spatially adjusted reproductive numbers (Adjusted Rj) of early and
succeeding spreaders. (B) Paired difference in the estimates of the individual reproductive number (Adjusted
Rj–Non-Adjusted Rj) by different spreader types and major outbreaks.
times and locations of dengue infections. Thus, it can reflect spatial heterogeneity in transmission potential
among individuals and identify the possible super-spreaders35 with high Rj during the rapidly growing period.
Our results also reveal that dengue cases with high transmission potential and long-transmission distance are
usually located at the edges of the epidemic foci, which means they could be the drivers of further outbreak
expansion. Therefore, our proposed method depicts a more detailed spatial-temporal dengue transmission pro-
cess and identifies the significant role of the edges apart from the epidemic foci, which could be the weak spots in
disease control and prevention. Our spatially adjusted method also could further apply to assess individual-level
transmission potential of other acute contagious diseases, such as influenza and Zika virus infection, with
observed generation interval and the context of neighborhood transmission.
The effective reproductive number of dengue as estimated in past studies reflected an averaged overall epi-
demic trend, which did not take into account the spatial heterogeneity of transmissibility. Hsieh36 estimated the
effective reproductive number at the initial stage of the 2015TN outbreak to be 6.84, which is similar to our
averaged estimates (Fig. 3B). Hsieh’s study also showed that Kaohsiung consistently possessed lower effective
reproductive numbers (from 1.29 to 2.87), implying that Tainan city may have epidemiological characteristics,
such as a lack of herd immunity, that make it more prone to dengue transmission than Kaohsiung. Internationally,
Guzzetta25 reported that the time-varying reproductive number of non-endemic urban cities in Brazil is much
smaller than the estimates from Tainan and Kaohsiung cities (maximum Rt is approximately 2.2). Codeco31 and
Pinho37 also estimated time-varying reproductive numbers in Salvador and Brazil, with a maximum Rt of approx-
imately 4.5. Comparing the values of Rt among different cities may be subject to possible confounding factors,
such as weather conditions, host immunity and circulating viral strands.
Some studies considered location information to determine reproductive numbers for quantifying transmis-
sibility of foot-and-mouth disease (FMD)38,39. These models considered spatial distribution of farms, however,
it was difficult to capture FMD disease transmission process among animals. In other words, the time-varying
reproductive numbers in these models are difficult to reflect nature course of FMD transmission in terms of
implementing general interval and renewal equation. Furthermore, farm-level models for FMD outbreaks can be
categorized the farms into infected and susceptible ones to determine relative transmissibility of each farm at a
specific time. It may be difficult to estimate the amount of susceptible persons living around the infected cases for
human infectious diseases, such as influenza and dengue fever. Other studies have also explored spatial hetero-
geneity by performing stratified analysis of Rt with respect to different administrative regions and with respect to
region-to-region transmission40,41. These studies used a spatial weighting function to emphasize the interregional
transmission process but still assumed a homogeneous-mixing model within each region. Thus, these studies did
not address the spatial heterogeneous mixing issue when estimating reproductive numbers. Our study considered
individual-level spatial heterogeneity and used the spatially adjusted reproductive number to measure the trans-
mission potential of each individual.
Like the basic reproductive number, Rj can be regarded as a function of duration of infectiousness, incubation
period, transmission probability, vector mosquito density, and host-vector contact rate. The adjusted Rj in this
study could reflect vector mosquito density and host-vector contact rate, which are also highly heterogeneous in
space42. Meanwhile, the dispersal of vector mosquitoes is largely confined to neighboring areas (average radius
of 28–199 meters43), providing an effective infectious zone of an infector. An exponential spatial weighting func-
tion herein represents this infectious zone. Guzzetta25 estimated the mean transmission distance of dengue in a
metropolis area to be approximately 127 m and further indicated that an exponential distribution described the
data better than a radiation model which is a more dispersed distribution effectively describes human mobility44.
Kissler, et al.45 also reported the aptness of the exponential distribution when an outbreak is typically dominated
by short-range transmission. Therefore, the exponential spatial weighting function in this study is an appropriate
substitute for the effective infectious zone for measuring dengue transmission. The exponential distance-decayed
Scientific Reports | (2019) 9:19172 | https://doi.org/10.1038/s41598-019-55574-0 9www.nature.com/scientificreports/ www.nature.com/scientificreports
function also avoids overestimating the transmission probabilities of infector-infectee pairs with long geographic
distances, especially for large-scale dengue epidemics. In sum, areas with high Rj are potential risk areas for high
dengue transmission; knowledge of such areas is important for spatial targeting during dengue epidemics.
Spatial epidemiological studies focused for many years on developing methods for identifying significant
disease clustering in time and space, such as space-time scan statistics46 or point pattern analysis47. Hotspot areas
identified are usually regarded as significant risk areas and as high-priority sites for intervention strategies aimed
at mitigating an epidemic48,49. The significance of the study is to introduce the perspective of individual-level
transmission potential to disease risk mapping. We found that locations of individuals with high transmission
potential are usually located at the edges of growing disease clusters, which can easily be neglected when inter-
vention resources focus on epidemic clusters. A previous study found that urban villages that were originally at
the edge of the city but are now enclosed by urbanized lands act as transfer stations for dengue outbreaks50. In
this study, we further provide a better understanding of outbreak expansion by categorizing different types of
spreaders. Early spreaders with high transmission potential may initiate new source of infection at the edges of
the main cluster, resulting in geographic expansion at the exponential growing stages of the outbreak. Therefore,
the edge of the outbreak should be a priority of spatial targeting to contain the outbreak regarding both range
and magnitude. Succeeding spreaders are indeed still important in tallying morbidity and fatality. However, their
high-density clustering patterns make them prone to the depletion of local susceptible populations and degener-
ating transmission potential. In summary, the center and edges of epidemic clusters play different roles in devel-
oping epidemic progression in terms of different types of spreaders (succeeding vs. early) and different patterns
of epidemic growth (intensifying vs. expanding). These findings provide important insights for implementing
different interventions in the center and on the edges of epidemic clusters.
There are several limitations to this study. First, the method of estimating time-varying effective reproductive
numbers is a retrospective procedure that uses observed infectee generation to estimate the Rj of the infector gen-
eration. In other words, it cannot be used for predicting future epidemic progression in real time. Nonetheless,
the method is helpful for understanding the course of an epidemic and studying the possible mechanisms of geo-
graphical expansion. Second, this study considers only geographical distance as a factor in transmission potential.
Other factors influence the spatial spreading of dengue. Among these, host heterogeneity (including variations in
density51, mobility52, and susceptibility53) strongly modulates the transmission dynamic42 and should be consid-
ered in further studies. Finally, the spatial weighting function reflects the assumption of distance-decayed prop-
erties (neighborhood transmission). However, the assumption may not reflect long-distance transmission54 and
complex urban transport and mobility52. The question of how to develop more detailed spatial weighting schemes
that capture realistic mobility patterns warrants further investigation.
Data availability
The dengue surveillance dataset used in the current study are publicly available in Taiwan CDC Open Data Portal,
https://data.cdc.gov.tw. The data analysis tutorial is included in Supplementary Information files.
Received: 30 August 2019; Accepted: 26 November 2019;
Published: xx xx xxxx
References
1. Heesterbeek, J. & Dietz, K. The concept of Ro in epidemic theory. Statistica Neerlandica 50, 89–110 (1996).
2. Dietz, K. The estimation of the basic reproduction number for infectious diseases. Statistical methods in medical research 2, 23–41
(1993).
3. Vynnycky, E. & White, R. An introduction to infectious disease modelling. OUP oxford, (2010).
4. Heffernan, J. M., Smith, R. J. & Wahl, L. M. Perspectives on the basic reproductive ratio. Journal of the Royal Society Interface 2,
281–293 (2005).
5. Yi, W. & JinDe, C. Final size of network epidemic models: Properties and connections. SCIENCE CHINA Information Sciences.
Advance online publication. doi:10.1007/s11432-019-2656-2 (2019).
6. Cauchemez, S., Hoze, N., Cousien, A. & Nikolay, B. How Modelling Can Enhance the Analysis of Imperfect Epidemic Data. Trends
in parasitology (2019).
7. Fraser, C. et al. Pandemic potential of a strain of influenza A (H1N1): early findings. Science 324, 1557–1561 (2009).
8. Lipsitch, M. et al. Transmission dynamics and control of severe acute respiratory syndrome. Science 300, 1966–1970 (2003).
9. Guerra, F. M. et al. The basic reproduction number (R0) of measles: a systematic review. The Lancet Infectious Diseases 17, e420–e428
(2017).
10. Liu, Q.-H. et al. Measurability of the epidemic reproduction number in data-driven contact networks. Proceedings of the National
Academy of Sciences 115, 12680–12685 (2018).
11. Wallinga, J. & Lipsitch, M. How generation intervals shape the relationship between growth rates and reproductive numbers.
Proceedings of the Royal Society B: Biological Sciences 274, 599–604 (2006).
12. Faye, O. et al. Chains of transmission and control of Ebola virus disease in Conakry, Guinea, in 2014: an observational study. The
Lancet Infectious Diseases 15, 320–326 (2015).
13. Cori, A., Ferguson, N. M., Fraser, C. & Cauchemez, S. A new framework and software to estimate time-varying reproduction
numbers during epidemics. American journal of epidemiology 178, 1505–1512 (2013).
14. Team, W. E. R. Ebola virus disease in West Africa—the first 9 months of the epidemic and forward projections. New England Journal
of Medicine 371, 1481–1495 (2014).
15. Wallinga, J. & Teunis, P. Different epidemic curves for severe acute respiratory syndrome reveal similar impacts of control measures.
American Journal of epidemiology 160, 509–516 (2004).
16. Balcan, D. et al. Multiscale mobility networks and the spatial spreading of infectious diseases. Proceedings of the National Academy
of Sciences 106, 21484–21489 (2009).
17. Mossong, J. et al. Social contacts and mixing patterns relevant to the spread of infectious diseases. PLoS medicine 5, e74 (2008).
18. Roth, C., Kang, S. M., Batty, M. & Barthélemy, M. Structure of urban movements: polycentric activity and entangled hierarchical
flows. PloS one 6, e15923 (2011).
19. Riley, S. Large-scale spatial-transmission models of infectious disease. Science 316, 1298–1301 (2007).
Scientific Reports | (2019) 9:19172 | https://doi.org/10.1038/s41598-019-55574-0 10www.nature.com/scientificreports/ www.nature.com/scientificreports
20. Favier, C. et al. Influence of spatial heterogeneity on an emerging infectious disease: the case of dengue epidemics. Proceedings of the
Royal Society B: Biological Sciences 272, 1171–1177 (2005).
21. Tuite, A. R. et al. Cholera epidemic in Haiti, 2010: using a transmission model to explain spatial spread of disease and identify
optimal control interventions. Annals of internal medicine 154, 593–601 (2011).
22. Viboud, C. et al. Synchrony, waves, and spatial hierarchies in the spread of influenza. Science 312, 447–451 (2006).
23. Savill, N. J. et al. Topographic determinants of foot and mouth disease transmission in the UK 2001 epidemic. BMC Veterinary
Research 2, 3 (2006).
24. Kraay, A. N., Trostle, J., Brouwer, A. F., Cevallos, W. & Eisenberg, J. N. Determinants of Short-term Movement in a Developing
Region and Implications for Disease Transmission. Epidemiology 29, 117–125 (2018).
25. Guzzetta, G., Marques-Toledo, C. A., Rosà, R., Teixeira, M. & Merler, S. Quantifying the spatial spread of dengue in a non-endemic
Brazilian metropolis via transmission chain reconstruction. Nature communications 9, 2837 (2018).
26. Ypma, R. J. et al. Unravelling transmission trees of infectious diseases by combining genetic and epidemiological data. Proceedings
of the Royal Society B: Biological Sciences 279, 444–450 (2011).
27. Wen, T.-H., Sabel, C. E. & Wang, I.-H. A geo-computational algorithm for exploring the structure of diffusion progression in time
and space. Scientific reports 7, 12565 (2017).
28. Center for Diseases Control, M. o. H. a. W., Taiwan. Guidelines for dengue control. (2009).
29. Center for Diseases Control, M. o. H. a. W., Taiwan. Dengue daily Confirmed cases since 1998, https://data.cdc.gov.tw/dataset/
dengue-daily-determined-cases-1998 (2019).
30. Champredon, D., Dushoff, J. & Earn, D. J. Equivalence of the Erlang-distributed SEIR epidemic model and the renewal equation.
SIAM Journal on Applied Mathematics 78, 3258–3278 (2018).
31. Codeço, C. T., Villela, D. A. & Coelho, F. C. Estimating the effective reproduction number of dengue considering temperature-
dependent generation intervals. Epidemics 25, 101–111 (2018).
32. Cowling, B. J., Fang, V. J., Riley, S., Peiris, J. M. & Leung, G. M. Estimation of the serial interval of influenza. Epidemiology 20, 344
(2009).
33. Meyer, S. & Held, L. Power-law models for infectious disease spread. The Annals of Applied Statistics 8, 1612–1639 (2014).
34. Shi, X. Selection of bandwidth type and adjustment side in kernel density estimation over inhomogeneous backgrounds.
International Journal of Geographical Information Science 24, 643–660 (2010).
35. Stein, R. A. Super-spreaders in infectious diseases. International Journal of Infectious Diseases 15, e510–e513 (2011).
36. Hsieh, Y.-H. Dengue outbreaks in Taiwan, 1998-2017: importation, serotype and temporal pattern. Asian Pacific Journal of Tropical
Medicine 11, 460 (2018).
37. Pinho, S. D. et al. Modelling the dynamics of dengue real epidemics. Philosophical Transactions of the Royal Society A: Mathematical,
Physical Engineering Sciences 368, 5679–5693 (2010).
38. Ferguson, N. M., Donnelly, C. A. & Anderson, R. M. Transmission intensity and impact of control policies on the foot and mouth
epidemic in Great Britain. Nature 413, 542 (2001).
39. Haydon, D. T. et al. The construction and analysis of epidemic trees with reference to the 2001 UK foot–and–mouth outbreak.
Proceedings of the Royal Society of London. Series B: Biological Sciences 270, 121–127 (2003).
40. Backer, J. A. & Wallinga, J. Spatiotemporal analysis of the 2014 Ebola epidemic in West Africa. PLoS computational biology 12,
e1005210 (2016).
41. Yamauchi, T., Takeuchi, S., Yamano, Y., Kuroda, Y. & Nakadate, T. Estimation of the effective reproduction number of influenza
based on weekly reports in Miyazaki Prefecture. Scientific reports 9, 2539 (2019).
42. Cummins, B., Cortez, R., Foppa, I. M., Walbeck, J. & Hyman, J. M. A spatial model of mosquito host-seeking behavior. PLoS
computational biology 8, e1002500 (2012).
43. Harrington, L. C. et al. Dispersal of the dengue vector Aedes aegypti within and between rural communities. The American journal
of tropical medicine 72, 209–220 (2005).
44. Simini, F., González, M. C., Maritan, A. & Barabási, A.-L. A universal model for mobility and migration patterns. Nature 484, 96
(2012).
45. Kissler, S. M. et al. Geographic transmission hubs of the 2009 influenza pandemic in the United States. Epidemics 26, 86–94 (2019).
46. Kulldorff, M., Heffernan, R., Hartman, J., Assunçao, R. & Mostashari, F. A space–time permutation scan statistic for disease outbreak
detection. PLoS medicine 2, e59 (2005).
47. Gatrell, A. C., Bailey, T. C., Diggle, P. J. & Rowlingson, B. S. Spatial point pattern analysis and its application in geographical
epidemiology. Transactions of the Institute of British geographers, 256–274 (1996).
48. Cuadros, D. F., Awad, S. F. & Abu-Raddad, L. J. Mapping HIV clustering: a strategy for identifying populations at high risk ofHIV
infection in sub-Saharan Africa. International journal of health geographics 12, 28 (2013).
49. Liu, Y. et al. Detecting spatial-temporal clusters of HFMD from 2007 to 2011 in Shandong Province, China. PloS one 8, e63447
(2013).
50. Ren, H., Wu, W., Li, T. & Yang, Z. Urban villages as transfer stations for dengue fever epidemic: A case study in the Guangzhou,
China. PLoS neglected tropical diseases 13, e0007350 (2019).
51. Caraco, T., Duryea, M. C., Glavanakov, S., Maniatty, W. & Szymanski, B. K. Host spatial heterogeneity and the spread of vector-borne
infection. Theoretical Population Biology 59, 185–206 (2001).
52. Stoddard, S. T. et al. The role of human movement in the transmission of vector-borne pathogens. PLoS neglected tropical diseases 3,
e481 (2009).
53. Smith, D., Dushoff, J., Snow, R. & Hay, S. The entomological inoculation rate and Plasmodium falciparum infection in African
children. Nature 438, 492 (2005).
54. Wang, Y., Cao, J., Li, X. & Alsaedi, A. Edge-based epidemic dynamics with multiple routes of transmission on random networks.
Nonlinear Dynamics 91, 403–420 (2018).
Acknowledgements
The research was supported by the grants of Ministry of Science and Technology (MOST 107-2410-H-002-
167-MY3; MOST 108-2638-H-002-002-MY2) and National Health Research Institutes (NHRI-108A1-
MRCO-0619191) in Taiwan. The authors also acknowledge the financial support provided by Infectious Diseases
Research and Education Center, Ministry of Health and Welfare (MOHW) and National Taiwan University
(NTU) and the NTU Research Center for Future Earth from The Featured Areas Research Center Program within
the framework of the Higher Education Sprout Project by the Ministry of Education (MOE) in Taiwan. The
funders had no role in study design, data collection and analysis, or preparation of the manuscript.
Author contributions
T.H.W. conceived of the main conceptual ideas. T.C.N. and T.H.W. developed the theory, analyzed the results, and
wrote the manuscript. T.C.N. performed the experiments in discussions with T.H.W.
Scientific Reports | (2019) 9:19172 | https://doi.org/10.1038/s41598-019-55574-0 11www.nature.com/scientificreports/ www.nature.com/scientificreports
Competing interests
The authors declare no competing interests.
Additional information
Supplementary information is available for this paper at https://doi.org/10.1038/s41598-019-55574-0.
Correspondence and requests for materials should be addressed to T.-H.W.
Reprints and permissions information is available at www.nature.com/reprints.
Publisher’s note Springer Nature remains neutral with regard to jurisdictional claims in published maps and
institutional affiliations.
Open Access This article is licensed under a Creative Commons Attribution 4.0 International
License, which permits use, sharing, adaptation, distribution and reproduction in any medium or
format, as long as you give appropriate credit to the original author(s) and the source, provide a link to the Cre-
ative Commons license, and indicate if changes were made. The images or other third party material in this
article are included in the article’s Creative Commons license, unless indicated otherwise in a credit line to the
material. If material is not included in the article’s Creative Commons license and your intended use is not per-
mitted by statutory regulation or exceeds the permitted use, you will need to obtain permission directly from the
copyright holder. To view a copy of this license, visit http://creativecommons.org/licenses/by/4.0/.
© The Author(s) 2019
Scientific Reports | (2019) 9:19172 | https://doi.org/10.1038/s41598-019-55574-0 12You can also read