Spatial diffusion of the 2015-2016 Zika, dengue and chikungunya epidemics in Rio de Janeiro Municipality, Brazil
←
→
Page content transcription
If your browser does not render page correctly, please read the page content below
Epidemiology and Infection                            Spatial diffusion of the 2015–2016 Zika, dengue
        cambridge.org/hyg
                                                              and chikungunya epidemics in Rio de Janeiro
                                                              Municipality, Brazil
                                                              A. P. R. Dalvi1 and J. U. Braga1,2
        Original Paper
                                                              1
        Cite this article: Dalvi APR, Braga JU (2019).         Escola Nacional de Saude Publica Sergio Arouca, Fundação Oswaldo Cruz, Rio de Janeiro, Brazil and 2Instituto de
        Spatial diffusion of the 2015–2016 Zika,              Medicina Social, Universidade do Estado do Rio de Janeiro, Rio de Janeiro, Brazil
        dengue and chikungunya epidemics in Rio de
        Janeiro Municipality, Brazil. Epidemiology and            Abstract
        Infection 147, e237, 1–13. https://doi.org/
        10.1017/S0950268819001250                                 Different countries, especially Brazil, that have faced recurrent dengue epidemics for decades
                                                                  and chikungunya epidemics since 2014, have had to restructure their health services to combat
        Received: 13 September 2018
                                                                  a triple epidemic of arboviruses – Zika, dengue and Chikungunya – transmitted by the same
        Revised: 11 April 2019
        Accepted: 5 June 2019                                     vector, mainly Aedes aegypti, in 2015–2016. Several efforts have been made to better under-
                                                                  stand these three arboviruses. Spatial analysis plays an important role in the knowledge of dis-
        Key words:                                                ease dynamics. The knowledge of the patterns of spatial diffusion of these three arboviruses
        Chikungunya virus; dengue virus; spatio                   during an epidemic can contribute to the planning of surveillance actions and control of
        temporal analysis; Zika virus
                                                                  these diseases. This study aimed to identify the spatial diffusion processes of these viruses
        Author for correspondence: J. U. Braga,                   in the context of the triple epidemic in 2015–2016 in Rio de Janeiro, Brazil. Two study designs
        E-mail: ueleres@gmail.com                                 were used: cross-sectional and ecological. Sequential Kernel maps, nearest-neighbour ratios
                                                                  calculated cumulatively over time, Moran global autocorrelation correlograms, and local
                                                                  autocorrelation changes over time were used to identify spatial diffusion patterns. The results
                                                                  suggested an expansion diffusion pattern for the three arboviruses during 2015–2016 in Rio de
                                                                  Janeiro. These findings can be considered for more effective control measures and for new
                                                                  studies on the dynamics of these three arboviruses.

                                                              Introduction
                                                              The emergence and reemergence of diseases have always been a concern of researchers,
                                                              managers and the general population worldwide. Several factors are attributed to the spread
                                                              of pathogens, including climatic, socio-environmental and human mobility factors [1, 2].
                                                              Among the diseases transmitted by vectors, Zika, dengue and chikungunya deserve attention.
                                                              Although the three arboviruses may have an asymptomatic presentation [3], their severe forms
                                                              pose a great challenge to public health. Zika virus (ZIKV) emerged as a major threat in
                                                              the Americas in 2015, generating serious cases of microcephaly in newborns [4, 5] and
                                                              Guillain–Barré [6]. Chikungunya virus (CHIKV) fever can trigger neurological and joint pro-
                                                              blems for months [7]. Finally, dengue virus (DENV) infection can present as a haemorrhagic
                                                              form, which can lead to death [8].
                                                                  ZIKV, CHIKV and DENV are transmitted by the same vectors, mainly Aedes aegypti, and,
                                                              as a result, their global distributions often overlap [9].
                                                                  In 2015 and 2016, several Brazilian municipalities were challenged by an epidemic caused
                                                              by the ZIKV that alarmed health professionals. The discovery of the severe forms of ZIKV
                                                              infection and its dispersion throughout the Americas led the Pan American Health
                                                              Organization and World Health Organization (PAHO/WHO) to declare an emergency of
                                                              international importance in 2015 [10]. Brazilian municipalities then endemic for the other
                                                              arboviruses – DENV and CHIKV – faced the introduction of a new virus, ZIKV, transmitted
                                                              by vectors or via sexual and vertical routes [11].
                                                                  Several efforts have been made to improve the knowledge of ZIKV, especially in the context
                                                              of the triple epidemic, and spatial analysis plays an important role in the understanding of the
                                                              dynamics of diseases. Various techniques may be employed, such as those used in the inves-
        © The Author(s) 2019. This is an Open Access          tigation of outbreaks or epidemics [12]. Spatial diffusion is characterised as a dynamic process
        article, distributed under the terms of the
                                                              of movement of a phenomenon in space and time, which occurs when a disease is transmitted
        Creative Commons Attribution licence (http://
        creativecommons.org/licenses/by/4.0/), which          to a new region [13].
        permits unrestricted re-use, distribution, and            The spatial diffusion process can be classified as contagious, expansion, relocation or hier-
        reproduction in any medium, provided the              archical. The expansion or contagious patterns are characterised by the onset in a given region
        original work is properly cited.                      and the spread to adjacent areas so that the disease has a greater intensity at the place of origin
                                                              and spreads with less intensity to neighbouring areas. In contrast, hierarchical and relocation
                                                              patterns are characterised by the onset of the disease in a certain place and a ‘jump’ of the
                                                              disease to a more distant place. The process of diffusion may also be mixed, when both expan-
                                                              sion and hierarchical diffusion processes are observed simultaneously [14]. Spatial diffusion

Downloaded from https://www.cambridge.org/core. IP address: 46.4.80.155, on 14 Dec 2020 at 02:06:05, subject to the Cambridge Core terms of use, available at https://www.cambridge.org/core/terms
. https://doi.org/10.1017/S0950268819001250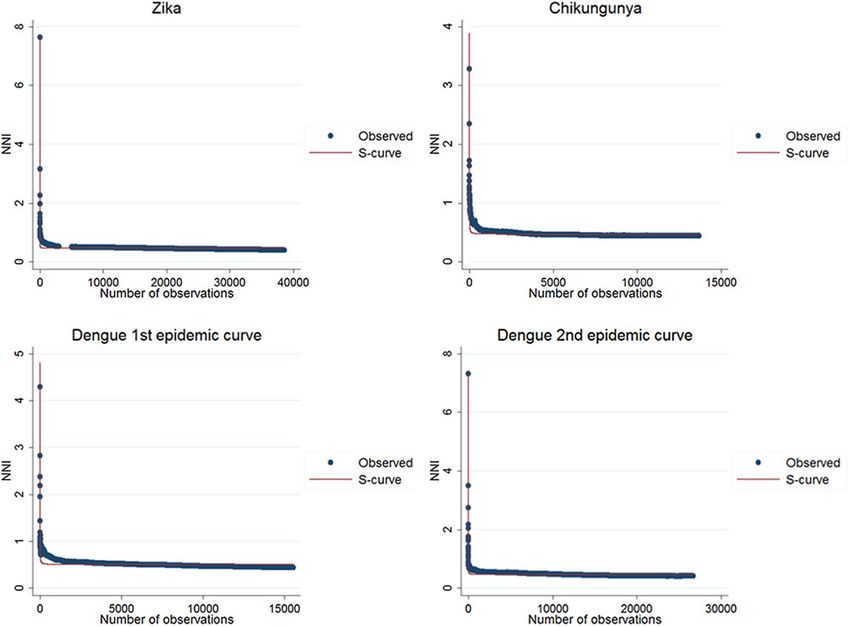
2                                                                                                                                         A. P. R. Dalvi and J. U. Braga

       provides information about the transmission dynamics of the dis-                          data. Third, the addresses geocoded by the Google Earth Pro
       ease, can support the planning of surveillance and control actions,                       API were included when data were still missing; lastly, the Bing
       and can be used to generate hypotheses for studies [15] and                               API was used for observations without coordinates. At the end
       ultimately reducing the risk of disease spread [16].                                      of this process, all reports of ZIKV, DENV and CHIKV infections
           Considering the occurrence and importance of the triple                               had coordinates. Then, an evaluation of the data that obtained
       epidemic in Brazil, the objective of this study was to identify                           duplicate coordinates was done. The observations that presented
       the spatial diffusion pattern of the diseases caused by ZIKV,                             a large number of duplications (>8) were geocoded by Batchgeo
       DENV and CHIKV in 2015–2016 in Rio de Janeiro, Brazil.                                    and incorporated after correction.

       Methods                                                                                   Spatial data analysis
       Study design                                                                              The point pattern data were analysed by the sequential kernel
                                                                                                 maps [20] and nearest-neighbour analysis regression [21]. The
       This study used two approaches: (a) a cross-sectional study of the                        area data were analysed by global autocorrelation correlogram
       point spatial data of cases in the city of Rio de Janeiro, Brazil, and                    using Moran’s I autocorrelation [22] and local autocorrelation
       (b) an ecological study of the incidence rate of the population of                        by analysing changes in the local indicators of spatial association
       the districts of Rio de Janeiro.                                                          (LISA) over time [23].
                                                                                                     The sequential kernel maps were made and analysed for
       Location, study period and data source                                                    every four epidemiological weeks (EW) for the three arboviruses
                                                                                                 according to the evolution stages of the epidemic curves
       The patterns of spatial diffusion of the three arboviruses were                           (Fig. 2). Analyses were performed for the following periods: EW
       studied in the municipality of Rio de Janeiro, Brazil, during the                         40 of 2015 to 39 of 2016, from EW 01 of 2015 to 40 of 2016
       2015–2016 epidemic. The municipality of Rio de Janeiro is located                         and from EW 44 of 2015 to 51 of 2016, for Zika, dengue and chi-
       in the southeast region of the country (latitude 22°54′ 10′′ S and lon-                   kungunya, respectively. The two dengue epidemics occurring in
       gitude 43°12′ 27′′ W) (Fig. 1). It has 1224.6 km2, with 48.6% of an                       the study period were analysed separately from EW 01 in 2015
       urbanised area, and 31.4% of forest cover and 2.1% of water bodies                        to 40 in 2015 for the first epidemic curve and from EW 41 in
       in the non-urbanised area. The map showing the land cover muni-                           2015 to 40 in 2016 for the second epidemic wave. The kernel
       cipality characteristics of urbanised and non-urbanised areas can                         density estimator is a smoothing technique that uses point data
       be found in the link http://www.data.rio/datasets/mapa-de-uso-                            and calculates the density of a given event per unit area, allowing
       do-solo-do-município-do-rio-de-janeiro-2016 [17].                                         the identification of hotspots (areas with a large number of
           Rio de Janeiro is the second most populous city in Brazil, with                       events), on the map [20]. When sequential maps for several
       a resident population of 6 320 446 and a density of 5265.82 inha-                         moments in time are made, it is possible to observe how the
       bitants per km2, according to the 2010 census. It presents 94.4%                          disease spreads over time in the study location. An exploratory
       of households with adequate sanitary sewage and 78.4% of urban                            analysis was performed for diffusion pattern detection. The
       households on public roads with adequate urbanisation (presence                           maps were made using QGIS Software version 2.18 and the
       of manhole, sidewalk, paving and curb) [18]. The HDI-M                                    Heatmap plugin [24].
       (Human Development Index of the municipality) is 0.799 [18],                                  The second technique was proposed by Lee et al. [21], in
       being 0.604 the lowest and 0.959 the highest HDI-M within the                             which the cumulative nearest-neighbour index (NNI) variation
       municipality [19].                                                                        is analysed when each point is added in time during the study
           Zika, dengue and chikungunya cases notified to the national                           period. In the analysis of the nearest-neighbour ratio, a compari-
       notifiable disease surveillance system (SINAN) of the Ministry                            son is made between the average distance observed between each
       of Health of Brazil in 2015 and 2016 were used. Individual records                        point and its nearest neighbours and the expected average dis-
       were obtained with authorisation. Cases confirmed by laboratory or                        tance in a situation of spatial randomness [25]. Lee et al. proposed
       clinical epidemiological criteria for each of the three arboviruses                       a technique in which the variation of the ratio of the nearest
       were included in the analysis.                                                            neighbour is first analysed when each point is added in time
           The digital maps by districts of the municipality of Rio de                           during the study period. The resulting curve of this variation is
       Janeiro were extracted from the site of the municipality of Rio                           then adjusted to a regression curve that best fits its distribution.
       de Janeiro (http://www.data.rio/). The populations living in the                          The distribution of the values in the graph is adjusted to a set
       neighbourhoods were estimated based on the 2010 census of                                 of mathematical curves constructed to identify which best fit
       the IBGE (Instituto Brasileiro de Geografia e Estatística) [18].                          this distribution. The best fit was evaluated by R 2, the determin-
                                                                                                 ation coefficient, and infers on the spatial diffusion model. In
                                                                                                 simulations, inverse or the S curves better fit expansion diffusion
       Geocoding
                                                                                                 patterns, while a cubic curve indicates a hierarchical diffusion pat-
       The residential addresses of Zika, chikungunya and dengue cases                           tern [21]. For the analysis of this statistic, the sp and SpatialEco
       were geocoded by Google Maps and Open Street Map (both by                                 packages of the R software were used.
       the QGIS Software MMQGIS plugin), Google Earth Pro, Bing                                      The global autocorrelation correlograms were calculated and
       and Batchgeo APIs. The coordinates resulting from Google                                  interpreted as described by Lam et al. [22]. The global Moran’s
       Maps API classified as good quality (coordinate identification                            I was used to represent the spatial autocorrelation of the incidence
       by street name and number) were initially included. Second, the                           rates. The spatial autocorrelation refers to the association of a
       coordinates obtained from the Open Street Map API that                                    variable with its location. The Moran’s I statistic varies from −1
       obtained the coordinates from the street name and number                                  to 1, where a statistic is positive when nearby areas have similar
       were used for observations with missing latitude and longitude                            attributes, negative when assigned values are not similar and

Downloaded from https://www.cambridge.org/core. IP address: 46.4.80.155, on 14 Dec 2020 at 02:06:05, subject to the Cambridge Core terms of use, available at https://www.cambridge.org/core/terms
. https://doi.org/10.1017/S0950268819001250
Epidemiology and Infection 3
Fig. 1. Maps of Brazil, and the State and Municipality of Rio de Janeiro, with divisions by planning regions and neighbourhoods. (a) Map of Brazil with divisions by
State. The State of Rio de Janeiro is indicated in grey. (b) Map of the State of Rio de Janeiro with divisions by the municipality. The municipality of Rio de Janeiro is
shown in grey. (c) Municipality of Rio de Janeiro with divisions by planning regions (colours) and by neighbourhoods (codes).
Code neighbourhood Ramos 147 Cosmos 113 Costa Barros
Centro 39 Manguinhos Madureira 114 Pavuna
1 Saude 40 Bonsucesso 72 Vila Kosmos 159 Parque Colombia
Downloaded from https://www.cambridge.org/core. IP address: 46.4.80.155, on 14 Dec 2020 at 02:06:05, subject to the Cambridge Core terms of use, available at https://www.cambridge.org/core/terms
. https://doi.org/10.1017/S09502688190012504 A. P. R. Dalvi and J. U. Braga
2 Gamboa 41 Ramos 73 Vic. de Carvalho Jacarepagua
3 Santo Cristo 42 Olaria 74 Vila da Penha 115 Jacarepagua
4 Caju 157 Maré 75 Vista Alegre 116 Anil
5 Centro Penha 76 Iraja 117 Gardenia Azul
6 Catumbi 43 Penha 77 Colegio 118 Cidade de Deus
7 Rio Comprido 44 Penha Circular 78 Campinho 119 Curicica
8 Cidade Nova 45 Bras de Pina 79 Quintino Bocaiva 120 Freguesia (Jpa)
9 Estacio 46 Cordovil 80 Cavalcanti 121 Pechincha
10 Sao Cristovao 47 Parada de Lucas 81 Engenheiro Leal 122 Taquara
11 Mangueira 48 Vigario Geral 82 Cascadura 123 Tanque
12 Benfica 49 Jardim America 83 Madureira 124 Praça Seca
13 Paqueta Inhauma 84 Vaz Lobo 125 Vila Valqueire
14 Santa Teresa 50 Higienopolis 85 Turiaçu Barra da Tijuca
158 Vasco da Gama 52 Maria da Graça 86 Rocha Miranda 126 Joa
161 Lapa 53 Del Castilho 87 Honorio Gurgel 127 Itanhanga
Zona Sul 54 Inhauma 88 Osvaldo Cruz 128 Barra da Tijuca
15 Flamengo 55 Engda Rainha 89 Bento Ribeiro 129 Camorim
16 Gloria 56 Tomas Coelho 90 Marechal Hermes 130 Vargem Pequena
17 Laranjeiras 156 Compdo Alemão Ilha do Governador 131 Vargem Grande
18 Catete Meier 91 Ribeira 132 Recreio dos Band
19 Cosme Velho 51 Jacare 92 Zumbi 133 Grumari
20 Botafogo 57 Sao Fran. Xavier 93 Cacuia Bangu
21 Humaita 58 Rocha 94 Pitangueiras 134 Deodoro
22 Urca 59 Riachuelo 95 Praia da Bandeira 135 Vila Militar
23 Leme 60 Sampaio 96 Cocota 136 Campo Afonsos
24 Copacabana 61 Engenho Novo 97 Banca¡rios 137 Jardim Sulacap
25 Ipanema 62 Lins de Vasc 98 Freguesia (Ilha) 138 Magalhaes Bastos
26 Leblon 63 Meier 99 Jardim Guanabara 139 Realengo
27 Lagoa 64 Todos os Santos 100 Jardim Carioca 140 Padre Miguel
28 Jrd. Botanico 65 Cachambi 101 Taua 141 Bangu
29 Gavea 66 Eng. de Dentro 102 Monero 142 Senador Camara
30 Vidigal 67 Agua Santa 103 Portuguesa 160 Gericino
31 Sao Conrado 68 Encantado 104 Galeao 162 Vila Kennedy
154 Rocinha 69 Piedade 105 Cidade Univ Santa Cruz
Tijuca 70 Aboliçao Pavuna 148 Paciencia
32 Pr. da Bandeira 71 Pilares 106 Guadalupe 149 Santa Cruz
33 Tijuca 155 Jacarezinho 107 Anchieta 150 Sepetiba
34 Alto da Boa V Campo Grande 108 Parque Anchieta Guaratiba
35 Maracana 143 Santissimo 109 Ricardo de Alb 151 Guaratiba
36 Vila Isabel 144 Campo Grande 110 Coelho Neto 152 Barra de Guar
37 Andarai 145 Sen Vasconcelos 111 Acari 153 Pedra de Guar
38 Grajau 146 Inhoaiba 112 Barros Filho
close to zero when the values are arranged randomly in space, on the Y-axis and spatial scale, or lag, is computed on the X-axis.
indicating spatial independence [22]. The spatial neighbourhood The spatial diffusion pattern is revealed in these diagrams. If the
condition was defined in this study by an adjacency matrix Wij. calculated correlograms show a decline as the lags move towards,
Spatial correlograms are diagrams showing spatial autocorrelation the spatial diffusion pattern indicated is expansion. Curves, which
Downloaded from https://www.cambridge.org/core. IP address: 46.4.80.155, on 14 Dec 2020 at 02:06:05, subject to the Cambridge Core terms of use, available at https://www.cambridge.org/core/terms
. https://doi.org/10.1017/S0950268819001250Epidemiology and Infection 5
Fig. 2. Zika, chikungunya and dengue epidemic curves for the Rio de Janeiro municipality in 2015 and 2016.
show a decline and, after some lags, an increase, presenting a ‘V’ Ethical aspects
shape, indicate a hierarchical diffusion process [22]. The spdep
This project was developed in accordance with the guidelines of
package in R Software was used to perform this analysis.
Resolution 466 of December 2012 and was submitted to the
Finally, the spatial diffusion pattern was also identified based
Ethics Committee of the National School of Public Health
on the analysis of LISA changes over time, as described by
Sérgio Arouca of FIOCRUZ and authorised by the CAAE
Cohen and Tita [23]. For this technique, the LISA was calculated
(no 85031718,2,0000,5240; Decision no 2,580,613 of 4 April
for every four EW, similar to those used in the Kernel analyses.
2018).
The local autocorrelation indicators for each observation indicate
spatial clusters of similar values around an observation. In this
way, the LISA will compare the incidence rate of a unit with
the average rate of its neighbours and tests if this similarity is Results
statistically significant. Statistical significance indicates spatial
Georeferencing
autocorrelation [26]. Cohen and Tita proposed in 1999 that the
spatial diffusion patterns could be detected by observing LISA First, duplications and observations of individuals with notifica-
changes over time [23]. Initially the LISA values for each pair, tion of residence outside the municipality of Rio de Janeiro
composed of a given site and its neighbours, were evaluated were removed. After georeferencing, localities outside of the
according to the occurrence of local agglomeration and the municipality were identified and excluded. Among the georefer-
occurrence of the pairs were identified according to the following enced observations, 573 cases of Zika, 156 cases of chikungunya
indications: LOW-LOW (LL), a location with an attribute and 501 cases of dengue were reported mainly among residents
value below the average and neighbours with values below the of Niterói and Baixada Fluminense municipalities, which neigh-
average; LOW-HIGH (LH), a location with an attribute value bour Rio de Janeiro city. Data with onset dates of symptoms out-
below the average and neighbours with values above the average; side the study period were also removed (Fig. 3). The proportion
HIGH-HIGH (HH), a location with an attribute value above of cases georeferenced by API is shown in Table 1.
the average and neighbours with values above the average; and Among ZIKV infections, 203 cases lacked a street name
HIGH-LOW (HL), a location with an attribute value above the and were georeferenced by neighbourhood, while 1283 lacked
average and neighbours with values below the average. This household information and were georeferenced by street name.
process was repeated for successive observations over time and Among CHIKV infections, 20 cases lacked a street name and
then the changes in the levels of spatial association between were georeferenced by the neighbourhood, while 292 lacked
each observation and its neighbours throughout the study period household information and were georeferenced by street name.
were verified. These changes indicate the pattern of spatial diffu- Chikungunya had the fewest duplications, was reported in
sion. GeoDa Software version 1.18.14 was used to perform this the communities of Rio de Janeiro and had a poor return in
analysis [27]. the Batchgeo.
Downloaded from https://www.cambridge.org/core. IP address: 46.4.80.155, on 14 Dec 2020 at 02:06:05, subject to the Cambridge Core terms of use, available at https://www.cambridge.org/core/terms
. https://doi.org/10.1017/S09502688190012506 A. P. R. Dalvi and J. U. Braga
Fig. 3. Georeferences of registered cases of ZIKV, CHIKV and
DENV infections in Rio de Janeiro.
Table 1. Geocoding methods for Zika, chikungunya and dengue cases
Zika Chikungunya Dengue
Geocoding methods N % N % N %
Google Maps 8116 21.0 2276 16.7 3912 9.2
Open Street Map 26 0.1 10 0.1 119 0.3
Google Earth Pro 22 827 59.1 9239 67.6 30 769 72.8
Bing 7397 19.2 2130 15.6 7425 17.6
Batchgeo 223 0.6 – – 32 0.1
TOTAL 38 589 100.0 13 655 100.0 42 257 100.0
Among DENV infections, 190 cases lacked a street name and the epidemic curve, with the intensity remaining high in the
were georeferenced by the neighbourhood, 59 lacked contain regions of Sepetiba, Rocinha and in the area that encompasses
street or neighbourhood name information and were georefer- the neighbourhoods of Flamengo, Catete, Santa Teresa, Rio
enced by the municipality, and 1074 lacked household informa- Comprido, Estácio and Tijuca. Increased intensity was also observed
tion and were georeferenced only by street name. in the regions of Penha, Santa Cruz districts, Copacabana and
Botafogo. Through all study period, the hotspot of Zika cases not
only remains in initial areas but also reached neighbouring areas,
Point data analysis
suggesting a putative expansion diffusion pattern.
Sequential Kernel maps were made for every four EW for each The sequential maps of chikungunya showed an increased
disease under study and analysed visually according to the regions intensity of cases beginning in EW 04 to 07 of 2016 mainly in
of the county (Figs 4–7). the area that included the neighbourhoods of the planning regions
Sequential maps of Zika showed a greater intensity of cases of Centro to Pavuna. Hotspots appeared in EW 12 to 15 EW in
among the 48 EW 2015 to 19 EW in 2016. From EW 48 to 51 2016 in the regions around Anchieta, Engenho Novo, Complexo
in 2015, hotspots were observed around the neighbourhoods of do Alemão and Centro. The highest numbers of cases occurred
the planning regions of Pavuna, Penha and Madureira. In the fol- in EW 16 to 19 in 2016, with hotspots in the same regions of
lowing weeks, areas with greater intensity emerged in Sepetiba, the previous weeks and increased intensity in the regions of
Praça Seca, Rocinha and the region encompassing the planning Bangu, Madureira and Penha. The propagation of cases restricted
region of Centro. EW 04 to 07 of 2016 comprised the peak of to certain areas suggested an expansion diffusion pattern.
Downloaded from https://www.cambridge.org/core. IP address: 46.4.80.155, on 14 Dec 2020 at 02:06:05, subject to the Cambridge Core terms of use, available at https://www.cambridge.org/core/terms
. https://doi.org/10.1017/S0950268819001250Epidemiology and Infection 7
Fig. 4. Sequential kernel maps of Zika cases from epidemiologic weeks 40 of 2015 to 39 of 2016.
The sequential maps for the first epidemic curve of dengue peak of the epidemic curve, hotspots were observed in the regions
showed a higher intensity of cases from EW 13 to 16 of 2015, of Realengo, Bangu, Vila Isabel, Engenho Novo, Centro regions
with moderate intensity in the region of Realengo and Vila and Penha to Inhaúma. In the following EW, the intensity of
Isabel. In EW 17 to 20 of 2015, the peak of the epidemic curve, hot- the cases decreased in almost all municipalities and was concen-
spots occurred in the region encompassing the neighbourhoods of trated only in the Bangu and Senador Camará regions. Jumps of
Bangu, Complexo do Alemão and Vila Isabel and, with less inten- case intensity were not observed, suggesting a diffusion pattern of
sity, in the Centre region. Visual analysis of the sequential kernel expansion.
maps referring to the first epidemic curve showed no disease The results of the nearest-neighbour regression analysis over
jumps, suggesting a diffusion pattern of expansion. time for Zika, chikungunya and the first and second dengue epi-
In the second epidemic curve of dengue, low intensity of cases demic curves performed as described by Lee et al. indicated an
was observed in the Penha region from EW 05 to 08 of 2016. This expansion type of diffusion pattern for all three diseases.
intensity increased in the following weeks, from EW 09 to 12 of Among the curves that indicated a spatial diffusion pattern, the
2016, from Penha to Bonsucesso. In EW 13 to 16 of 2016, the S-curve had the highest R 2 value (Table 2, Fig. 8).
Downloaded from https://www.cambridge.org/core. IP address: 46.4.80.155, on 14 Dec 2020 at 02:06:05, subject to the Cambridge Core terms of use, available at https://www.cambridge.org/core/terms
. https://doi.org/10.1017/S09502688190012508 A. P. R. Dalvi and J. U. Braga
Fig. 5. Sequential kernel maps of Chikungunya cases from epidemiologic weeks 44 of 2015 to 51 of 2016.
The results of LISA variations over time suggested a spatial the fifth spatial lag. In both plots of the two dengue epidemics,
diffusion pattern by the expansion of ZIKV and DENV infections there was a stabilisation of Moran’s I after the third spatial lag,
in both CE and a hierarchical pattern for CHIKV (Table 3). still suggestive of an expansion diffusion pattern (Fig. 9).
The correlograms for Zika, chikungunya and dengue showed a These techniques showed that the spatial diffusion pattern of
decline in Moran’s I, after the second spatial lag. The graph for the three arboviruses during the 2015–2016 epidemics matched
Zika and chikungunya showed that this pattern persisted until the expansion diffusion model.
Downloaded from https://www.cambridge.org/core. IP address: 46.4.80.155, on 14 Dec 2020 at 02:06:05, subject to the Cambridge Core terms of use, available at https://www.cambridge.org/core/terms
. https://doi.org/10.1017/S0950268819001250Epidemiology and Infection 9
Fig. 6. Sequential kernel maps for dengue for epidemiological weeks 01 of 2015 to 40 of 2015.
Discussion
epidemics in 2007, prior to the initiation of notifications for ZIKV
The spatial diffusion pattern of expansion for Zika, chikungunya infections [34].
and dengue was suggested by the results of the Kernel sequential A review of the case definitions in use when the Zika epidemic
maps, the NNI variation over time, spatial autocorrelation corre- arrived in Brazil concluded that they may have influenced the pro-
logram and the LISA changes over time for the municipality of blems in the classification of cases during the study period since
Rio de Janeiro in the 2015–2016 period. laboratory testing of all cases was not performed during the epi-
The study period comprised two epidemic waves of dengue demic. In 2017, Braga et al. suggested that the Zika case definition
because both occurred during the Zika and chikungunya epi- used by the Brazilian Ministry of Health did not present good spe-
demics. This approach enabled the study of the dengue diffusion cificity and sensitivity [35].
pattern in a scenario where there is an indication of problems in The underreporting of cases may have occurred because some
the classification of cases and to compare the two epidemics. Our ZIKV, DENV and CHIKV infections are asymptomatic [3] and
results indicate that there was no change in the diffusion patterns misclassification may be due to the similar initial clinical signs
in the two dengue waves studied and in the findings for Zika and and symptoms of the three arboviruses [36].
chikungunya. The sequential kernel maps revealed that some regions were
Several studies have reported problems related to the notifica- more affected by certain diseases than others. The regions close
tion of Zika, chikungunya and dengue cases in Brazil. Although to the neighbourhoods of Sepetiba and Rocinha had high inten-
the Ministry of Health of Brazil only reported cases of Zika sities of Zika cases and low intensities of the other two viruses.
from April 2015 [28], ZIKV was identified in Brazil in 2013 In contrast, the districts of Realengo, Padre Miguel and Bangu
[29, 30]. According to Brito et al., many Zika cases were reported had only high intensities of chikungunya and dengue cases in a
as dengue in 2015 [31] and, as suggested by Teixeira et al., many similar period of time, EW 12–20/2016. The northern region of
cases of chikungunya were reported as dengue in 2014 [32]. In the municipality is heavily affected by the three diseases and the
addition, the Brazilian Ministry of Health indicated the underre- area comprising the neighbourhood of Pavuna had the highest
porting of dengue cases [33]. The misclassification of cases was density of Zika cases, while the density of chikungunya was high-
also described in a study in Gabon, Central Africa, where the est in the region near Anchieta, neighbouring Pavuna the density
presence of ZIKV was identified during dengue and chikungunya of dengue was highest in Penha. The epidemic curves and the
Downloaded from https://www.cambridge.org/core. IP address: 46.4.80.155, on 14 Dec 2020 at 02:06:05, subject to the Cambridge Core terms of use, available at https://www.cambridge.org/core/terms
. https://doi.org/10.1017/S095026881900125010 A. P. R. Dalvi and J. U. Braga
Fig. 7. Sequential kernel maps for dengue for epidemiological weeks 41 of 2015 to 40 of 2016.
sequential kernel maps show an increase of CHIKV and DENV
cases when ZIKV cases begin to decline in EW 12 of 2016 (Figs
2 and 4–7). The analysis of sequential kernel maps suggested a
Table 2. Coefficients of determination of regression models for variation of the spatial diffusion by expansion for the three arboviruses.
ratio of the nearest neighbour over time for Zika, chikungunya and dengue, Rio A factor common to neighbourhoods with high case inten-
de Janeiro, 2015–2016 sities was a lower socio-economic level. A positive relationship
Disease Inverse curve Cubic curve S curve between low socio-economic level and high risk of dengue was
reported in the state of São Paulo [37] and Zika in the state of
Zika 0.462* 0.567* 0.986* Bahia [38].
Chikungunya 0.648* 0.569* 0.989* Sequential kernel maps are widely used in the studies of den-
gue in Brazil [39, 40, 41]. An expansion diffusion pattern was
Dengue 1st 0.478* 0.685* 0.984* reported by Barreto et al. in 2008 and Melo et al. in 2010 and a
epidemic curve
mixed pattern was suggested by Morato et al. in 2015 [41].
Dengue 2nd 0.550* 0.564* 0.984* Although kernel density maps are considered a visual analysis,
epidemic curve
this descriptive step is important for the initial observation of
*P-value < 0.001 the distribution of diseases in space and time. Considering its
Downloaded from https://www.cambridge.org/core. IP address: 46.4.80.155, on 14 Dec 2020 at 02:06:05, subject to the Cambridge Core terms of use, available at https://www.cambridge.org/core/terms
. https://doi.org/10.1017/S0950268819001250Epidemiology and Infection 11
Fig. 8. Best fit resulting curves generated by the nearest-neighbour variation over time for Zika, chikungunya and dengue.
Table 3. Frequency of changes in LISA autocorrelation indexes for Zika, chikungunya and dengue incidence rates in Rio de Janeiro neighbourhoods, 2015–2016
Dengue 1st epidemic Dengue 2nd
Zika Chikungunya curve epidemic curve
Pattern N % N % N % N %
Expansion 11 61 11 34 13 57 10 56
Hierarchical 7 39 21 66 10 43 8 44
Total 18 100 32 100 23 100 18 100
high subjectivity in the identification of spatial diffusion patterns, they interact and their social and transport connections [14].
more empirical methods were also used. Characteristics such as environmental and vector factors, network
The analysis of NNI variation over time, spatial autocorrel- connections and proportions of susceptible and infected indivi-
ation correlograms and changes of LISA over time suggested an duals should be further studied for a better understanding of
expansion spatial diffusion pattern for the three arboviruses, our findings. The importance of interactions through network
except for the LISA variation as a function of time for CHIKV, connections in the spatial diffusion process has been widely
which suggested a hierarchical pattern. Therefore, we indicate described [15, 42]. The region of the municipality of Rio de
an expansion diffusion pattern for the three arboviruses in the Janeiro is largely connected by highways and railways, favouring
context of the triple epidemic. This identification reveals the char- the expansion of the three arboviruses.
acteristics related to the disease dynamics. According to Cromley The characteristics of the sites of origin and destination of
and McLafferty [14], the expansion of a disease reflects a localised the transmission linked to the vector, population density and socio-
human interaction between an individual and their neighbours. In economic level are related to the factors related to the local trans-
this case, the vector population may also be connected. Similarly, mission and dispersion of ZIKV [43]. The main vector responsible
the hierarchical process reflects the movement of individuals, how for the transmission of the three arboviruses in Brazil, A. aegypti,
Downloaded from https://www.cambridge.org/core. IP address: 46.4.80.155, on 14 Dec 2020 at 02:06:05, subject to the Cambridge Core terms of use, available at https://www.cambridge.org/core/terms
. https://doi.org/10.1017/S095026881900125012 A. P. R. Dalvi and J. U. Braga
Fig. 9. Correlograms of the global Moran’s I for the incidence rates of Zika, chikungunya and dengue in Rio de Janeiro, 2015–2016.
can be coinfected by all three viruses and can transmit them sim- The existence of four serotypes of DENV was not considered
ultaneously. Ruckert et al. observed that mosquitoes coinfected in this study. Their differences related to symptomatology, patient
with ZIKV and CHIKV had a lower viral load of ZIKV compared immune response and consequent transmission potential may
to that of CHIKV [9]. This finding indicates the need for future generate differences in the diffusion pattern suggested as a result
studies to determine whether vector capacity may explain why cer- of this work.
tain regions are more affected by one virus than by another. The correlograms are graphs that demonstrate the behaviour of
The present study aimed to identify the diffusion pattern of spatial autocorrelations of the incidence rate (the variable used in
Zika, chikungunya and dengue in the context of the 2015–2016 tri- this study) to the lag of a neighbourhood order. The neighbour-
ple epidemic in the municipality of Rio de Janeiro. We also aimed hoods were defined by an adjacency matrix and the correlograms
to assess a model to identify the characteristics of the disease comprised five spatial lags, to the fifth-order neighbours. The
dynamics, to identify patterns for the perspective of prediction of analysis was performed assuming a greater number of spatial
a model in order to assist in the emergence of new hypotheses lags, with no change in the diffusion pattern. The results obtained
and to contribute to the elaboration of more accurate prevention using this method corroborated those reported in other studies.
programmes [13]. This project was not designed to assess the rele- The method based on LISA modifications returned a low pro-
vant patient immunological, vector, environmental or climatic fac- portion of frequencies with statistical significance and did not
tors to explain the model of transmission of these diseases. obtain a great difference in the frequencies to detect the spatial
An important limitation of this work is related to the quality of diffusion process for most diseases and should be interpreted
the georeferenced addresses. Some addresses were georeferenced with caution.
by only the street name, resulting in coordinates in the middle The analysis of the nearest neighbour with respect to time is
of a street. This occurred mainly in poor communities. In these considered the most formal analysis for the detection of spatial dif-
locations, there is often a main address with subdivisions in alleys, fusion patterns. The findings in this study of spatial diffusion by
houses and apartments. The APIs used and the individual search expansion corroborate that reported for dengue in Taiwan [21].
of these addresses could not capture this subdivision since it is not In conclusion, we suggest an expansion diffusion pattern for
an official division in the municipality. Clusters were observed in the Zika, chikungunya and dengue epidemics in the context of
the places where this occurred; thus, we concluded that there was the 2015–2016 triple epidemic in the city of Rio de Janeiro,
no influence on the results of the analyses. Brazil, as well as the sites most affected by the diseases. This
Downloaded from https://www.cambridge.org/core. IP address: 46.4.80.155, on 14 Dec 2020 at 02:06:05, subject to the Cambridge Core terms of use, available at https://www.cambridge.org/core/terms
. https://doi.org/10.1017/S0950268819001250Epidemiology and Infection 13
finding may help in the elaboration of a more effective control 19. Programa das Nacoes Unidas para o desenvolvimento, Instituto de
programme as well as the elaboration of new studies to fill gaps Pesquisa Economica Aplicada, Fundacao Joao Pinheiro (2014) Atlas
in the dynamics of the three arboviruses. do Desenvolvimento Humano nas Regiões Metropolitanas Brasileiras. –
Brasília: PNUD, Ipea, FJP. p. 120.
Author ORCIDs. J. U. Braga, 0000-0001-5247-007X. 20. Bailey TC and Gatrell AC (1995) Interactive Spatial Data Analysis.
Harlow: Longman, p. 413.
Acknowledgements. We thank the Department of communicable disease 21. Lee J et al. (2014) An experiment to model spatial diffusion process with
Surveillance of the Brazilian Ministry of Heath for the availability of surveil- nearest neighbor analysis and regression estimation. International Journal
lance data. of Applied Geospatial Research 5, 1–15.
22. Lam NS-N, Fan M and Liu K (1996) Spatial-temporal spread of the AIDS
Financial support. This study was financed in part by the Coordenação de epidemic, 1982–1990: a correlogram analysis of four regions of the United
Aperfeiçoamento de Pessoal de Nível Superior - Brasil (CAPES) - Finance States. Geographical Analysis 28, 93–107.
Code 001. APRD was supported by a doctoral fellowship from the Escola 23. Cohen J and Tita G (1999) Diffusion in homicide: exploring a general
Nacional de Saúde Pública Sergio Arouca of Fundação Oswaldo Cruz. method for detecting spatial diffusion processes. Journal of Quantitative
Criminology 15, 451–493.
Conflict of interest. None.
24. QGIS Development Team (2009) QGIS Geographic Information System.
Open Source Geospatial Foundation Project. doi: http://qgis.osgeo.org.
25. Rossbacher L (1986) Nearest neighbor analysis: a technique for quantita-
References
tive evaluation of polygonal ground patterns. Geografiska Annaler 68A,
1. Taylor LH, Latham SM and Woolhouse ME (2001) Risk factors for 101–105.
human disease emergence. Philosophical Transactions of the Royal 26. Anselin L (1995) Local indicator of spatial association – LISA.
Society of London. Series B, Biological Sciences 356, 983–989. Geographical Analysis 27, 93–115.
2. Jones KE et al. (2008) Global trends in emerging infectious diseases. 27. Anselin L (2016) GeoDa 1.8.14 User’s guide. Spatial Analysis Laboratory
Nature 451, 990–993. (SAL): Department of Agricultural and Consumer Economics, University
3. Ioos S et al. (2014) Current Zika virus epidemiology and recent of Illinois, Urbana-Champaign, IL.
epidemics. Médecine Et Maladies Infectieuses 44, 302–307. 28. Ministério da Saúde do Brasil (2017) Boletim Epidemiológico –
4. Cauchemez S et al. (2016) Association between Zika virus and microceph- Monitoramento dos casos de dengue, febre de chikungunya e febre pelo
aly in French Polynesia, 2013-15: a retrospective study. Lancet 387, 2125– vírus Zika até a Semana Epidemiológica 52, 2016.
2132. 29. Metsky HC et al. (2017) Zika virus evolution and spread in the Americas.
5. de Araújo TVB et al. (2018) Association between microcephaly, Zika Nature 546, 411–415.
virus infection, and other risk factors in Brazil: final report of a case- 30. Passos SRL et al. (2017) Detection of Zika virus in April 2013 patient
control study. The Lancet Infectious Diseases 18, 328–336. samples, Rio de Janeiro, Brazil. Emerging Infectious Disease Journal 23,
6. Rodriguez-Morales AJ (2015) Zika: the new arbovirus threat for Latin 2120.
America. Journal of Infection in Developing Countries 9, 684–685. 31. Brito CAAD and Cordeiro MT (2016) One year after the Zika virus out-
7. Ministério da Saúde do Brasil (2014) Preparação e resposta à introdução break in Brazil: from hypotheses to evidence. Revista da Sociedade
do vírus Chikungunya no Brasil. Brasilia: Ministerio da Saude, 2014, pp. 100. Brasileira de Medicina Tropical 49, 537–543.
8. Rigau-Perez JG et al. (1998) Dengue and dengue haemorrhagic fever. 32. Teixeira MG et al. (2015) East/Central/South African genotype Chikungunya
Lancet 352, 971–977. virus, Brazil, 2014. Emerging Infectious Disease Journal 21, 906.
9. Ruckert C et al. (2017) Impact of simultaneous exposure to arboviruses 33. Silva MMO et al. (2016) Accuracy of dengue reporting by National
on infection and transmission by Aedes aegypti mosquitoes. Nature Surveillance System, Brazil. Emerging Infectious Diseases 22, 336–339.
Communications 8, 15412. 34. Grard G et al. (2014) Zika virus in Gabon (Central Africa) – 2007: a new
10. Pan American Health Organization, World Health Organization. threat from Aedes albopictus? PLoS Neglected Tropical Diseases 8, e2681.
Epidemiological Update, Zika Virus Infection, 16 October 2015. Available 35. Braga JU et al. (2017) Accuracy of Zika virus disease case definition dur-
at http://www.paho.org/hq/index.php?option=com_docman&task=doc_ ing simultaneous Dengue and Chikungunya epidemics. PLoS ONE 12,
view&Itemid=270&gid=32021=en&lang=en (Accessed 06 May 2018). e0179725.
11. World Health Organization. Situation Report. Zika virus microcephaly, 36. Paixao ES, Teixeira MG and Rodrigues LC (2018) Zika, chikungunya
Guillain-Barre syndrome, January 05, 2017. Available at http://apps.who.int/ and dengue: the causes and threats of new and re-emerging arboviral dis-
iris/bitstream/10665/252762/1/zikasitrep5Jan17-eng.pdf?ua=1 (Accessed 14 eases. BMJ Global Health 3(suppl. 1), e000530.
May 2018). 37. Farinelli EC et al. (2018) Low socioeconomic condition and the risk of
12. Fletcher-Lartey SM and Caprarelli G (2016) Application of GIS technol- dengue fever: a direct relationship. Acta tropica 180, 47–57.
ogy in public health: successes and challenges. Parasitology 143, 401–415. 38. Netto EM et al. (2017) High Zika virus seroprevalence in Salvador,
13. Cliff AD et al. (1981) Spatial Diffusion: An Historical Geography of Northeastern Brazil limits the potential for further outbreaks. Mbio 8,
Epidemics in an Island Community. Cambridge: Cambridge University e01390–17.
Press, p. 248. 39. Barreto FR et al. (2008) Spread pattern of the first dengue epidemic in the
14. Cromley EK and Mclafferty SL (2012) GIS and Public Health. New York: city of Salvador, Brazil. BMC Public Health 8, 51.
The Gilford Press, p. 503. 40. Melo MSS et al. (2010) Progression of the dengue virus circulation in the
15. Cliff AD and Hagget P (1989) Spatial aspects of epidemic control. state of Bahia, 1994–2000 [in Portuguese]. Revista da Sociedade Brasileira
Progress in Human Geography 13, 315–347. de Medicina Tropical 43, 139–144.
16. Murthy S, Keystone J and Kissoon N (2013) Infections of the developing 41. Morato DG et al. (2015) The spatiotemporal trajectory of a dengue epi-
world. Critical Care Clinics 29, 485–507. demic in a medium-sized city. Memorias do Instituto Oswaldo Cruz
17. Prefeitura do Municipio do Rio de Janeiro. Available at https://www. 110, 528–533.
data.rio/datasets/mapa-de-uso-do-solo-do-município-do-rio-de-janeiro-2016 42. Saint-Julien T (2007) The process of spatial diffusion and modeling
(Accessed 04 April 2019). change. In Sanders L (ed.), Models in Spatial Analysis. New York: Wiley,
18. Instituto Brasileiro de Geografia e Estatistica (2011) Censo demográfico pp. 127–158.
2010. Características da população e dos domicílios: resultados do uni- 43. Gardner LM et al. (2018) Inferring the risk factors behind the geograph-
verso. Rio de Janeiro: IBGE. Available at https://cidades.ibge.gov.br/bra- ical spread and transmission of Zika in the Americas. PLoS Neglected
sil/rj/rio-de-janeiro/panorama (Accessed 30 March 2019). Tropical Diseases 12, e0006194.
Downloaded from https://www.cambridge.org/core. IP address: 46.4.80.155, on 14 Dec 2020 at 02:06:05, subject to the Cambridge Core terms of use, available at https://www.cambridge.org/core/terms
. https://doi.org/10.1017/S0950268819001250You can also read