Explainable DCNN based chest X ray image analysis and classification for COVID 19 pneumonia detection - Nature
←
→
Page content transcription
If your browser does not render page correctly, please read the page content below
www.nature.com/scientificreports
OPEN Explainable DCNN based
chest X‑ray image analysis
and classification for COVID‑19
pneumonia detection
Jie Hou1 & Terry Gao2*
To speed up the discovery of COVID-19 disease mechanisms by X-ray images, this research developed
a new diagnosis platform using a deep convolutional neural network (DCNN) that is able to assist
radiologists with diagnosis by distinguishing COVID-19 pneumonia from non-COVID-19 pneumonia
in patients based on chest X-ray classification and analysis. Such a tool can save time in interpreting
chest X-rays and increase the accuracy and thereby enhance our medical capacity for the detection
and diagnosis of COVID-19. The explainable method is also used in the DCNN to select instances of the
X-ray dataset images to explain the behavior of training-learning models to achieve higher prediction
accuracy. The average accuracy of our method is above 96%, which can replace manual reading and
has the potential to be applied to large-scale rapid screening of COVID-9 for widely use cases.
Abbreviations
AI Artificial intelligence
BCNN Bayesian convolutional neural network
CNN Convolutional neural network
COVID Coronavirus disease
CXR Chest x-ray
DCNN Deep convolutional neural network
FCN Fully convolutional network
GPU Graphics processing unit
NMS Nonmaximal suppression
ReLUs Rectified linear units
Coronaviruses are a large family of viruses that cause illness ranging from the common cold to more severe
diseases, such as Middle East Respiratory Syndrome (MERS-CoV) and Severe Acute Respiratory Syndrome
(SARS-CoV)1. This novel coronavirus (COVID-2019)2–4 is a new strain not previously identified in humans. A
common clinical feature of severe COVID-19 infection is p neumonia5–8. Chest X-rays are a useful diagnostic tool
for assessing various lung diseases, such as pneumonia, but the interpretation of the images can be challenging
and time consuming by a rtificial9,10.
Part of the challenge is distinguishing between normal tissue and disease processes, a skill that must be learned
through experience, particularly for some illnesses such as pneumonia where the difference is less obvious.
With a great number of patients having chest X-rays taken as part of the diagnostic examination of suspected
pneumonia each year at hospital alone, the evaluation of X-rays consumes a considerable number of resources.
Machine learning technology is currently being implemented in various sub-fields of medicine, including
diagnostics, bioinformatics and educations. A convolutional neural network (CNN) is a deep machine learning
algorithm11 that can be implemented in medical image classification and analysis to support speedy and correct
decision making12–15. Also, computational models in IT and Intelligent Analytics have been significantly used
in solving problems related to medical imaging16,17 and general COVID-19 healthcare monitoring systems18,19.
Since the onset of the pandemic, many researchers have shown the effectiveness of using radiology images in
identifying COVID-19 infection with various deep learning techniques. The general idea is that a set of medical
images with category tags is used to train a deep learning CNN that is able to distinguish between noise and
1
School of Biomedical Engineering, Guangdong Medical University, Dongguan, Guangdong, China. 2Counties
Manukau District Health Board, Auckland 1640, New Zealand. *email: terrygao366@gmail.com
Scientific Reports | (2021) 11:16071 | https://doi.org/10.1038/s41598-021-95680-6 1
Vol.:(0123456789)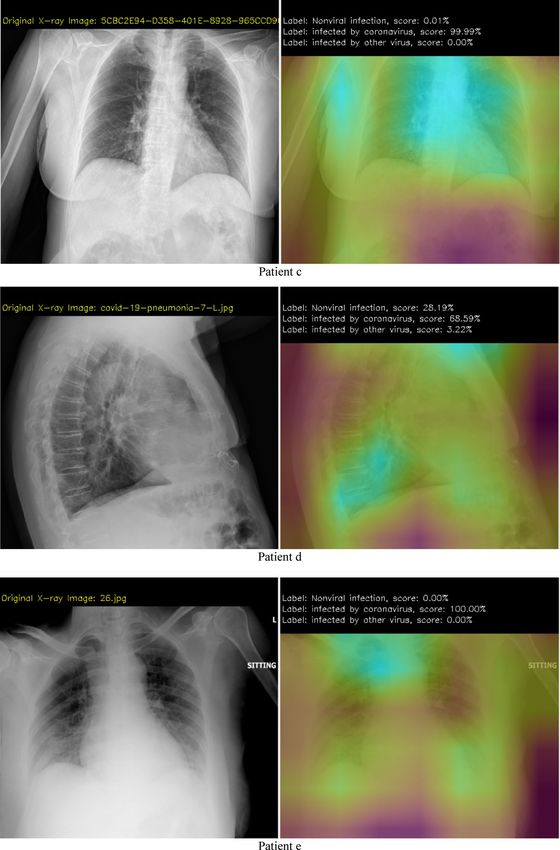
www.nature.com/scientificreports/
useful diagnostic information20–23. Recently, there has been a growing interest in developing COVID-19 diag-
nosis system by using deep learning techniques on well-known data sets used to train these networks24–26, also
fusion LSTM network models and explicitly recurrent neural networks (RNN) are combined with CNN together
to make superior predictions and to achieve promising performance. Islam MZ et al.27 introduced a combined
deep CNN-LSTM network to estimate the uncertainty and interpretability in the detection of coronavirus; in
their system, CNN was used for deep feature extraction and LSTM was used for detection using the extracted
feature. The collection of 4575 X-ray images in the research, including 1525 images of COVID-19, were used as
a dataset in this system, and the system achieved an accuracy of 99.4%. Prottoy Saha et al.28 developed an auto-
mated COVID-19 diagnosis from X-ray Images using CNN and Ensemble of Machine Learning Classifiers; in
their research, a convolutional neural network was developed focusing on the simplicity of the model to extract
high-level features from X-ray images of patients and binary machine learning classifiers (random forest, support
vector machine, decision tree, and AdaBoost) were developed for the detection of COVID-19, and last these
outputs were combined to develop an ensemble of classifiers, the method can achieve 98.91% accuracy. Islam
et al.29 use a combined architecture of convolutional neural network (CNN) and recurrent neural network (RNN)
to diagnose COVID-19 from chest X-rays, and gradient-weighted class activation mapping (Grad-CAM) was
also used to visualize class specific regions of images that are responsible to make decision. All these are good
methods for COVD-19 infection detection, but as combined different complex neural networks, it needs much
more hardware resources and real-time processing is also a challenge issue.
The trained CNN is capable of interpreting new images by recognizing patterns that indicate certain diseases
in the individual images. In this way, it imitates the training of a doctor, but the theory is that since it is capa-
ble of learning from a far larger set of images than any human, the CNN approach has more accurate results.
Ghoshal et al.3 introduced a deep learning-based technique to estimate the uncertainty and interpretability in
the detection of coronavirus. The authors have used a Bayesian Convolutional Neural Network (BCNN) and
publicly available COVID-19 CXR images and found that the prediction uncertainty is extremely correlated with
prediction accuracy. The performance results demonstrate an improvement in detection accuracy from 85.2% to
92.9% using pretrained VGG-16 model. They have also illustrated model interpretability by generating saliency
maps to facilitate a better understanding of the results obtained by the proposed model. Narin et al.5 presented a
transfer learning-based approach to the classification of CXR images into COVID-19 and normal categories. They
have used three pretrained models such as InceptionV3, ResNet50, and InceptionResNetV2 in their system and
achieved the highest 98% accuracy with ResNet50 for binary classification. However, the number of COVID-19
images in the curated dataset is only 50.
Singh et al. proposed an automated COVID-19 screening model30 is implemented by ensembling the deep
transfer learning models such as Densely connected convolutional networks (DCCNs), ResNet152V2, and
VGG16, and it has good performance in terms of accuracy, f-measure, area under curve, sensitivity, and speci-
ficity, but the sample is mainly for CT images. Singh et al. also developed an automated analysis method31 which
can save the medical professionals’ valuable time, and the method outperforms the competitive machine learn-
ing models in terms of various performance metrics without needing a lot of training sets. Gianchandani et al.
proposed two different ensemble deep transfer learning models32 which have been designed for COVID-19
diagnosis utilizing the chest X-rays. Both models have utilized pre-trained models for better performance, and
can differentiate COVID-19, viral pneumonia, and bacterial pneumonia.
A pilot study using publicly available chest X-rays of no pneumonia patients and patients with coronavirus
should promise in that it is possible to train a CNN to distinguish between these two groups with approximately
90% high a ccuracy33. In addition, there is the potential to distinguish viral from bacterial pneumonia, which is
particularly relevant to COVID-19 infection because pneumonia is directly associated with the virus rather than
a bacterial complication. A Bayesian Convolutional Neural Network (BCNN) technique for estimating infec-
tion of coronavirus was i ntroduced34. The accuracy of the method is around 90%. A transfer learning approach
was used to classify the CXR images for COVID-19 detection, and the CNN models including InceptionV3,
ResNet50, and InceptionResNetV2, however, the samples of COVID-19 images were very limited, and the per-
formance was influenced35.
The research content of this paper is that a set of X-ray medical lung images with category tags used to train
a two tiers CNN called DCNN, which can distinguish normal, coronavirus infection, COVID-19 and other
virus infection. We have proposed a system which combines two deep learning based CNN model that exploits
the benefit of a weighted average of the model weights. The first CNN is used for (Normal, infected by bacteria,
infected by Virus) detection, and the outputs (infected by Virus) of the first Convolutional Neural Network are
used as input of the second Convolutional Neural Network to obtain a robust classification of these images into
COVID-19, normal, and other virus pneumonia categories. Such a tool could increase the speed and accuracy
of interpreting and thereby improve the overall treatment of patients, also reduce the resource demanding which
is useful for COVID-19 disease detection.
Design and methods
Study design and type. This research built a diagnostic system that uses open-to-public coronavirus infec-
tor chest X-ray images from36 for training. The historical data are split into a training and a validation set, which
are composed of three samples of normal, coronavirus infection and virus infection. The CNN is then trained
on the training set and the predictive value of the tool, once trained, and determined by using the validation set.
Tests of what parts of the images by which the CNN uses to determine the output are explored to ensure that the
output is clinically relevant. After this initial analysis, an extraction of massive texture features was applied and
can serve to provide additional information for the diagnosis of COVID-19.
Scientific Reports | (2021) 11:16071 | https://doi.org/10.1038/s41598-021-95680-6 2
Vol:.(1234567890)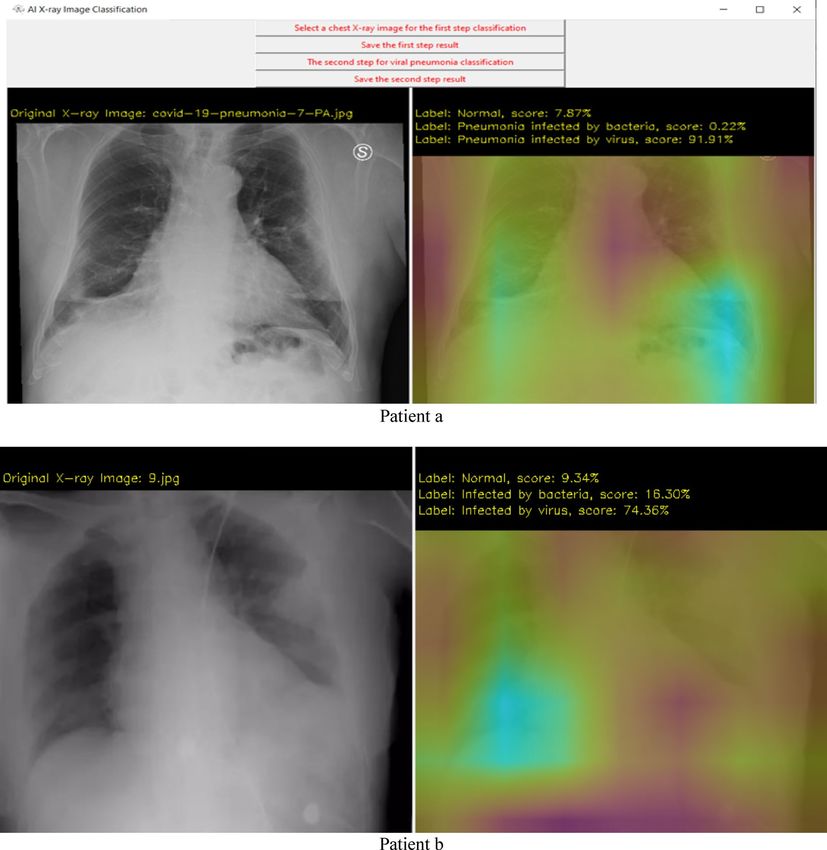
www.nature.com/scientificreports/

                                  Participants. The training of the CNN needs to have non pneumonia and pneumonia representing X-rays
                                  that are alike in all other aspects that may influence how an X-ray looks, so the deep CNN is trained to look at
                                  the actual difference based on the presence of pneumonia and no other factors associated with pneumonia. Since
                                  a patient who is diagnosed and treated in-house has at least an X-ray to diagnose the condition and an X-ray to
                                  confirm that the pneumonia is gone, we have X-rays from the same patient with and without pneumonia. For
                                  this reason, the training set is a random selection of patients. The chest X-rays used are the first X-ray taken of
                                  the patient during the admission from the moment a pneumonia was suspected, and the last X-ray taken before
                                  discharge. Both X-rays taken used the same position of the patient (standing/lying in bed).

                                  Platform design and the outcomes. For each record in the validation set, the following outcomes are
                                  collected:

                                  • Diagnosis as determined by the trained CNN
                                  • Gold standard diagnosis, as determined by radiologist and confirmed by discharge department.
                                  • If an X-ray as determined not to show pneumonia but clinical diagnosis shows pneumonia, then at least one
                                    other X-ray of that admission episode should have shown pneumonia. If either of these two criteria is not
                                    met, then the X-ray is determined by showing pneumonia.
                                  • If an X-ray was determined to show pneumonia, then the clinical diagnosis result had to show pneumonia;
                                    otherwise, it was determined not to show pneumonia.

                                  Sample size calculations. The training data size depends on the complexity of the CNN model, such as
                                  the number of inputs/outputs, the relationships between parameters, the noise in the data, and the variance and
                                  standard deviation of every parameter, so the best approach is to ensure that our data cover all the ranges we
                                  want for all parameters. Normally, the number of samples is at least 10 times more than the number of CNN
                                  training parameters, so we initially set the training samples to approximately 1400 chest X-ray images, which
                                  include 400 normal images, 400 pneumonia infected by bacteria images, 400 pneumonia infected by other virus
                                  images, and 200 pneumonia infected by COVID-19 images. Testing samples are 400 chest X-ray images (100
                                  images for each class). 100 chest X-ray images are used for validation, which also include 50 COVID-19 infec-
                                  tion images.

                                  Ethics approval and consent to participate. The research is approved by Guangdong Medical Univer-
                                  sity and CMDHB. We only use the historical on-line data and X-ray images. There will be no interaction with
                                  or impact on patients.

                                  Implementation procedure
                                  The theoretical basis of the algorithm. The primary step of this research is a deep CNN designed
                                  and trained to assist radiologists with diagnosis by distinguishing COVID-19 pneumonia from non-COVID-19
                                  pneumonia in patients at hospital with high predictive values using clinically relevant parts of the images. Then,
                                  this deep CNN is used to distinguish bacterial from viral pneumonia amongst those patients with pneumonia at
                                  hospital with high predictive values using clinically relevant parts of the images. The CNN is designed based on
                                  VGG-1937 which is a variant of VGG model which in short consists of 19 layers (16 convolution layers, 3 Fully
                                  connected layer, 5 MaxPool layers and 1 SoftMax layer as in Fig. 1 and reduced the levels, changing the convo-
                                  lutional kernels to make it more feasible.
                                      The new structure of DCNN is designed as: let x be set as the input vector, ϕi is the radial basis function, N is
                                  the number of input training samples, and y is the output of the neural network, a new method which measures
                                  the similarity between the test images and the ground truth images to improve the detection robust of the system.
                                                                                  y = W(N)φ(x(N))                                                  (1)
                                      Then, d(n) is the output response of the n iterations of the neural network, and the error is defined as:
                                                                     e(n) = d(n) − y(n) = d(n) − W(n)φ(x(n))                                       (2)
                                  and the objective function as:
                                                                              1 2      1
                                                                     J(n) =     e (n) = [d(n) − W(n)φ(x(n))]2                                      (3)
                                                                              2        2
                                  and to the weight is updated according to:
                                                                           �w(n + 1) = (n + 1) − �w(n)                                             (4)
                                  According to the gradient descent with the momentum algorithm, I can obtain:
                                                                                                  α
                                                                       �w(n + 1) = γn �w(n) − ηc Dw(n) J(n)                                        (5)
                                  where η is the learning rate, 0 < α < 1, 0 < γ < η, γ is the momentum factor, and γn is the momentum coef-
                                  ficient designed as follows:

Scientific Reports |   (2021) 11:16071 |               https://doi.org/10.1038/s41598-021-95680-6                                                    3

                                                                                                                                                Vol.:(0123456789)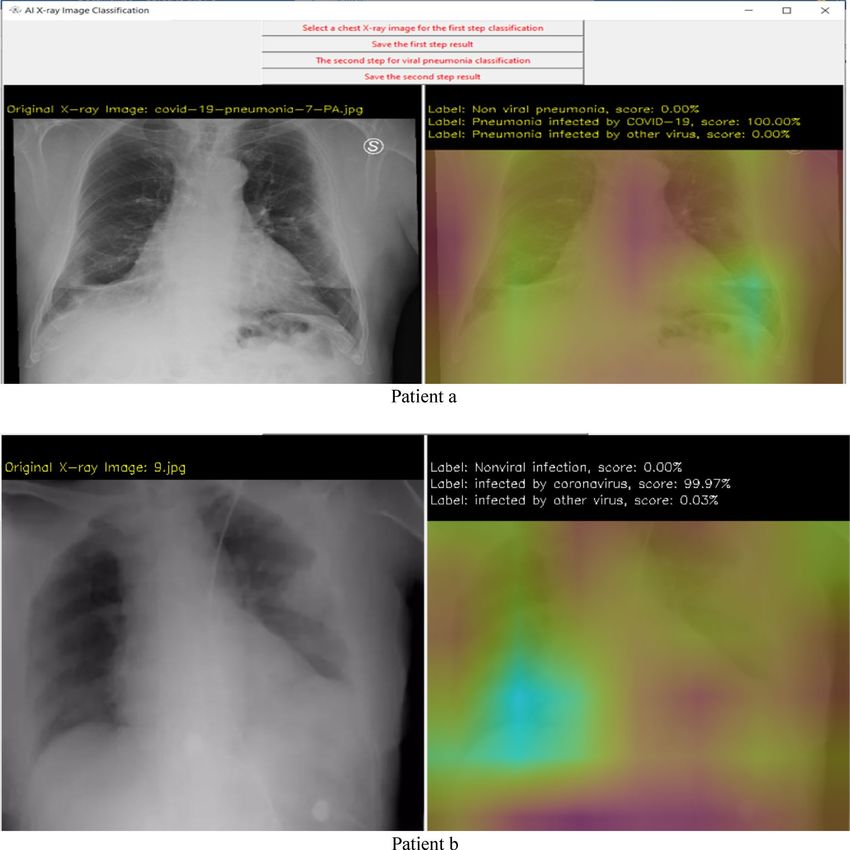
www.nature.com/scientificreports/
Figure 1. VGG-19 structure.
α J(n)�
γ �c Dw(n)
��w(n)� �= 0
γn = ��w(n)� (6)
0 else
|| · || is the Euclidean normalization. According to the definition of the fractional derivative, the output result as:
N ′ (w i (n) − c)1−α
(7)
y= Jj (wφ xj (n) )φ(xj (n))
j=1 (1 − α)Ŵ(1 − α)
For given parameters a, b, and c in CNN model, the neural network is used to obtain the enhanced image by
searching the optimal objective function E:
2
∇ x I ∇ y I +c �∇x R�1 + �∇y R� + �I − max maxSc �2 (8)
E = �IR − S�2 +a
� ∇x I
+b
� ∇y I 1 2
|�| + ε |�| + ε
Then the class similarity is computed as an image quality evaluation index, which measures the similarity
between the test images and the ground truth image:
SSIM(x, y) = l(x, y) u(x, y)β s(x, y)µ (9)
The proposed algorithm: DCNN. Based on the above application background and theoretical basis, this
section introduces the proposed DNN framework, which is shown in Fig. 2. The DCNN is divided into two
training levels. One innovation of our system is that two separate CNN are used for different categories detec-
tion, and the input of the second CNN is form one stream output of the first CNN.
• First, the first CNN-1is trained by inputting the training samples with category labels, all the unknown
parameters of CNN-1 are obtained, and the CNN-1 is valid by the validation data set.
• Then, CNN-1 is used to determine the test samples to separate out the standard set, the virus infection set
and the bacterial infection set.
• Third, the virus infection output set is labelled for the CNN-2, which has three categories of normal, COVID-
19 and other virus infection. So, the second CNN-2 is trained to obtain all the unknown parameters and the
CNN-2 is valid by the validation set; Finally, CNN-2 is used to determine the final test samples to separate
out the standard set, other virus infection set, and COVID-19 set.
Training the DCNN. The convolution layers have a hierarchical structure and are core building blocks of
a CNN38. The DCNN applying individual network levels and rapid combinations of features take place before
the forecasting stage. The input of the first convolution layer is the input space, and the output is the feature
map. The input and output of the next convolutional layers are feature maps of the input space. The number of
convolutional layers is set by the programmer. The set of feature maps is obtained as the output of convolutional
layers. The complex features of the input space are represented by using the stacked hierarchical structure of
Scientific Reports | (2021) 11:16071 | https://doi.org/10.1038/s41598-021-95680-6 4
Vol:.(1234567890)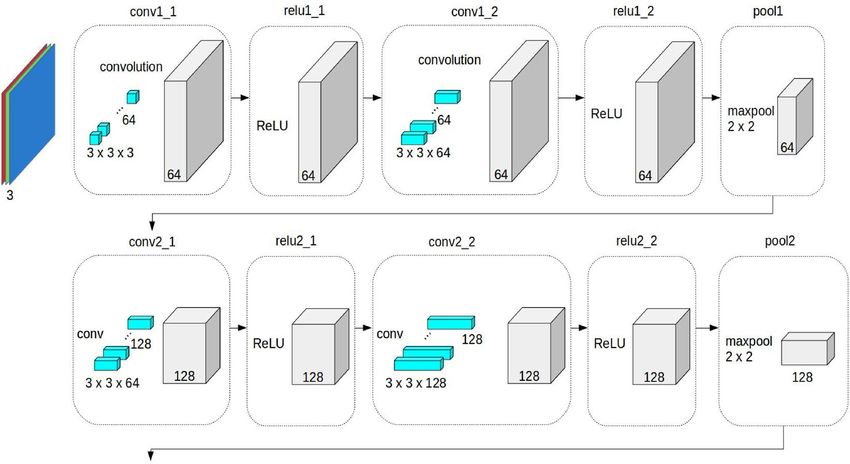
www.nature.com/scientificreports/

                                  Figure 2.  The execution framework of the proposed DCNN.

                                  convolutional layers. The obtained features from the convolutional layers are fed to the pooling layer. An activa-
                                  tion function such as ReLU is applied to the obtained feature map. In this layer, the relevant features are retained,
                                  and the rest are discarded. A dropout layer with a dropout factor of 0.5 has also been used for the regularization
                                  of the model. Then, the feature maps of the corresponding depths of the contraction path are fed as input. The
                                  obtained features are transformed into a one-dimensional array called the feature vector. The feature vector is
                                  a one-dimensional array and is the input for the fully connected layer. The fully connected layer calculates the
                                  output of the CNN.
                                      The regression branch predicts the distances from the center of each grid to the four sides of the bounding
                                  box. Centeredness is a coefficient in the range of [0,1] for each grid. The farther the grid center is from the object
                                  center, the smaller the coefficient is. The centeredness and class are multiplied and then serve as the input of
                                  nonmaximal suppression (NMS). The sclera block is similar to a fully convolutional network (FCN), where the
                                  input feature map is unsampled 4 times to obtain a score map. After these operations using the ReLU activation
                                  function, the nonlinear transformation of signals is performed for each matrix. The obtained results are sent to
                                  the pooling layer. In this layer for each cell, the max (or average) pooling operations are performed. In the pool-
                                  ing layer, down sampling operations have been performed to reduce the size of the feature matrix derived from
                                  the convolution layer. After training, the class index is used to measure the class activation map, and the layers
                                  can be used when visualizing the class activation map. The CNN gradient model is constructed by supplying
                                  the inputs of the pretrained model and the output of the final layer in the network. The average of the gradient
                                  values is computed by using connection Weights, and the ponderation of the filters is computed with respect to
                                  the Weights, so the connection heatmap can be formed and normalized such that all values are set in the range [0,
                                  1], and the resulting values can be scaled to the range [0, 255] to finally show the regions of interest with bright
                                  color that can be used for medical purpose analysis. Details are as in Table 1. Also, the results from the output
                                  categories can then be averaged (or otherwise combined) to produce a single estimation, and the advantage of
                                  this method is that all observations are used for both training and validation, and each observation is used for
                                  validation exactly once.
                                      The first convolutional layer learns 32 convolutional filters, each of which is 3 × 3. Then, rectified linear units
                                  (ReLUs) are applied as an activation function that has output 0 if the input is less than 0 and output otherwise.
                                  The following layers use similar processing. The fully connected layer uses SoftMax for the activation function.
                                      As tuning the hyperparameters of CNN is very critical in obtaining a high-accuracy model, “grid search”39
                                  by sampling various hyperparameters from a distribution is used in the CNN. It starts by defining a set of all
                                  hyperparameters and the associated values which want to be explored, then examines all combinations of these
                                  hyperparameters. For each possible combination of hyperparameters, a model is trained on them and the hyper-
                                  parameters associated with the highest accuracy are then returned. The learning rate grid is [0.1, 0.01, 0.001],
                                  Dropout rate grid is [0.2, 0.3, 0.5], Batch size grid is [8, 32, 64], and Epoch’s grid to train is [60, 120, 180].

Scientific Reports |   (2021) 11:16071 |               https://doi.org/10.1038/s41598-021-95680-6                                                      5

                                                                                                                                                  Vol.:(0123456789)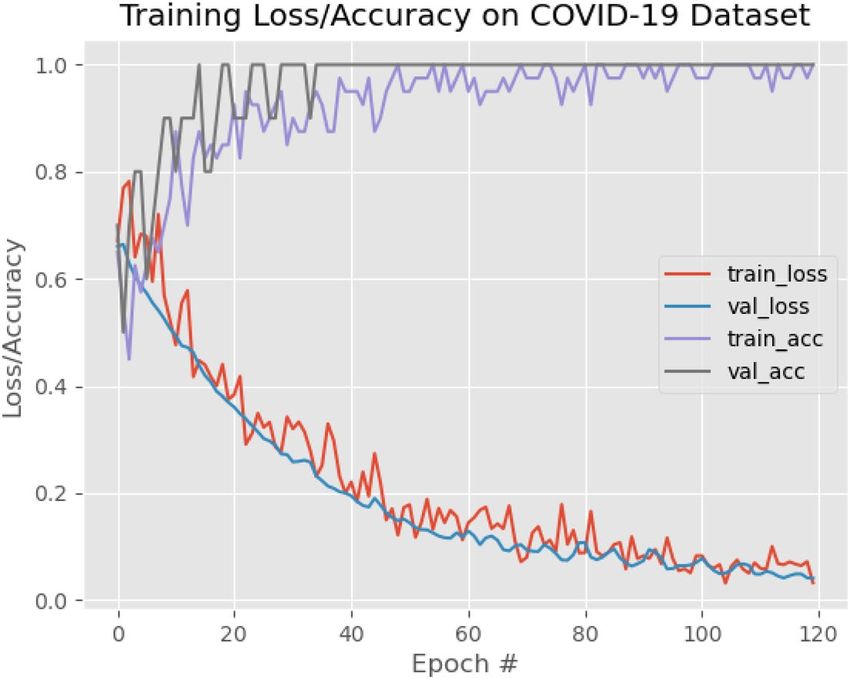
www.nature.com/scientificreports/
Layer Type Output Shape Param
Input Layer Input 64 × 64 × 3 0
Conv1 64 × 64 × 32 896
Hidden Layer 1 ReLU 64 × 64 × 32 0
Pool1 32 × 32 × 32 0
Conv2 32 × 32 × 64 18,496
Hidden Layer 2 ReLU 32 × 32 × 64 0
Pool2 16 × 16 × 64 0
Conv3 16 × 16 × 128 73,856
Hidden Layer 3 ReLU 16 × 16 × 128 0
Pool3 8 × 8 × 128 0
Flatten 8192 0
Dense1 16 131,088
ReLU 16 0
Dense2 64 1088
Classification layer
ReLU 64 0
Dense3 128 8320
ReLU 128 0
Dense4 2 258
Table 1. The parameters of each level for CNN.
Testing the DCNN. Once the CNN has been trained using the training set, it is used to diagnose all the
X-rays in the test set. For each case, the proportion of each diagnosis can be obtained. The parameters used to
indicate the performance of CNN are as accuracy, re-call, and F1 score.
Accuracy: The ratio of correct predictions (true positives + true negatives) to the total number of predictions.
Recall: The fraction of the cases classified as positive that are actually positive (the number of true positives
divided by the number of true positives plus false negatives).
F1 Score: An overall metric that essentially combines precision and recall.
The testing rules used are as follows:
1. Positive and predictive values are determined with family-wide 95% confidence intervals (Bonferroni cor-
rection) for the output of the CNN in determining COVID-19 pneumonia.
2. Positive and predictive values are determined with family-wide 95% confidence intervals (Bonferroni cor-
rection) for the output of the CNN in determining bacterial against viral pneumonia.
Examples of the type of X-ray data that is analyzed using our DCNN approach is shown in Fig. 4. The test
images are from Ref36. and “The New England Journal of Medicine, 2020: January 31. DOI: 10.1056/ NEJMoa
2001191”40. The data augmentation methods applied in the proposed DCNN are scale, shift, rotate, salt and pep-
per noise, and flip (Processes are as: To use a batch of images used for training, and take this batch and applies a
series of random transformations to each image in the batch. Replaces the original batch with the new, randomly
transformed batch. Trains the CNN on this randomly transformed batch.). By applying these small transforma-
tions to images during training, variety in the training dataset has been created and improves the robustness of
the proposed model. Generators are implemented for dynamic augmentation of the input image and generation
of the corresponding ground truth labels.
The experiment and software are based on TensorFlow 2.1-GPU41, Python 3.742 and CUDA 10.143 for accel-
erated training. The hardware for this system includes two i7-CPUs, 16.0 GB memory, and a 500 GB SSD drive,
NVIDIA GeForce GTX 1660 Ti GPU, and it takes approximately 4 h of training to converge. The user interface
of the system developed in this research is shown in Fig. 3. Figures 4 and 5 show the detection results. From
the results we can see that the system is very robust for different X-ray images of body position, angle, gender,
and size.
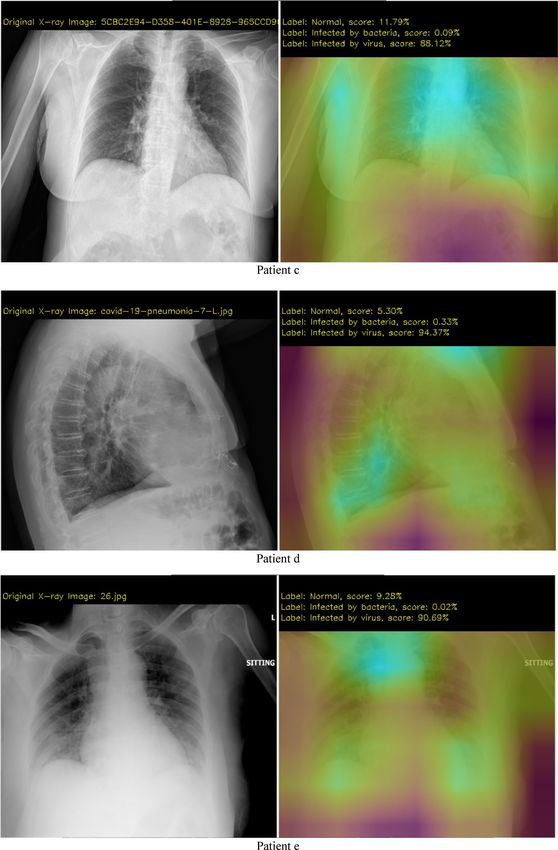
Results from step 1 (the first CNN). The left image shows the original X-ray data, the right image shows the
possibility of 3 different cases (normal, infected by bacteria, infected by virus), and the magenta color shows
which part has the potential infection problem.
Results from step 2 (the second CNN). If step 1 shows viral pneumonia with the highest score, continuous
processes are analyzed and checked if the patient has COVID-19 infection or not. The right image shows the
possibility of 3 different cases (non-viral pneumonia, infected by COVID-19, infected by other viruses), and a
brighter color shows which part has the potential infection problem.
Scientific Reports | (2021) 11:16071 | https://doi.org/10.1038/s41598-021-95680-6 6
Vol:.(1234567890)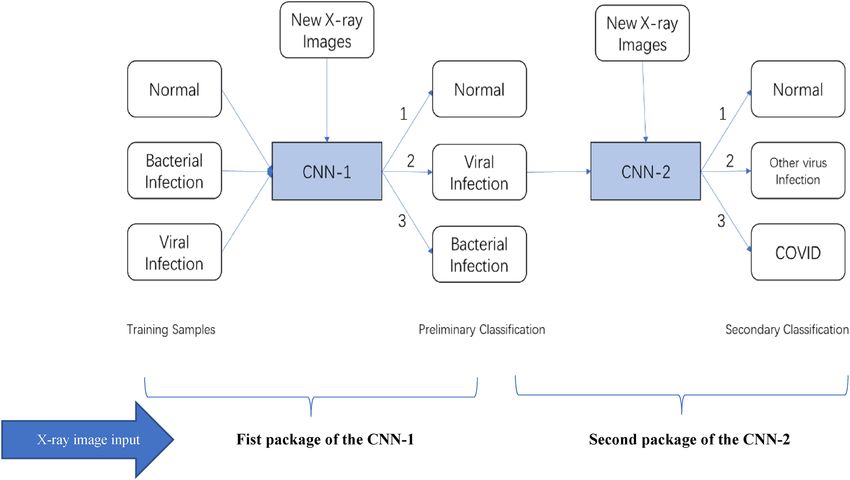
www.nature.com/scientificreports/
Figure 3. User interface (UI) of the system.
The architecture of DCNN categorizes benefits in X-ray medical imaging, such as the number of modules
in interconnected operations and input modalities, dimension in input patch, quantity of time predictions and
contextual information about implicit and explicit. The test results of the proposed DCNN are shown in Table 2
and the training loss and accuracy in Fig. 6 also indicate the robust learning of our model.
The performance results of different CNN models ( ResNet50V244, InceptionV345, VGG-1646, VGG-1937,
DenseNet47) are compared by using our COVID-19 dataset, as shown in Table 3. For comparison testing, 300
chest X-ray images (100 images for each class) are used, learning rate is initialized as 0.001, epoch is set 120,
and batch size is used as 8.
Figure 7 shows the performance of the evaluated model which includes the receiver operating characteristic
(ROC) and precision-recall curve. A ROC curve plots the true positive rate (TPR) against false positive rate
(FPR), and the model shows superior discrimination abilities for COVID-19 classes. The precision-recall plot
shows the tradeoff between recall and precision for various threshold levels.
Conclusions
To speed up the discovery of disease mechanisms, this research developed a two-level deep CNN-based chest
X-ray classifier system to detect abnormalities and extract textural features of the altered lung parenchyma that
can be related to specific signatures of the COVID-19 virus. Explainable AI explanations method especially the
proposed DCNN can help to construct more robust model and it especially helps doctors to understand complex
data distributions such as X-ray images which play an important role in the diagnosis of COVID-19 infection
from other pneumonia as advanced imaging evidence. As example-based explainable methods work well if the
feature values of an instance carry more context, meaning the data has a structure, like images, so artificial intel-
ligence (AI) algorithms and radionic features derived from chest X-rays can be of great help to undertake massive
screening programs that could take place in any hospital with access to X-ray equipment and aid in the diagnosis
of COVID-19. The designed system has 96.03% accuracy, 96.15% precision, and 96.0% recall for COVID-19
X-ray images (including different body position, angle, size, and gender). Although the results were promising,
further investigation is needed on a larger dataset of COVID-19 images, to have a more comprehensive evalua-
tion of accuracy rates. The performance of this system can also be improved by using more robust optimization
techniques such as: Elephant herding optimization (EHO), Bull optimization algorithm (BOA), Parliamentary
optimization algorithm (POA), and Bumble bees mating optimization (BBMO), which are also included in our
future works. What is more, the similar system can be used for other kind of medical image data, such as CT,
MRI, MEG, et al., helping for different fields of early diagnosis.
Scientific Reports | (2021) 11:16071 | https://doi.org/10.1038/s41598-021-95680-6 7
Vol.:(0123456789)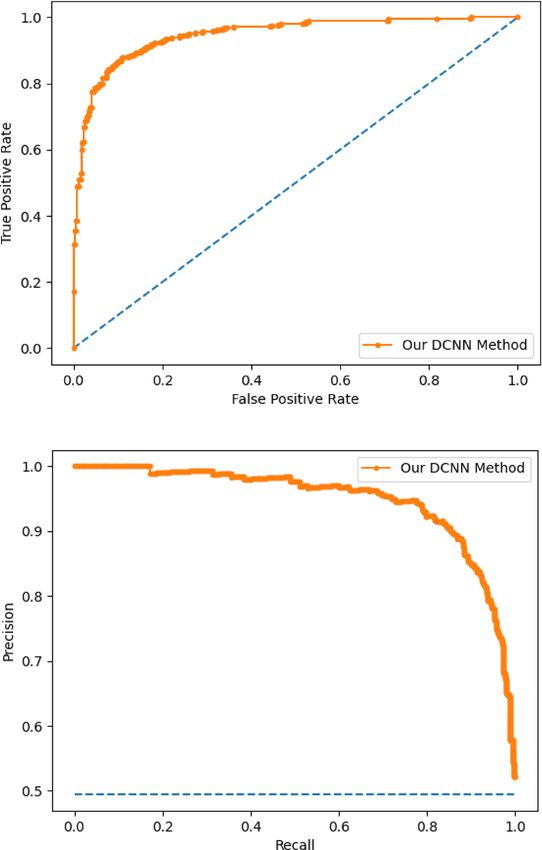
www.nature.com/scientificreports/

                                            Figure 4.  First step results.

          Scientific Reports |   (2021) 11:16071 |                https://doi.org/10.1038/s41598-021-95680-6   8

Vol:.(1234567890)
www.nature.com/scientificreports/
Figure 4. (continued)
Scientific Reports | (2021) 11:16071 | https://doi.org/10.1038/s41598-021-95680-6 9
Vol.:(0123456789)www.nature.com/scientificreports/
Figure 5. Analysis results demo.
Scientific Reports | (2021) 11:16071 | https://doi.org/10.1038/s41598-021-95680-6 10
Vol:.(1234567890)www.nature.com/scientificreports/
Figure 5. (continued)
Scientific Reports | (2021) 11:16071 | https://doi.org/10.1038/s41598-021-95680-6 11
Vol.:(0123456789)www.nature.com/scientificreports/
Parameters
X-ray Category Precision Recall F1-score Support
Normal 0.97 0.94 0.95 572
Pneumonia infected by Bacteria 0.99 0.93 0.96 213
Pneumonia infected by COVID-19 0.96 0.98 0.97 117
Pneumonia infected by normal Virus 0.98 0.96 0.97 410
Average 0.97 0.95 0.96 1312
Table 2. Experimental results for test database.
Figure 6. Loss/accuracy graph.
Model Class Accuracy % Precision % F1-score %
Pneumonia by bacteria 90.0 93.0 92.0
ResNet50V2 Pneumonia by normal virus 94.20 94.0 94.0
COVID-19 91.25 91.0 91.0
Pneumonia by Bacteria 86.50 90.0 88.0
InceptionV3 Pneumonia by Normal Virus 84.20 86.0 85.0
COVID-19 80.30 80.60 80.0
Pneumonia by bacteria 87.0 91.0 89.0
VGG-16 Pneumonia by normal virus 93.40 90.0 92.0
COVID-19 81.38 81.75 81.0
Pneumonia by bacteria 84.0 89.0 86.0
VGG-19 Pneumonia by normal virus 94.5 91.0 92.8
COVID-19 86.0 87.0 86.5
Pneumonia by bacteria 86.0 91.0 89.0
DenseNet Pneumonia by normal virus 93.5 90.0 91.8
COVID-19 88.0 87.0 87.5
Pneumonia by bacteria 99.0 99.0 99.0
Our Model Pneumonia by normal virus 98.15 96.20 97.0
COVID-19 96.03 96.15 96.0
Table 3. Performance results of different models for validation database.
Scientific Reports | (2021) 11:16071 | https://doi.org/10.1038/s41598-021-95680-6 12
Vol:.(1234567890)www.nature.com/scientificreports/
Figure 7. ROC and precision-recall curve.
Received: 21 March 2021; Accepted: 28 July 2021
References
1. Wang, D. et al. Clinical characteristics of 138 hospitalized patients with 2019 novel coronavirus-infected pneumonia in Wuhan,
China. JAMA https://doi.org/10.1001/jama.2020.1585 (2020).
2. Aboughdir, M. et al. Prognostic value of cardiovascular biomarkers in COVID-19: A review. Viruses https://d oi.o
rg/1 0.3 390/v 1205
0527 (2020).
3. Acharya, A. et al. SARS-CoV-2 infection leads to neurological dysfunction. J. Neuroimmune Pharmacol. https://doi.org/10.1007/
s11481-020-09924-9 (2020).
4. Kiran, G. et al. In silico computational screening of Kabasura Kudineer—Official Siddha Formulation and JACOM against SARS-
CoV-2 Spike protein. J. Ayurveda Integr. Med. https://doi.org/10.1016/j.jaim.2020.05.009 (2020).
5. Ackermann, M. et al. Pulmonary vascular endothelialitis, thrombosis, and angiogenesis in Covid-19. New Engl. J. Med. https://
doi.org/10.1056/NEJMoa2015432 (2020).
6. Cao, Y. et al. Potent neutralizing antibodies against SARS-CoV-2 identified by high-throughput single-cell sequencing of conva-
lescent patients’ B cells. Cell https://doi.org/10.1016/j.cell.2020.05.025 (2020).
7. Addeo, A. et al. COVID-19 and lung cancer: risks, mechanisms and treatment interactions. J. Immunother. Cancer https://doi.org/
10.1136/jitc-2020-000892 (2020).
8. Agarwal, A. et al. Guidance for building a dedicated health facility to contain the spread of the 2019 novel coronavirus outbreak.
Indian J. Med. Res. 151(2), 177–183. https://doi.org/10.4103/ijmr.IJMR_518_20 (2020).
9. Mohamed, Y., Abdallah, Y., & Alqahtani, T. Research in medical imaging using image processing techniques. In Medical Imag-
ing—Principles and Applications, Yongxia Zhou, IntechOpen 2019. https://doi.org/10.5772/intechopen.84360.
10. Taghizadieh, A., Ala, A., Rahmani, F. & Nadi, A. Diagnostic accuracy of chest X-ray and ultrasonography in detection of com-
munity acquired pneumonia; a brief report. Emerg (Tehran) 3(3), 114–116 (2015).
11. Wachinger, C., Reuter, M. & Klein, T. DeepNAT: Deep convolutional neural network for segmenting neuroanatomy. Neuroimage
170, 434–445. https://doi.org/10.1016/j.neuroimage (2017).
12. Dua, S.U.R, Acharya & P. Dua, Machine learning in Healthcare informatics, 2014.
Scientific Reports | (2021) 11:16071 | https://doi.org/10.1038/s41598-021-95680-6 13
Vol.:(0123456789)www.nature.com/scientificreports/
13. Fourcade, A. & Khonsari, R. H. Deep learning in medical image analysis: A third eye for doctors. J. Stomatol. Oral Maxillofac. Surg.
120(4), 279–288 (2019).
14. Li, J., Feng, J. & Kuo, C. Deep convolutional neural network for latent fingerprint enhancement. Signal Process. Image Comm. 60,
52–63. https://doi.org/10.1016/j.image.2017.08.010 (2017).
15. Hussain, S., Anwar, S. & Majid, M. Segmentation of glioma tumors in brain using deep convolutional neural network. Neurocom-
puting 282, 248–261. https://doi.org/10.1016/j.neucom.2017.12.032 (2017).
16. Ullah, S. M. A. et al. Scalable telehealth services to combat novel coronavirus (COVID-19) pandemic. SN Comput. Sci. 2(1), 18
(2020).
17. Islam, Md. M. et al. Wearable technology to assist the patients infected with novel coronavirus (COVID-19). SN Comput. Sci. 1(6),
320 (2020).
18. Islam, Md. M., Ullah, S. M. A., Mahmud, S. & Raju, S. M. T. U. Breathing aid devices to support novel coronavirus (COVID-19)
infected patients. SN Comput. Sci. 1(5), 274 (2020).
19. Rahman, M.M., Manik, Md.M.H., Islam, Md. M., Mahmud, S., & Kim, J.-H. An automated system to limit COVID-19 using facial
mask detection in smart city network. IEEE International IOT, Electronics and Mechatronics Conference (IEMTRONICS), IEEE,
Vancouver, BC, Canada, pp. 1–5, 2020.
20. Baldominos, A., Saez, Y. & Isasi, P. Evolutionary convolutional neural networks: An application to handwriting recognition.
Neurocomputing 283, 38–52. https://doi.org/10.1016/j.neucom.2017.12.049 (2017).
21. Ferreira, A. & Giraldi, G. Convolutional Neural Network approaches to granite tiles classification. Expert Syst. Appl. 84, 1–11.
https://doi.org/10.1016/j.eswa.2017.04.053 (2017).
22. Liu, N., Han, J., Liu, T. & Li, X. Learning to predict eye fixations via multiresolution convolutional neural networks. IEEE Trans.
Neural Netw. Learn. Syst. 29(2), 392–404. https://doi.org/10.1109/tnnls.2016.2628878 (2018).
23. Salvati, D., Drioli, C. & Foresti, G. Exploiting CNNs for improving acoustic source localization in noisy and reverberant conditions.
IEEE Trans. Emerg. Topics Comput. Intell. 2(2), 103–116. https://doi.org/10.1109/tetci.2017.2775237 (2018).
24. Islam, M. M., Karray, F., Alhajj, R. & Zeng, J. A review on deep learning techniques for the diagnosis of novel coronavirus (COVID-
19). IEEE Access 9, 30551–30572 (2021).
25. Asraf, A., Islam, Md. Z., Haque, Md. R. & Islam, Md. M. Deep learning applications to combat novel coronavirus (COVID-19)
pandemic. SN Comput. Sci. 1(6), 363 (2020).
26. Jibril, M. L., Islam, Md. M., Sharif, U. S. & Ayon, S. I. Predictive data mining models for novel coronavirus (COVID-19) infected
patients recovery. SN Comput. Sci. 1(4), 206 (2020).
27. Islam, M. Z., Islam, M. M. & Asraf, A. A combined deep CNN-LSTM network for the detection of novel coronavirus (COVID-19)
using X-ray images. Inform. Med. Unlocked. 20, 100412 (2020).
28. Saha, P., Sadi, M. S. & Islam, Md. M. EMCNet: Automated COVID-19 diagnosis from X-ray images using convolutional neural
network and ensemble of machine learning classifiers. Inform. Med. Unlocked 22, 100505 (2021).
29. Islam, M. M., Islam, M. Z., Asraf, A., & Ding, W. Diagnosis of COVID-19 from X-rays using combined CNN-RNN architecture
with transfer learning 2020. https://doi.org/10.1101/2020.08.24.20181339v1
30. Singh, D., Kumar, V. & Kaur, M. Densely connected convolutional networks-based COVID-19 screening model. Appl. Intell. 51,
3044–3051. https://doi.org/10.1007/s10489-020-02149-6 (2021).
31. Singh, D., Kumar, V., Yadav, V. & Kaur, M. Deep neural network-based screening model for COVID-19-infected patients using
chest X-ray images. Int. J. Pattern Recognit. Artif. Intell. 35(03), 2151004 (2021).
32. Gianchandani, N., Jaiswal, A., Singh, D., Kumar, V. & Kaur, M. Rapid COVID-19 diagnosis using ensemble deep transfer learning
models from chest radiographic images. J. Ambient Intell. Humaniz. Comput. 16, 1–13. https://d oi.o
rg/1 0.1 007/s 12652-0 20-0 2669-6
(2020).
33. Kanne, J. P., Little, B. P., Chung, J. H., Elicker, B. M. & Ketai, L. H. Essentials for radiologists on COVID-19: An update-radiology
scientific expert panel. Radiology https://doi.org/10.1148/radiol.2020200527 (2020).
34. Ghoshal, B., & Tucker, A. Estimating uncertainty and interpretability in deep learning for coronavirus (COVID-19) detection.
CoRR arXiv: 2003.10769 (2020).
35. Narin, A., Kaya, C., & Pamuk, Z. Automatic detection of coronavirus disease (COVID-19) using x-ray images and deep convolu-
tional neural networks, arXiv preprint arXiv: 2003.10849 (2020).
36. https://github.com/ieee8023/covid-chestxray-dataset/tree/master/images
37. Xiao, J., Wang, J., Cao, S. & Li, B. Application of a novel and improved VGG-19 network in the detection of workers wearing masks.
J. Phys. Conf. Ser. 1518, 012041 (2020).
38. Wang, Z. J., Turko, R., Shaikh, O., Park, H., Das, N., Hohman, F., Kahng, M., & Chau, D. H.. CNN Explainer: learning convolutional
neural networks with interactive visualization. arXiv preprint, arXiv: 2004.15004 (2020).
39. Shekar, B. H., & Dagnew, G. Grid search-based hyperparameter tuning and classification of microarray cancer data. In 2019 Second
International Conference on Advanced Computational and Communication Paradigms (ICACCP), pp. 1–8 (2019).https://doi.org/
10.1109/ICACCP.2019.8882943
40. Holshue, M. L. et al. First case of 2019 novel coronavirus in the United States. New Engl. J. Med. https://doi.org/10.1056/NEJMo
a2001191 (2020).
41. https://www.tensorflow.org/install/gpu
42. https://www.python.org/downloads/release/python-370/
43. https://developer.nvidia.com/cuda-10.1-download-archive-base
44. K. He, X. Zhang, S. Ren, & J. Sun. Identity mappings in deep residual networks. In European Conference on Computer Vision.
Springer, pp. 630–645 (2016).
45. Szegedy, C., Vanhoucke, V., Ioffe, S., Shlens, J., & Wojna, Z. Rethinking the inception architecture for computer vision. In: Proceed-
ings of the IEEE Conference on Computer Vision and Pattern Recognition (CVPR), Las Vegas, NV, USA, pp. 2818–2826 (2016).
46. Guan, Q. et al. Deep convolutional neural network VGG-16 model for differential diagnosing of papillary thyroid carcinomas in
cytological images: A pilot study. J. Cancer 10, 4876–4882 (2019).
47. Huang, G., Liu, Z., van der Maaten, L., & Weinberger, K. Q. Densely connected convolutional networks. arXiv: 1608.06993.
Author contributions
J.H. carried out the data collection, research design and applying for funding. T.G. carried out the research design,
software development and system testing.
Funding
This work was supported by the Research Fund for Doctor of Guangdong Medical University (GDMUB2020010).
Competing interests
The authors declare no competing interests.
Scientific Reports | (2021) 11:16071 | https://doi.org/10.1038/s41598-021-95680-6 14
Vol:.(1234567890)www.nature.com/scientificreports/
Additional information
Correspondence and requests for materials should be addressed to T.G.
Reprints and permissions information is available at www.nature.com/reprints.
Publisher’s note Springer Nature remains neutral with regard to jurisdictional claims in published maps and
institutional affiliations.
Open Access This article is licensed under a Creative Commons Attribution 4.0 International
License, which permits use, sharing, adaptation, distribution and reproduction in any medium or
format, as long as you give appropriate credit to the original author(s) and the source, provide a link to the
Creative Commons licence, and indicate if changes were made. The images or other third party material in this
article are included in the article’s Creative Commons licence, unless indicated otherwise in a credit line to the
material. If material is not included in the article’s Creative Commons licence and your intended use is not
permitted by statutory regulation or exceeds the permitted use, you will need to obtain permission directly from
the copyright holder. To view a copy of this licence, visit http://creativecommons.org/licenses/by/4.0/.
© The Author(s) 2021, corrected publication 2021
Scientific Reports | (2021) 11:16071 | https://doi.org/10.1038/s41598-021-95680-6 15
Vol.:(0123456789)You can also read