Spatial dynamics of the COVID-19 pandemic in Brazil
←
→
Page content transcription
If your browser does not render page correctly, please read the page content below
Epidemiology and Infection                            Spatial dynamics of the COVID-19 pandemic in
        cambridge.org/hyg
                                                              Brazil
                                                              R. R. Castro1          , R. S. C. Santos2, G. J. B. Sousa1                   , Y. T. Pinheiro3,
                                                              R. R. I. M. Martins4, M. L. D. Pereira5 and R. A. R. Silva6,7
        Original Paper
                                                              1
                                                                Postgraduate program in Clinical Nursing Care and Health, Universidade Estadual do Ceará, Fortaleza, Ceará,
        Cite this article: Castro RR, Santos RSC, Sousa       Brasil; 2Postgraduate program in Nursing, Faculdade Metropolitana de Ciências e Tecnologia, Parnamirim, Rio
        GJB, Pinheiro YT, Martins RRIM, Pereira MLD,
                                                              Grande do Norte, Brasil; 3Faculdade Maurício de Nassau, João Pessoa, Paraíba, Brasil; 4Faculdade Santo Antônio
        Silva RAR (2021). Spatial dynamics of the
                                                              de Caçapava, São Paulo, Brasil; 5Postgraduate program in Clinical Care in Nursing and Health, Universidade
        COVID-19 pandemic in Brazil. Epidemiology
        and Infection 149, e60, 1–9. https://doi.org/         Estadual do Ceará, Fortaleza, Ceará, Brasil; 6Postgraduate program in Nursing, Universidade Federal do Rio
        10.1017/S0950268821000479                             Grande do Norte, Natal, Rio Grande do Norte, Brasil and 7Postgraduate program in Collective Health, Universidade
                                                              Federal do Rio Grande do Norte, Natal, Rio Grande do Norte, Brasil
        Received: 17 August 2020
        Revised: 16 February 2021
        Accepted: 18 February 2021
                                                                Abstract
                                                                The objective of this study was to analyse the dynamics of spatial dispersion of the coronavirus
        Key words:                                              disease 2019 (COVID-19) in Brazil by correlating them to socioeconomic indicators. This is
        Brazil; COVID-19; pandemic; spatial analysis
                                                                an ecological study of COVID-19 cases and deaths between 26 February and 31 July 2020. All
        Author for correspondence:                              Brazilian counties were used as units of analysis. The incidence, mortality, Bayesian incidence
        R. R. Castro,                                           and mortality rates, global and local Moran indices were calculated. A geographic weighted
        E-mail: revia_ribeiro@hotmail.com                       regression analysis was conducted to assess the relationship between incidence and mortality
                                                                due to COVID-19 and socioeconomic indicators (independent variables). There were con-
                                                                firmed 2 662 485 cases of COVID-19 reported in Brazil from February to July 2020 with
                                                                higher rates of incidence in the north and northeast. The Moran global index of incidence
                                                                rate (0.50, P = 0.01) and mortality (0.45 with P = 0.01) indicate a positive spatial autocorrel-
                                                                ation with high standards in the north, northeast and in the largest urban centres between
                                                                cities in the southeast region. In the same period, there were 92 475 deaths from COVID-
                                                                19, with higher mortality rates in the northern states of Brazil, mainly Amazonas, Pará and
                                                                Amapá. The results show that there is a geospatial correlation of COVID-19 in large urban
                                                                centres and regions with the lowest human development index in the country. In the geo-
                                                                graphic weighted regression, it was possible to identify that the percentage of people living
                                                                in residences with density higher than 2 per dormitory, the municipality human development
                                                                index (MHDI) and the social vulnerability index were the indicators that most contributed to
                                                                explaining incidence, social development index and the municipality human development
                                                                index contributed the most to the mortality model. We hope that the findings will contribute
                                                                to reorienting public health responses to combat COVID-19 in Brazil, the new epicentre of the
                                                                disease in South America, as well as in other countries that have similar epidemiological and
                                                                health characteristics to those in Brazil.

                                                              Introduction
                                                              The coronavirus disease 2019 (COVID-19), initially identified in China, in December 2019 [1],
                                                              is a highly transmissible infectious disease that has spread rapidly throughout the world. In
                                                              South America, the first case of the disease was registered in Brazil, on 26 February 2020
                                                              [2]. Due to the outbreak on all continents, the World Health Organization (WHO) assessed
                                                              that COVID-19 could be characterised as a pandemic on 11 March 2020. In Brazil, cases con-
                                                              tinued to increase and just over four months after the first case, the country had accumulated
                                                              more than 2 million confirmed cases and 80 thousand deaths [3].
                                                                  On the basis of this context, the pandemic situation presents itself as a challenge for health
                                                              authorities and requires measures to be implemented resulting in the control of the spread of
        © The Author(s), 2021. Published by                   COVID-19 [4]. Therefore, understanding the aspects related to transmissibility is essential for
        Cambridge University Press. This is an Open           disease control and harm reduction [4].
        Access article, distributed under the terms of
                                                                  Recent studies [5–10] analysed the dispersion of COVID-19 in some Brazilian municipal-
        the Creative Commons Attribution licence
        (http://creativecommons.org/licenses/by/4.0/),        ities and observed specific flows in each analysed location. Furthermore, it is possible to notice
        which permits unrestricted re-use,                    that these flows can be influenced by factors related to socioeconomic, cultural and health
        distribution, and reproduction in any medium,         inequalities [8]. Then, it is understood that COVID-19 presents a syndemic nature. The
        provided the original work is properly cited.         term syndemic refers to biologic and social interactions that are important to establish prog-
                                                              nosis, treatment, public policy and social protection. In the case of COVID-19, social and bio-
                                                              logical determinants of health may influence the incidence of the disease [11].
                                                                  Taking into account the different standards of inequality presented by various regions of
                                                              Brazil [12], an analysis of the patterns of dispersion throughout the national territory − not

Downloaded from https://www.cambridge.org/core. IP address: 46.4.80.155, on 23 Apr 2021 at 11:37:20, subject to the Cambridge Core terms of use, available at https://www.cambridge.org/core/terms.
https://doi.org/10.1017/S0950268821000479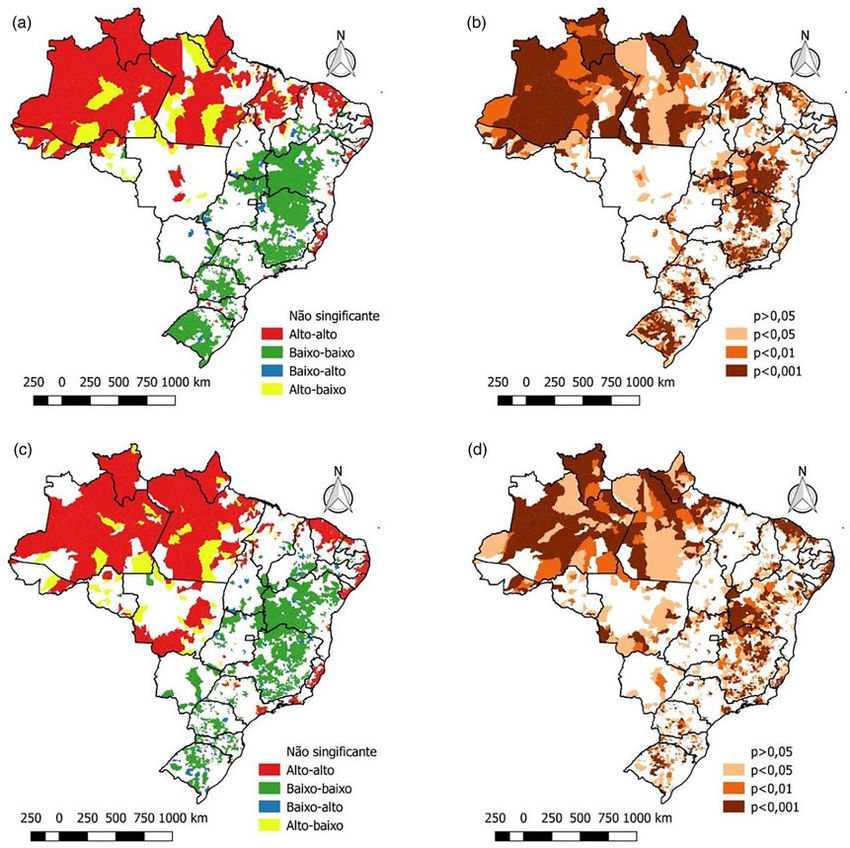
2                                                                                                                                                        R. R. Castro et al.

       limited to specific regions − is fundamental in the identification                         The global and the local Moran index analysis
       of elements that can help understand the current health situation
                                                                                                  After the descriptive analysis, the presence of spatial dependence
       and its impacts in varied scenarios [12]. This approach seeks to
                                                                                                  was verified through the global Moran index on the gross indica-
       facilitate the decision-making process regarding the most effective
                                                                                                  tor using the incidence and mortality rates of COVID-19 of
       strategies in controlling the disease.
                                                                                                  Brazilian municipalities. The method identifies spatial autocorrel-
           Spatial analysis methods are increasingly efficient for the iden-
                                                                                                  ation and varies between −1 and +1, where values close to zero
       tification of areas of greatest risk and, consequently, provide sup-
                                                                                                  indicate the absence of spatial dependence, considering significant
       port for the implementation of control measures. These measures,
                                                                                                  P < 0.05. Also, the local autocorrelation (local index of spatial
       once implemented, can serve as an example for other countries
                                                                                                  association – LISA) was evaluated by the local Moran index,
       that have the same profile and the same transmission dynamics
                                                                                                  which verifies the value of the municipality with that of its neigh-
       as Brazil.
                                                                                                  bours with identification of spatial patterns [14].
           Thus, this study is relevant as it permits the observation of
                                                                                                      The local Moran index identifies four quadrants: high−high
       possible spatial conglomerates of COVID-19 throughout Brazil,
                                                                                                  (municipalities with high rates and surrounded by those with
       as well as the identification of areas of greatest risk. Furthermore,
                                                                                                  high rates), low−low (municipalities with low rates surrounded
       it contributes to the pandemic by providing information that sup-
                                                                                                  by those with low rates), high−low (municipalities with high
       ports preventive action, control and treatment, reduction of mor-
                                                                                                  rates surrounded by those with low rates) and low−high (munici-
       tality including defining priorities. Therefore, this study aims to
                                                                                                  palities with low rates surrounded by those with high rates), tak-
       analyse the patterns of spatial dispersion of incidence and mortality
                                                                                                  ing into account values with P < 0.05 as significant. The high
       from COVID-19 in Brazil by correlating them to socioeconomic
                                                                                                  −high and low−low categories represent areas of conformity
       indicators.
                                                                                                  and the high−low and low−high categories indicate areas of
                                                                                                  epidemiological transition [14].

       Methods
                                                                                                  Regression analysis
       This is an ecological study, which uses municipalities throughout
       the Brazilian territory as units of analysis. Brazil is a country in                       After the descriptive spatial analysis, we sought to identify which
       South America, it possesses 5570 municipalities distributed across                         characteristics were related to this pattern. Thus, a multivariate
       26 states and one federal district (Fig. 1), it has an estimated                           linear regression analysis was performed by using the incidence
       population of 211 757 141 inhabitants, an area of 8 510 295 914                            and mortality due to COVID-19 as outcomes. The following indi-
       km2 and a demographic density of 22.43 inhabitants/km2 [13].                               cators were considered predictors: illiteracy rate in people over 18
                                                                                                  years old, Gini index, average income per capita, percentage of the
                                                                                                  population living in households with a density greater than two
                                                                                                  people per bedroom, proportion of the population in the house-
       Data collection and analysis
                                                                                                  hold with bathroom and running water, social vulnerability
       For this study, the data used were provided by the Brazilian                               index (SVI), municipality human development index (MHDI),
       Health Department through the electronic website where all                                 demographic density and coverage of primary health care.
       data and indicators referring to COVID-19 in the country are                               These indicators were taken from the Brazil atlas that consolidates
       available as public domain [3]. The federal database comprised                             socioeconomic, demographic and vulnerability information for
       all cases tested and confirmed for the disease from 26 February                            each municipality through data from the last Brazilian census
       to 31 July 2020.                                                                           [15]. It is noteworthy that of the 5570 Brazilian municipalities,
           Initially, the incidence of the disease in the country was calcu-                      five did not contain the data described above and were removed
       lated, using the number of cases accumulated in each municipality                          from the analyses.
       as the numerator and the population of this municipality esti-                                 The variables that presented P < 0.05 remained in the final
       mated in 2019 by the Brazilian Institute of Geography and                                  model. After this stage, the analysis of the regression residuals
       Statistics [13]. Moreover, the disease mortality was calculated                            was performed to verify the presence of spatial dependence.
       with the number of deaths in the numerator and the population                              Once verified, the geographically weighted regression (GWR)
       of each municipality in the denominator. The constant for both                             model was used as it considers a spatial component as an import-
       indicators was 100 000 inhabitants.                                                        ant factor in the model [16].
                                                                                                      In this sense, it is important to differentiate OLS and GWR
                                                                                                  models. The OLS models are considered global models, which
                                                                                                  investigate the relationship of a set of independent variables
       Descriptive analysis
                                                                                                  according to an outcome. This type of model does not consider
       For the spatial analysis, a thematic map of the incidence and mor-                         the geographic distribution of the analysed event, and may not
       tality of COVID-19 in each municipality was created, then, these                           be the most appropriate model to the dataset of COVID-19.
       rates were smoothed through the local empirical Bayesian method                            This model, however, can be used as a base model to compare
       to reduce the instabilities caused by the differences between each                         to other ones [17].
       city. This method considers not only the value of the municipality                             Since OLS models do not take the neighbour cases into
       but weighs it in the relation of borders between municipalities                            account, a GWR model overcomes this obstacle by applying a
       through a spatial proximity matrix, taking into account the con-                           contiguity matrix. Therefore, it is capable of analysing events
       tiguity criterion in which the value of 1 is attributed to the muni-                       that vary over the studied area; because of that, GWR is called a
       cipalities that share borders in and 0 to municipalities that do not                       local model. It is important to highlight that GWR uses the prin-
       share borders.                                                                             ciple of heterogeneity and non-stationarity in space, and it

Downloaded from https://www.cambridge.org/core. IP address: 46.4.80.155, on 23 Apr 2021 at 11:37:20, subject to the Cambridge Core terms of use, available at https://www.cambridge.org/core/terms.
https://doi.org/10.1017/S0950268821000479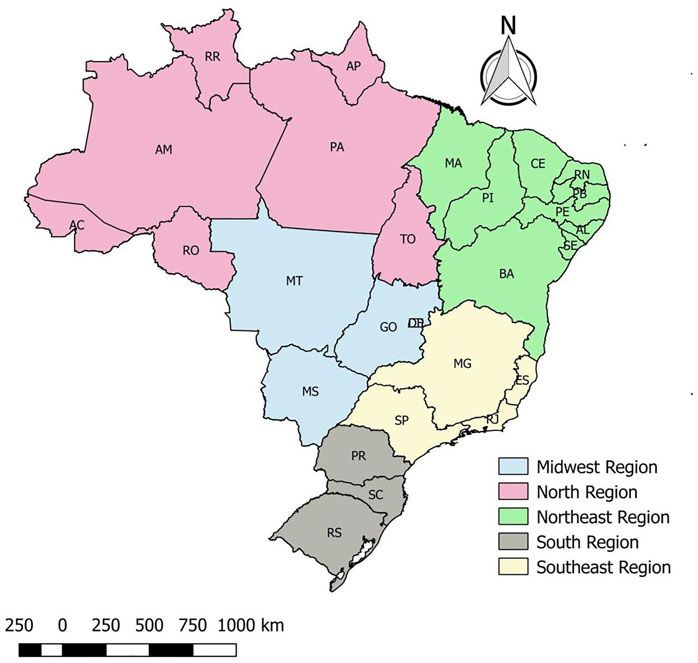
Epidemiology and Infection 3
Fig. 1. Distribution of states in Brazilian regions, Brazil,
2020.
generates a regression coefficient for each one of the geographic Government. It is important to note that it is not possible to iden-
units that are in analysis. In the case of this study, the coefficients tify the patient, as no such information has been made available.
are for each municipality of Brazil and, then, it can be analysed
where the indicator is a risk or a protective factor [17, 18].
Nevertheless, some studies have already shown the importance Results
of working with local geographical models in the COVID-19
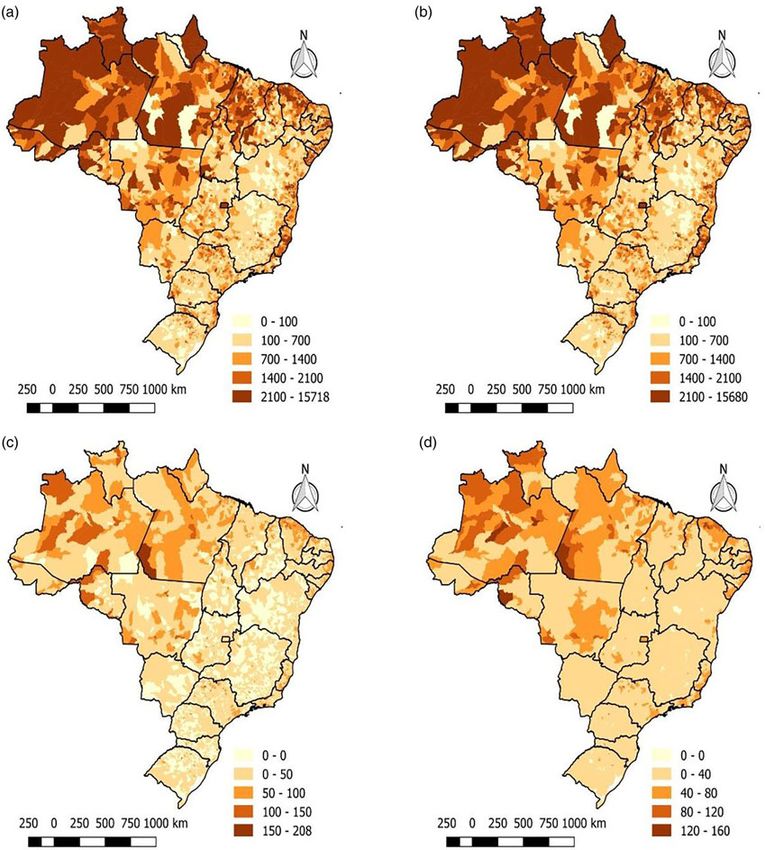
Spatial autocorrelation analysis of the incidence and mortality
scenario. Literature shows that such a model was used to deter-
rate
mine the influence of sociodemographic indicators on incidence
and mortality of COVID-19 in European countries and the From February to July 2020, 2,662,485 confirmed cases of
United States [17, 18]. At a Brazilian level, mortality by the dis- COVID-19 were reported in Brazil. Figure 2a demonstrates that
ease was modelled by applying GWR in São Paulo [19]. most Brazilian municipalities had at least one case of
Therefore, it is possible to emphasise that such a model can be COVID-19 since only 123 did not register any cases. The highest
used in cases of people infected by severe acute respiratory incidence rates in the country reach maximum values in states in
syndrome-coronavirus disease-2. the north and northeast region. Through the approach of the local
To assess which of the models was the most appropriate, the empirical Bayesian method (Fig. 2b), it is possible to notice that
Akaike criterion (AIC) and the determination coefficient R 2 the rates were weighted, and the areas showed a better distribution
were used. Thus, the one with the lowest AIC value and the high- of the incidence. However, the municipalities have similar gross
est R 2 was considered as the best model [20]. and Bayesian rates, but with uniformity in the central region of
Moreover, models were also evaluated regarding multicolli- the country.
nearity by the variance inflation factors (VIF). Therefore, vari- In the spatial autocorrelation analysis of the incidence rate, the
ables that, after regression, presented VIF >10 are considered global Moran index was 0.50, with P = 0.01, indicating a positive
with multicollinearity and should be removed. spatial autocorrelation. Through the local Moran index, spatial
The calculations of the gross and smoothed rate as well as the clusters can be identified (Fig. 2), where the main high−high pat-
Moran spread index and its significance were developed in the terns are found in the north, northeast and the largest cities in the
TerraView 4.2.2 software. All maps were produced using the southeast. The main low−low clusters are concentrated in central
QGIS 2.4.17 software. The analyses were performed in the soft- Brazil. In the LISA map, it is possible to see the significance of
ware Stata13, GeoDa 1.14.0 e GWR 4.0. each of these clusters (Fig. 2d).
This study was not submitted to the Research Ethics Regarding the mortality of the disease, the same period
Committee due to the utilisation of Brazilian public domain data- reported 92 475 deaths from COVID-19. Through Figure 3a, it
bases of COVID-19, hence available on the websites of the Federal can be seen that the northern states of Brazil, mainly
Downloaded from https://www.cambridge.org/core. IP address: 46.4.80.155, on 23 Apr 2021 at 11:37:20, subject to the Cambridge Core terms of use, available at https://www.cambridge.org/core/terms.
https://doi.org/10.1017/S0950268821000479
4                                                                                                                                                        R. R. Castro et al.

       Fig. 2. Spatial distribution of the gross and Bayesian, Moran global and local spatial autocorrelation indicators of the Covid-19 cases in Brazil, 26 February to 31
       July 2020. (a) Gross rate of new cases (b) Bayesaian rate of new cases (c)Crude mortality rate (d) Bayesian mortality rate.

       Amazonas, Pará and Amapá, presented high mortality, reaching                               Goias and Brasilia) and the south (Parana, Santa Catarina and
       more than 150 deaths per 100 thousand inhabitants. By applying                             Rio Grande do Sul) in addition to the states of Bahia, in the
       the local empirical Bayesian method, areas with high death rates                           northeast and Minas Gerais, in southeastern Brazil. On the
       can be seen more clearly in addition to the north region, such                             LISA map, it is possible to see the significance of each of these
       as the states of Ceara and Pernambuco (northeast region), Sao                              clusters (Fig. 3d).
       Paulo and Rio de Janeiro (region southeast) also with an elevated
       mortality rate from the disease (Fig. 3b).
                                                                                                  OLS regression analyses for the incidents and mortality
           In the spatial autocorrelation analysis of the mortality rate, the
       global Moran index was equal to 0.45 with P = 0.01, indicating a                           When OLS regression was conducted for the incidence of
       positive spatial autocorrelation. Through the local Moran index,                           COVID-19 in Brazil, it was observed that the relationship with
       spatial clusters can be identified (Fig. 3c) where the main high                           the Gini index and with demographic density lost statistical sig-
       −high patterns are found in the states of Amazonas, Pará,                                  nificance (P > 0.05). The analysis of OLS residuals showed that
       Amapá and Roraima (north region), Ceara and Pernambuco                                     they were spatially dependent since I = 0.338 (P < 0.05), requiring
       (northeast region) as well as Sao Paulo and Rio de Janeiro (south-                         the application of a GWR model. When the GWR model was
       east region). The main low−low clusters are concentrated in the                            applied to the statistically significant variables in the OLS
       states of the midwest region (Mato Grosso, Mato Grosso do Sul,                             model, it was observed that most of the association occurred

Downloaded from https://www.cambridge.org/core. IP address: 46.4.80.155, on 23 Apr 2021 at 11:37:20, subject to the Cambridge Core terms of use, available at https://www.cambridge.org/core/terms.
https://doi.org/10.1017/S0950268821000479
Epidemiology and Infection 5
Fig. 3. Spatial distribution of crude and Bayesian spatial autocorrelation, Moran global and location of COVID-19 mortality in Brazil, from 26 February to 31 July
2020. (a) Moran map of new cases (b) Lisa significance map of new cases (c) Moran map of mortality (d) Lisa significance map of mortality.
through the direct relation with the SVI (β = 148.01), with the the need to apply a GWR model. When the GWR model was
MHDI (β = 174.61) and with the proportion of the population applied to the statistically significant variables in the OLS
with density> 2 (β = 3.13). model, it was observed that most of the relationship occurred dir-
ectly with the SVI (β = 11.01) and with the MHDI (β = 7.47) and
inversely with the Gini index (β = −8.08).
Other association analyses
Other relationships evidenced by the GWR model were dir-
Other relationships observed were the direct relationship with the ectly related to per capita income (β = 0.01), the proportion of
average income per capita (β = 0.25), the proportion of the popu- population with density > 2 (β = 0.07) and demographic density
lation at home with a bathroom and running water (β = 0.68), (β = 0.0004). An inverse relationship was identified with the illit-
coverage of primary health care (β = 0.32). There was also an eracy rate in those over 18 years old (β = −0.14). As with the inci-
inverse relationship with the illiteracy rate in those over 18 dence, these relationships must be interpreted with caution
years old (β = −0.85). However, all of these relationships must because the coefficients are close to zero (Table 2).
be interpreted with caution as the coefficients are close to zero Regarding the evaluation of the models, there was a better per-
(Table 1). formance of the GWR model compared to the OLS. This occurs
The OLS regression for mortality due to COVID-19 in Brazil, when, for the incidence of COVID-19, it was observed that the
on the other hand, showed that the relationship with the propor- OLS model presented AIC = 76 428 and R 2 = 0.201, and the
tion of the population at home with bathroom and running water GWR presented AIC = 74 580 and R 2 = 0.450. As for mortality,
and coverage of primary health care lost statistical significance (P the AIC = 40 331 and R 2 = 0.151 and the GWR model presented
> 0.05). The analysis of the residuals showed that they presented AIC = 38 466 and R 2 = 0.420. In both models, the mean VIF
spatial dependence because I = 0.299 (P < 0.05), also showing was 3.9, and the variable that most inflates variance was the
Downloaded from https://www.cambridge.org/core. IP address: 46.4.80.155, on 23 Apr 2021 at 11:37:20, subject to the Cambridge Core terms of use, available at https://www.cambridge.org/core/terms.
https://doi.org/10.1017/S09502688210004796 R. R. Castro et al.
Table 1. Indicators of incidence of COVID-19
OLS regression GWR regression
Standard Standard
Indicators β error P-value β (mean) deviation
Illiteracy rate in those over 18 years old −3.83 0.60Epidemiology and Infection 7
regions with the highest rates, revealing the high risk of infection Another socioeconomic indicator is the income per capita
and mortality. Both regions had municipalities with incidence since municipalities with higher income had a higher incidence
rates that were two to 10 times higher than the incidence rates and mortality due to COVID-19. It is assumed that the influence
of municipalities in the midwest, south and southeast regions. of income per capita on the outcomes studied is related to the
Epidemiological and spatial analysis studies [23, 24] have presence of a better network of health services, expanding the
revealed that most populous cities have also the highest incidence population’s access to carrying out diagnostic tests in the munici-
of COVID-19. In contrast, the results found in Brazil reveal that palities with the highest per capita income. Corroborating this
the north and northeast regions, holding the lowest demographic finding, GWR analysis revealed that coverage of primary health
densities in the country, form the clusters with the highest inci- care is directly related to the incidence of COVID-19, since
dence rates. Nevertheless, these regions have cities with high expanding access increases the number of diagnosed cases and
demographic incidence due to high migratory and tourist flows, reduces underreporting, contributing to increasing the coeffi-
thus justifying their high rates. The absence of a relationship cients incidence and mortality [16].
between the indication of the disease and the population density The greater socioeconomic vulnerability of the north and
observed in the regression analysis can be explained by the fact northeast regions reverberates in the fight against the disease
that the increase in the transmission rate and the incidence through prevention and control measures, that contributed to
depend on the rate of interpersonal contact of a population, the high incidence and mortality in the region. A study carried
regardless of its density [25]. It is worth mentioning that these out in China revealed that during the first stage of the epidemic,
results need to be analysed with caution. the most economically prosperous cities had more medical
Another factor on the basis of the capacity of the health system resources and obtained lower transmission rates, showing that
is the national rates of ICU beds per 10 000 inhabitants, where the the greater amount of resources in the health department
north and northeast regions have the worst national scores, with decreased the transmissibility and mortality of the disease [32].
0.9 beds per 10 000 inhabitants in the north and 1.5 per 10 000 Another Chinese study presented that there is a relationship
inhabitants in the northeastern regions [26]. Besides, the high between socioeconomic conditions and COVID-19 mortality,
mortality identified especially in the areas can be justified by con- showing that the higher the gross domestic product (GDP) per
ditions related to health care, socioeconomic and demographic unit of land area and the hospital density, the lower the
conditions, and factors intrinsic to the population (age, presence COVID-19 morbidity rate [32]. Therefore, unstable income,
of comorbidities and life habits) [27–29]. weaknesses in the health system, scarcity of resources and rela-
The states of Amazonas, Pará, Amapá and Roraima, in the tively low popular socioeconomic conditions are challenges in
northern region, and the states of Ceara and Pernambuco, in containing the pandemic, making these regions more vulnerable
the northeastern region, stand out for their formations of spatial to the negative effects of COVID-19 [33, 34].
clusters, thus revealing a risk for the spread of the disease and The high mortality rate in the north region can be related to
requiring special attention in control strategies from government the marked presence of the indigenous population [35].
authorities [12]. The city of Manaus, capital of Amazonas, stands Research studies have shown that all people are immunologically
out, as it represents the largest financial and economic centre of susceptible to COVID-19, however, this population is more vul-
the north region and with important tourist activity. The presence nerable to epidemics due to worse social, economic and health
of agglomerates in Manaus and the metropolitan region is linked conditions, increasing the spread of diseases [34]. Also, barriers
to a social scenario in which social inequality, competitiveness to access health services, such as geographical distance, shortage
and fragile relations between municipalities prevail, resulting in of human resources in the health and linguistic fields, as well as
an insufficient network of health services and a quantitative defi- a lifestyle that allows them to be more exposed to infectious dis-
ciency of human resources [21, 30]. The direct relationship of eases, such as living in collective houses and sharing personal
social vulnerability, expressed by the SVI, which verifies popula- utensils are all contributing factors. Many indigenous people
tion conditions in addition to economic aspects, including hous- have been victims of COVID-19, but the difficulty in diagnosing
ing and education conditions, corroborates to explain the and notifying residents in unapproved indigenous areas contri-
existence of spatial clusters in these regions, since factors that butes to underreporting the number of cases and deaths [34–36].
express poverty increase the risk of transmission by infectious dis- The combination of determining factors such as the occasion
eases [16]. when the first cases occurred, densification and population dis-
In Brazil, the State of Ceara is the third with the largest num- placement flow; the age distribution; clinical support conditions
ber of confirmed cases in the country, with a high increase in for critically ill patients; the timing and extent of interventional
COVID-19 cases between February and July 2020 [3, 31]. The actions in the communities; available testing capacity and the
state capital, Fortaleza, together with the metropolitan region, pre- communication measures adopted by public health agencies to
sented the formation of spatial agglomeration. It is inferred that reduce viral spread are intervening elements in the behaviour of
the formation of high−high clusters for COVID-19 is related to the disease in any given region [19].
the economic and social characteristics of the region [21]. The use of the Bayesian model, global and local Moran and
In the GWR analysis, the MHDI, a measure composed of indi- GWR made it possible to understand the phenomenon of
cators of three dimensions of human development, longevity, COVID-19 in the Brazilian scenario and to point out the social
education and income, showed a direct relationship with inci- and economic factors involved in the geographical progression
dence and mortality. It is believed that this relationship may be of the disease. By understanding the patterns of the spatial distri-
related to the dynamics of the beginning of the pandemic in bution of COVID-19 in Brazil, takes into account that the adop-
the country, since, initially, the greatest number of cases was pre- tion of differentiated implementation measures and the
sent in places with greater circulation of people from other coun- establishment of strategic intervention schedules in respective
tries, verified in municipalities with high MHDI values, such as social determinants demonstrated positive contributions in the
Rio de Janeiro, São Paulo and Fortaleza [24]. fight against COVID-19.
Downloaded from https://www.cambridge.org/core. IP address: 46.4.80.155, on 23 Apr 2021 at 11:37:20, subject to the Cambridge Core terms of use, available at https://www.cambridge.org/core/terms.
https://doi.org/10.1017/S09502688210004798 R. R. Castro et al.
This study presented some limitations. Firstly, the methods 9. Pedrosa NL and de Albuquerque NLS (2020) Análise Espacial dos Casos
and analysis applied cannot infer causality. Secondly, data may de COVID-19 e leitos de terapia intensiva no estado do Ceará, Brasil.
be updated because the last national census was conducted in Ciência e Saúde Coletiva [Internet] 25, 2461–2468. Available at http://www.
scielo.br/scielo.php?script=sci_arttext&pid=S1413-81232020006702461&
2010; a new one was scheduled for this year, but because of
tlng=pt.
COVID-19, it had to be delayed. In this sense, secondary data
10. Dornels Freire de Souza C et al. (2020) Spatiotemporal evolution of case
analysis can be limited by the incompletion of the dataset. fatality rates of COVID-19 in Brazil, 2020. Jornal Brasileiro de Pneumologia
Finally, aggregated studies do not consider individual-level vari- [Internet] 46, e20200208–e20200208. Available at http://www.jornaldepneu-
ables such as age/sex/race and, therefore, limit conclusions. mologia.com.br/detalhe_artigo.asp?id=3362.
11. Horton R (2020) Offline: COVID-19 – a reckoning. The Lancet
[Internet] 395, 935. Available at https://linkinghub.elsevier.com/
Conclusion
retrieve/pii/S0140673620306693.
The results presented provided information to identify which geo- 12. Lana RM et al.. (2020) Emergência do novo coronavírus (SARS-CoV-2) e
spatial characteristics contribute to a higher incidence and mor- o papel de uma vigilância nacional em saúde oportuna e efetiva. Cadernos
tality of the disease and to analyse the coping measures adopted de Saúde Pública [Internet] 36(3), e00019620. doi: http://www.scielo.br/
scielo.php?script=sci_arttext&pid=S0102-311X2020000300301&tlng=pt.
based on the expansion of the disease in the country.
13. Brasil (2020) Cidades IBGE [Internet]. Instituto Brasileiro de Geografia e
This research study indicates that the largest urban centres and
Estatística. [cited 2020 Dec 14]. Available at https://cidades.ibge.gov.br.
spaces with the lowest HDI are the most affected by COVID-19, 14. Monteiro LD et al. (2015) Spatial patterns of leprosy in a hyperendemic
showing that socioeconomic aspects are directly related to the dis- state in Northern Brazil, 2001-2012. Revista de Saúde Pública [Internet] 49
ease. We hope that our findings can guide public health responses (84), 1–8. doi: http://www.scielo.br/scielo.php?script=sci_arttext&pid=
in the fight against COVID-19 in Brazil and other countries that S0034-89102015000100265&lng=en&tlng=en.
have similarities in the characteristics of spatial dispersion related 15. Brasil (2010) Censo Demográfico 2010. Características da população e dos
to sociodemographic aspects. domicílios: resultados do universo. Instituto Brasileiro de Geografia e
Estatística.
Financial support. None. 16. de Souza CDF et al. (2020) Modelagem espacial da hanseníase no estado
da Bahia, Brasil (2001–2015) e determinantes sociais da saúde. Ciência e
Conflict of interest. None.
Saúde Coletiva [Internet] 25, 2915–2926. Available at http://www.scielo.br/
Data. The data that support the findings of this study are available on the scielo.php?script=sci_arttext&pid=S1413-81232020000802915&tlng=pt.
Integrated Health Surveillance Platform (Ivis) of the Ministry of Health of 17. Mollalo A, Vahedi B and Rivera KM (2020) GIS-based spatial modeling
Brazil (http://plataforma.saude.gov.br/coronavirus/covid-19/). of COVID-19 incidence rate in the continental United States. Science of
the Total Environment [Internet] 728, 138884. Available at https://linkin-
ghub.elsevier.com/retrieve/pii/S0048969720324013.
18. Sannigrahi S et al. (2020) Examining the association between socio-
References
demographic composition and COVID-19 fatalities in the European
1. Zhu N et al. (2020) A novel coronavirus from patients with pneumonia in region using spatial regression approach. Sustainable Cities and Society
China, 2019. The New England Journal of Medicine [Internet] 382, 727– [Internet] 62, 102418. Available at https://linkinghub.elsevier.com/
733. Available at http://www.nejm.org/doi/10.1056/NEJMoa2001017. retrieve/pii/S2210670720306399.
2. United Nations (2020) Latin America and the Caribbean and the 19. Urban RC and Nakada LYK (2020) GIS-based spatial modelling of
COVID-19 pandemic. Economic and social effects. COVID-19 Special COVID-19 death incidence in São Paulo, Brazil. Environment and
Report [Internet], 1–14. Available at https://repositorio.cepal.org/bit- Urbanization [Internet], 095624782096396. Available at http://journals.
stream/%0Ahandle/11362/45351/1/S2000263_en.pdf%0A. sagepub.com/doi/10.1177/0956247820963962.
3. Brasil (2020) Integrated Health Surveillance Platform (Ivis) of the Ministry 20. Luc Anselin (2005) Exploring Spatial Data with GeoDaTM: A Workbook.
of Health of Brazil. Brasilia: Ministry of Health [Internet], 1. Available at 1st ed. U-C U of I, editor. California: Center for Spatially Integrated Social
http://plataforma.saude.gov.br/. Science, 2–244 p.
4. de Jesus JG et al. (2020) Importation and early local transmission of 21. Sousa GJB et al. (2020) Estimation and prediction of COVID-19 cases in
COVID-19 in Brazil, 2020. Revista do Instituto de Medicina Tropical de Brazilian metropolises. Revista Latino-Americana de Enfermagem [Internet]
São Paulo [Internet] 62, e30. doi: http://www.scielo.br/scielo.php? 28, e3345. doi: http://www.scielo.br/scielo.php?script=sci_arttext&pid=S0104-
script=sci_arttext&pid=S0036-46652020000100218&tlng=en. 11692020000100365&tlng=en.
5. Andrade LA et al. (2020) Surveillance of the first cases of COVID-19 in 22. CDC COVID-19 Response Team (2020) Geographic differences in
Sergipe using a prospective spatiotemporal analysis: the spatial dispersion COVID-19 cases, deaths, and incidence – United States. The Morbidity
and its public health implications. Revista da Sociedade Brasileira de and Mortality Weekly Report [Internet] 69:465–471. Available at http://
Medicina Tropical [Internet] 53, e20200287. doi: http://www.scielo.br/ dx.doi.org/10.15585/mmwr.mm6915e4externalicon.
scielo.php?script=sci_arttext&pid=S0037-86822020000100641&tlng=en. 23. Tang Y and Wang S (2020) Mathematic modeling of COVID-19 in the
6. Cavalcante JR and de Abreu A de JL (2020) COVID-19 no município do United States. Emerging Microbes & Infections [Internet] 9, 827–829.
Rio de Janeiro: análise espacial da ocorrência dos primeiros casos e óbitos Available at https://www.tandfonline.com/doi/full/10.1080/22221751.2020.
confirmados. Epidemiologia e Serviços de Saúde [Internet] 29(3), e2020204. 1760146.
doi: https://www.scielo.br/scielo.php?script=sci_arttext&pid=S2237-962220 24. Mukherjee K (2020) COVID-19 and lockdown: insights from Mumbai.
20000300302&lng=pt&nrm=iso&tlng=pt. Indian Journal of Public Health 64, 168–171. Available at http://pubmed.
7. Fortaleza CMCB et al. (2020) Taking the inner route: spatial and demo- ncbi.nlm.nih.gov/32496249/.
graphic factors affecting vulnerability to COVID-19 among 604 cities from 25. Hu H, Nigmatulina K and Eckhoff P (2013) The scaling of contact rates
inner São Paulo State, Brazil. Epidemiology & Infection [Internet] 148, with population density for the infectious disease models. Mathematical
e118. Available at https://www.cambridge.org/core/product/identifier/ Biosciences [Internet] 244, 125–134. Available at https://linkinghub.else-
S095026882000134X/type/journal_article. vier.com/retrieve/pii/S0025556413001235.
8. de Souza CDF et al. (2020) Spatiotemporal evolution of coronavirus dis- 26. Associação de Medicina Intensiva Brasileira (2020) AMIB apresenta
ease 2019 mortality in Brazil in 2020. Revista da Sociedade Brasileira de dados atualizados sobre leitos de UTI no Brasil. Associação de Medicina
Medicina Tropical [Internet] 53, e20200282. doi: http://www.scielo.br/ Intensiva Brasileira [Internet]. Avaliable at https://www.amib.org.br/filead-
scielo.php?script=sci_arttext&pid=S0037-86822020000100912&tlng=en. min/user_upload/amib/2020/abril/28/dados_uti_amib.pdf
Downloaded from https://www.cambridge.org/core. IP address: 46.4.80.155, on 23 Apr 2021 at 11:37:20, subject to the Cambridge Core terms of use, available at https://www.cambridge.org/core/terms.
https://doi.org/10.1017/S0950268821000479Epidemiology and Infection 9
27. de Cobre AF et al.. (2020) Risk factors associated with delay in diagnosis 32. Quinn SC and Kumar S (2014) Health inequalities and infectious disease
and mortality in patients with COVID-19 in the city of Rio de epidemics: a challenge for global health security. Biosecurity and
Janeiro, Brazil. Ciência & Saúde Coletiva [Internet] 25, 4131–4140. Bioterrorism: Biodefense Strategy, Practice, and Science [Internet] 12, 263–
Available at http://www.scielo.br/scielo.php?script=sci_arttext&pid=S1413- 273. Available at http://www.liebertpub.com/doi/10.1089/bsp.2014.0032.
81232020006804131&tlng=en. 33. Mesa Vieira C et al. (2020) COVID-19: the forgotten priorities of the pan-
28. Garnelo L, Sousa ABL and Silva C de O da (2017) Regionalização em demic. Maturitas [Internet] 136, 38–41. Available at https://linkinghub.
Saúde no Amazonas: avanços e desafios. Ciência & Saúde Coletiva elsevier.com/retrieve/pii/S0378512220302346.
[Internet] 22, 1225–1234. Available at http://www.scielo.br/scielo.php? 34. Power T et al. (2020) COVID-19 and indigenous peoples: an imperative
script=sci_arttext&pid=S1413-81232017002401225&lng=pt&tlng=pt. for action. Journal of Clinical Nursing [Internet] 29, 2737–2741.
29. da Silva JB and Muniz AMV (2020) Pandemia do Coronavírus no Brasil: Available at https://onlinelibrary.wiley.com/doi/abs/10.1111/jocn.15320.
impactos no Território Cearense. Espaço e Economia [Internet] 9(17), 1– 35. Santos RV, Pontes AL and Coimbra Jr CEA (2020) Um “fato social
20. doi: http://journals.openedition.org/espacoeconomia/10501. total”: COVID-19 e povos indígenas no Brasil. Cadernos de Saúde
30. Qiu Y, Chen X and Shi W (2020) Impacts of social and economic factors Pública [Internet] 36(10), e00268220. doi: http://www.scielo.br/scielo.
on the transmission of coronavirus disease 2019 (COVID-19) in China. php?script=sci_arttext&pid=S0102-311X2020001000201&tlng=pt.
Journal of Population Economics [Internet] 33, 1127–1172. Available at 36. Díaz de León-Martínez L et al. (2020) Critical review of social, environ-
http://link.springer.com/10.1007/s00148-020-00778-2. mental and health risk factors in the Mexican indigenous population and
31. Galea S (2017) Health haves, health have nots, and heterogeneity in popu- their capacity to respond to the COVID-19. Science of the Total
lation health. The Lancet Public Health [Internet] 2, e388–e389. Available Environment [Internet] 733, 139357. Available at https://linkinghub.else-
at https://linkinghub.elsevier.com/retrieve/pii/S2468266717301603. vier.com/retrieve/pii/S0048969720328746.
Downloaded from https://www.cambridge.org/core. IP address: 46.4.80.155, on 23 Apr 2021 at 11:37:20, subject to the Cambridge Core terms of use, available at https://www.cambridge.org/core/terms.
https://doi.org/10.1017/S0950268821000479You can also read