Hospital Competition in the National Health Service: Evidence from a Patient Choice Reform - Konkurransetilsynet
←
→
Page content transcription
If your browser does not render page correctly, please read the page content below
Rapport 7/2018

Hospital Competition in the National Health Service:
Evidence from a Patient Choice Reform
Kurt. R. Brekke, Chiara Canta, Tor Helge Holmås, Luigi Siciliani
og Odd Rune Straume

Prosjektet har mottatt forskningsmidler fra
det alminnelige prisreguleringsfondet.
Hospital Competition in the National Health Service:

                Evidence from a Patient Choice Reform

   Kurt R. Brekkey           Chiara Cantaz            Tor Helge Holmåsx          Luigi Siciliani{
                                      Odd Rune Straumek

                                        August 31, 2018

                                             Abstract

          We study the impact of exposing hospitals in a National Health Service (NHS)
      to non-price competition by exploiting a patient choice reform in Norway in 2001.
      The reform facilitates a di¤erence-in-di¤erence research design due to geographical
      variation in the scope for competition. Using rich administrative data covering the
      universe of NHS hospital admissions from 1998 to 2005, we …nd that hospitals in
      more competitive areas have a sharper reduction in AMI mortality, readmissions,
      and length of stay than hospitals in less competitive areas. These results indicate
      that competition improves patient health outcomes and hospital cost e¢ ciency, even
      in the Norwegian NHS with large distances, low …xed treatment prices, and mainly
      public hospitals.
     This project has received …nancial support from Prisreguleringsfondet administrated by the Norwe-
gian Competition Authority.
   y
     Norwegian School of Economics (NHH), Department of Economics, Helleveien 30, 5045 Bergen,
Norway; and Centre for Applied Research at NHH. E-mail: kurt.brekke@nhh.no
   z
     Toulouse Business School, 1M Place Alphonse Jourdain, 31068 Toulouse, France; and Centre for
Applied Research at NHH. E-mail: c.canta@tbs-education.fr.
   x
     NOCET
   {
     University of York, Department of Economics and Related Studies, York YO10 5DD, UK; and
C.E.P.R., 90-98 Goswell Street, London EC1V 7DB, UK. E-mail: luigi.siciliani@york.ac.uk.
   k
     University of Minho, Department of Economics/NIPE, Campus de Gualtar, 4710-057 Braga, Portu-
gal; and University of Bergen, Department of Economics. E-mail: o.r.straume@eeg.uminho.pt.

                                                  1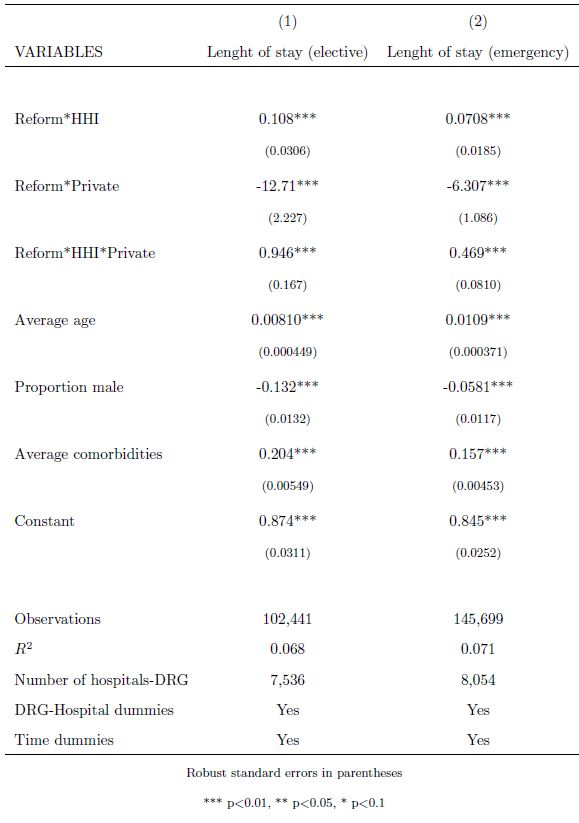
Keywords: Patient Choice; Hospital Competition; Quality; Cost-e¢ ciency
          JEL Classi…cation: I11; I18; L13

1     Introduction

Health care is one of the most important sectors in the economy. OECD countries spend

on average 9 percent of their GDP on health care (OECD, 2017). Health care is also

crucial for individuals’well-being and the health in the population more broadly. The

organisation of the delivery of health care is therefore of great importance.

    The health care sector has traditionally been, and still is, extensively regulated in

many countries, implying limited, or in some countries even no, use of market mecha-

nisms.1 This has particularly been the case in countries with a National Health Service

(NHS), such as the UK, the Scandinavian countries, and the Southern European coun-

tries. The last decades, however, many countries, including countries with a NHS, have

introduced market-oriented reforms introducing provider competition in the delivery of

health care.

    Despite the extensive adoption of market-oriented reforms across countries, there is

still a lack of strong evidence on the impact of introducing competition in the provision of

health care, especially from outside the US and England.2 Most of the existing studies,

which are based on the US Medicare program, exploit cross-sectional variation in market

structure over time to identify the impact of competition. However, a potential problem

with this approach is that market structure is not exogenous and possibly related to

hospital performance along dimensions such as quality of care.3

    In this study, we follow the approach by Cooper et al. (2011) and Gaynor et al.
   1
     There are notable exceptions, such as the US where market mechanims have been in place for a long
time for the delivery of health care.
   2
     See Gaynor and Town (2011) for an extensive overview of the literature on competition in health
care markets.
   3
     High-quality hospitals are likely to have a larger share of the market (more patients) than low-quality
hospitals. The presence of a high-quality hospital may also deter entry of new hospitals into the market.

                                                     2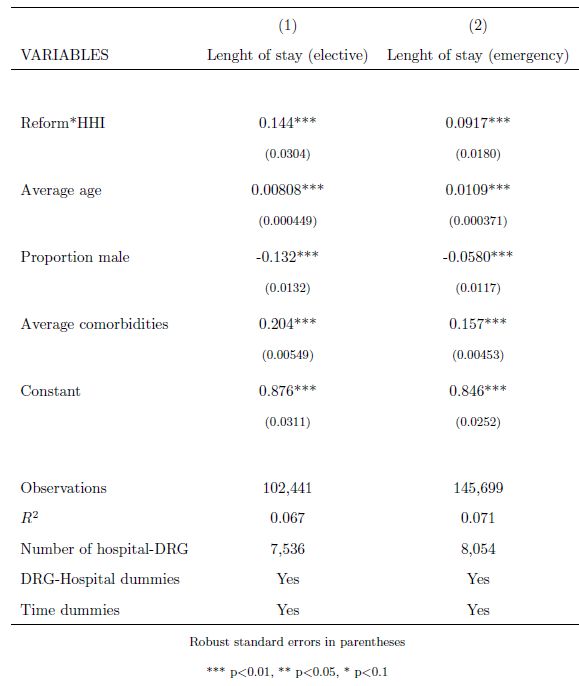
(2013), who study the impact of hospital competition by exploiting an exogenous policy

reform introducing patient choice in the English NHS in 2006. While the reform applied

to all NHS hospitals at the same time, geographical variation in market structure prior

to the reform facilitates a di¤erence-in-di¤erence (DiD) research design, where hospitals

in less competitive areas serve as a control for hospitals in more competitive areas. In

Norway there was a similar reform in 2001, where the government introduced nationwide

patient choice within the Norwegian NHS, replacing an administrative system where

patients were referred to the closest hospital o¤ering the relevant treatment within their

county of residence. The new policy therefore implied a switch from a situation where

the NHS hospitals were local monopolists in their catchment area to a scheme with

potential for non-price competition among NHS hospitals.

       While the policy reforms introducing patient choice in the English and the Norwegian

NHS are fairly similar, there are also important di¤erences across the two NHS systems

that . First, England had a gradual roll-out of their …xed price (Payment by Result)

funding scheme in the period prior to the reform, with the full scale implementation of

this scheme coinciding with the patient choice reform.4 In Norway, however, a …xed price

payment scheme based on diagnosis related groups (DRG) were in place since 1997 and

did not change before (or after) the policy reform. Second, while England implemented a

more purely …xed price scheme, Norway had a mixed payment scheme which was partly

based on …xed prices and partly on block grants. An important implication of this is

that the …xed DRG prices in Norway were cut by the share of funding that was based

on block grants, which means that Norwegian NHS hospitals were facing lower …xed

treatment prices than their English counterparts. Third, the NHS hospitals in England

are organised as free-standing trusts, whereas the majority of the NHS hospitals in

Norway are public. Following shortly after the policy reform, the public hospitals were

corporatised in Norway with ownership being transferred from county-level to state-level.
   4
    See Gaynor et al. (2013) for a more detailed description of the roll-out of the Payment by Result
scheme in the English NHS.

                                                 3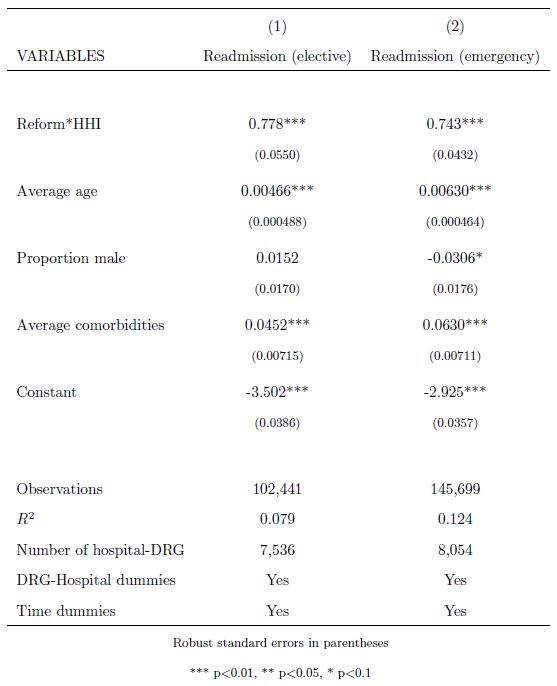
Finally, a quick glance at the map reveals that travel distances are substantially larger

in Norway than in England. Thus, the contribution of our study is to provide more

evidence on the causal e¤ects of hospital competition from outside the US and England,

and to contribute to the robustness and external validity of the …ndings in the existing

literature.

      To do so, we have assembled a rich dataset based on detailed administrative data

covering the universe of hospital admissions in the Norwegian NHS over eight years from

1998 to 2005. For the analysis, the data are aggregated to quarterly observations at

hospital and DRG level. We use a similar DiD research design as Cooper et al. (2011)

and Gaynor et al. (2013), where the reform dummy is interacted with a treatment

(competition) intensity variable speci…c for each hospital. This implies that the impact

of hospital competition is identi…ed by comparing the di¤erential e¤ects between hos-

pitals in less competitive are with hospitals in more competitive areas before and after

the reform. Treatment (competition) intensity is captured by estimating a Hirschman-

Her…ndahl Index (HHI) for each hospital based on predicted patient ‡ows prior to the

reform to account for endogenous market structure, as in Gaynor et al. (2013).5 The

e¤ects of exposing the NHS hospitals to competition are estimated controlling for time

trends, patient case mix (age, gender, comorbidities) at hospital and DRG level, and

hospital and DRG …xed e¤ects.

      Based on the DiD approach, we obtain the following results. First, we …nd that the

introduction of (non-price) competition in the Norwegian NHS, induced by the patient

choice reform, is associated with a sharper decline in acute myocardial infarction (AMI)

mortality rates for hospitals in more competitive (less concentrated) areas compare to

hospitals in less competitive (more concentrated) areas. The e¤ect is, however, modest

in that a 10 percent increase in the average HHI leads to a 1.7 percent fall in the AMI

mortality rate, implying a reduction of 40 AMI deaths per year in total among the
  5
    Cooper et al. (2013) use also HHIs based on predicted patient ‡ows, but compute these for each
period, including periods after the patient choice reform.

                                                4
Norwegian NHS hospitals. We …nd no signi…cant e¤ects on stroke or overall hospital
mortality. These pro-competitive …ndings on hospital quality are consistent with the
…ndings by Cooper et al. (2011) and Gaynor et al. (2013) from the English NHS, but
the e¤ects are more modest, which can be explained by lower …xed (DRG) prices due
to partial block grant funding, publicly owned hospitals with less pro…t orientation, or
simply longer travel distances and thus less intense competition.
Second, we …nd that the introduction of competition in the Norwegian NHS is asso-
ciated with a sharper reduction in readmission rates for hospitals in more competitive
areas compared to hospitals in less competitive areas after the reform. The e¤ect is
equally strong for both elective and emergency treatments, though the patient choice
reform only applied to elective treatments, suggesting a positive spillover e¤ect also on
emergency treatments of exposing NHS hospitals to competition. As the results for elec-
tive readmissions may potentially be biased due to changes in patient ‡ows induced by
the patient choice reform, it is ensuring that the e¤ects for emergency treatments are
similar. A readmission usually re‡ects that the …rst treatment was associated with com-
plications, implying that lower readmission rates signals higher hospital quality. Thus,
this …nding supports the pro-competitive results for AMI mortality. Cooper et al. (2011)
and Gaynor et al. (2013) do not consider the e¤ects on hospital readmissions.
Third, we …nd that the patient choice reform induced a sharper decline in length
of stay at NHS hospitals in more competitive areas compared to NHS hospitals in less
competitive areas, indicating a pro-competitive e¤ect on hospital cost e¢ ciency. As
for readmissions, the e¤ects are statistically signi…cant for both elective and emergency
treatments, suggesting a positive spillover e¤ect of the patient choice reform on emer-
gency treatments. For length of stay, we also …nd a di¤erential e¤ect of competition
depending on hospital ownership, where the private non-pro…t hospitals in the NHS
reduce length of stay more than the public hospitals, possibly re‡ecting more pro…t ori-
entation or harder budget constraints. Cooper et al. (2011) and Gaynor et al. (2013)
5…nd similar e¤ects on length of stay, but do not investigate possible di¤erential e¤ects
of ownership or for elective vs. emergency treatments.
We rationalise the …ndings in a theoretical analysis, showing that the e¤ects of (non-
price) competition, induced by patient choice, on hospital quality and cost e¢ ciency
depend on hospitals’pro…t orientation and price-cost margins. In particular, if hospitals
are pro…t oriented and face positive price-cost margins, competition will improve both
hospital quality and cost e¢ ciency. However, if hospitals are less pro…t oriented (more
altruistic) and face negative price-cost margins, then competition has in general ambigu-
ous e¤ects on hospital quality and cost e¢ ciency. Since hospitals in the Norwegian NHS
are mainly public and the …xed (DRG) prices are low due to a mixed funding scheme,
it is far from obvious that the introduction of competition would have positive quality
and cost e¢ ciency e¤ects. However, our empirical analysis identi…es, as in the English
NHS, pro-competitive e¤ects following the patient choice reform.
In summary, our study provides evidence that exposing NHS hospitals to non-price
competition saves lives, reduces complications, and shortens hospital stays, which suggest
that competition improves patient welfare and possibly also total welfare. These …ndings
are consistent with evidence from the English NHS provided by Cooper et al. (2011)
and Gaynor et al. (2013), but also with several US studies focusing on the provision of
hospital care to Medicare patients where prices are also …xed, e.g., Kessler and McClellan
(2001).6 Our study of the Norwegian NHS therefore extends the robustness and thus the
external validity of the positive e¤ects of exposing hospitals to non-price competition.
The rest of the paper is organised as follows: Section 2 explains in more detail the
relation of our study to existing literature; Section 3 presents our theoretical analysis of
hospital competition; Section 4 explains the institutional setting and the policy reforms
of the Norwegian NHS; Section 5 presents the data and descriptive statistics; Section 6
describes our empirical strategy; Section 7 presents the results; and Section 8 concludes
6
See Gaynor and Town (2011) for a review of the literature on hospital competition.
6the paper.
2 Related literature
Our paper relates primarily to the empirical literature on the impact of competition
in hospital markets.7 The evidence on the e¤ect of competition is mostly from the
US and the UK, and has mixed …ndings.8 In the US, Kessler and McClellan (2000)
…nd that AMI mortality is higher for Medicare patients in more concentrated markets.9
They also …nd that hospitals in less concentrated areas have lower expenditures when
Medicare introduced …xed (DRG) prices, and conclude that (non-price) competition
among US hospitals is welfare improving. Shen (2003) …nds that competition (measured
by the number of hospitals) interacted with the Medicare payment leads to lower AMI
mortality for Medicare patients after 1990. In contrast, Gowrisankaran and Town (2003)
…nd that AMI and pneumonia mortality rates are higher for Medicare patients in less
concentrated markets in the Los Angeles area. Mukamel et al. (2001) …nd no e¤ect
of competition (measured by concentration) on overall hospital mortality for Medicare
patients. A recent study by Colla et al. (2016) …nds that competition reduces AMI
mortality, has no e¤ect on emergency readmissions for hip and knee replacement, and
reduces quality for dementia patients in the Medicare.10
In England, Propper et al. (2004) and Burgess et al. (2008) …nd that more com-
petition increases AMI mortality in the 1990s when the internal market was introduced
7
There is also a large theoretical literature on hospital competition. Gaynor (2006) shows that pro…t-
maximising hospitals respond to competition by improving quality of care when prices are …xed, while
this e¤ect is generally ambiguous with ‡exible prices. Brekke et al. (2011) show that the positive e¤ect
of hospital competition on quality with …xed prices holds also for semi-altruistic hospitals unless the
degree of altruism is su¢ ciently high. See also Brekke et al. (2010) for a study on quality competition
with ‡exible prices.
8
See Gaynor and Town (2011) for an extensive literature review.
9
In a related paper, Kessler and Geppert (2005) …nd that the AMI mortality rate for high-risk
Medicare patients is higher in concentrated markets, while there is no such e¤ect for low-risk patients.
10
There is also an interesting strand of literature on the interaction between information and com-
petition in hospital markets. For example, Chou et al (2014) …nd that report cards on the quality of
providers reduced CABG mortality for more severely ill patients in more competitive areas.
7and hospital prices were not …xed but negotiated with local health authorities. Burgess
et al. (2008), however, …nd that competition did reduce signi…cantly waiting times, and
this may be due to purchasers negotiating mostly on waiting times rather than on clin-
ical quality. The most recent empirical literature from England …nds that competition
increases quality. Bloom et al. (2015) instrument for competition with the marginality
of local Parliamentary seats and …nd that hospitals in more competitive areas had lower
AMI mortality. Cooper et al. (2011) and Gaynor et al. (2013) …nd, as mentioned previ-
ously, that hospitals in more competitive areas had sharper reductions in AMI mortality
following the patient choice reform of 2006. Gaynor et al. (2013) also found that com-
petition reduced length of stay but did not a¤ect expenditure or volume of admissions.
Feng et al. (2015) …nd that competition is positively associated with health gains for
hip replacement patients, where the health gain is measured by the di¤erence in patient
reported health outcomes (PROMs) before and after the surgery. Cooper et al. (2016)
…nd that the entry of a private hospital in the NHS market reduced pre-operative length
of stay for hip and knee replacement patients. For Italy, Berta et al. (2016) …nd that
competition does not a¤ect quality.
The contribution of our study to this literature is two-fold. First, we contribute to the
existing literature by providing causal evidence on the impact of hospital competition by
exploiting an exogenous policy reform in the Norwegian NHS, taking the same approach
as Cooper et al. (2011) and Gaynor et al. (2013). This approach deals with the
endogeneity of market structure that possibly a¤ects the estimates in studies using cross-
sectional variation in market concentration over time. Second, our study contribute to
the external validity of the e¤ects of hospital competition by providing evidence from
outside the US and England. Compared to the US, the institutional setting in the
Norwegian NHS is very di¤erent along many dimensions, including ownership structure,
use of market mechanisms, extent of ‡exible vs. …xed prices, etc. Compared to the
English NHS, the institutional setting in the Norwegian NHS is also di¤erent along a
8few dimensions, including the level of the …xed prices, the ownership structure, and the
geographic distribution of hospitals and patients. Despite low …xed (DRG) prices, public
hospitals, and long travel distances, we still …nd positive e¤ects of competition on hospital
quality and cost e¢ ciency, indicating a welfare improvement of the reorganisation of the
delivery of health care. In the next section, we present mechanisms that might possibly
explain these …ndings.
3 Theory
Suppose that there are two hospitals, denoted by subscripts i and j, in a given market
for secondary health care.11 Demand for Hospital i, measured by number of treatments,
is given by xi (qi ; qj ; ), where qk q is the quality of Hospital k = i; j. The lower bound
on hospital quality represents the minimum treatment quality hospitals are allowed to
o¤er, implying that q < q can be interpreted as malpractice. We assume that xi is
increasing in qi and decreasing in qj . The e¤ect of competition is captured by the
parameter , which measures the degree of patient choice, implying that a higher value
of represents a market with more competition. We assume that @xi =@ > (
( 0, implying that patient choice makes demand for each hospital
more responsive to quality changes. This is, intuitively, the key e¤ect of competition in
markets where the providers compete on quality.
The objective function of Hospital i is assumed to be given by
i = T + pxi (qi ; qj ; ) c (xi (qi ; qj ; ) ; qi ; ei ) + Bi (xi (qi ; qj ; ) ; qi ) g (ei ) : (1)
11
As long as the market is symmetric, the analysis can easily be extended to n hospitals. However,
only two hospitals are needed in order to illustrate all the potential mechanisms at play.
9The hospital payment system is characterised by the contract (p; T ), where each hospital
receives a …xed price p per treatment and a lump-sum payment T . Total treatment costs
are given by a cost function c ( ) which depends on the total number of treatments (xi ),
quality (qi ) and the amount of cost-containment e¤ort (ei ) exerted by the hospital.
We assume that, by spending more e¤ort on cost containment, the hospital can (i)
reduce the total costs of a given treatment volume and quality provision (@c=@e < 0),
(ii) reduce the marginal cost of treatments (@ 2 c=@ei @xi < 0) for a given quality level
and (iii) possibly also reduce the marginal cost of quality provision for a given treatment
volume (@ 2 c=@ei @qi 0). The disutility of exerting cost-containment e¤ort is given by
a strictly convex function g (ei ).
We also assume that the providers are semi-altruistic in the sense that patient utility
is part of the hospitals’objectives. More speci…cally, we assume that the decision-makers
at Hospital i to some extent take into account the total utility of patients treated at the
hospital, given by Bi ( ), which is increasing in xi and qi . The degree of altruism is cap-
tured by the parameter , implying that a purely pro…t-oriented hospital is characterised
by = 0.
Suppose that the two hospitals play a non-cooperative game where they simultane-
ously choose quality and cost-containment e¤ort. The …rst-order conditions for Hospital
i are given by
@ i @xi @c @xi @c @Bi @xi @Bi
=p + + = 0; (2)
@qi @qi @xi @qi @qi @xi @qi @qi
@ i @c @g
= = 0: (3)
@ei @ei @ei
We consider a symmetric equilibrium with interior solutions, where qj = qi > q and
ej = ei > 0. The Nash equilibrium is then characterised by the following 2-equation
10system:
@ i
Fq := = 0; (4)
@qi qj =qi ;ej =ei
@ i
Fe := = 0: (5)
@ei qj =qi ;ej =ei
We are interested in characterising how more competition (increased patient choice,
measured by ) a¤ects equilibrium quality provision and cost e¢ ciency. Di¤erentiation
of (4)-(5) yields 2 32 3 2 3
@Fq @Fq @Fq
6 @qi @ei 7 6 dqi 7 6 @ 7
4 54 5+4 5 d = 0; (6)
@Fe @Fe @Fe
@qi @ei dei @
where equilibrium existence requires @Fq =@qi < 0, @Fe =@ei < 0 and := (@Fq =@qi ) (@Fe =@ei )
(@Fe =@qi ) (@Fq =@ei ) > 0, and where
@Fq @ 2 c @xi @2c
= ; (7)
@ei @ei @xi @qi @ei @qi
@Fe @ 2 c @ (xi + xj ) @2c
= ; (8)
@qi @xi @ei @qi @qi @ei
@Fq @c @Bi @ 2 xi
= p + ; (9)
@ @xi @xi @ @qi
and
@Fe
= 0: (10)
@
The symmetry assumption has two implications that that are important for the deriva-
tion of (7)-(10). First, when both hospitals provide the same quality level, patient choice
has no direct e¤ect on demand; i.e., @xi =@ = 0. Second, notice that
@xi @xi @xi @xi @xj @ (xi + xj )
= + = + = : (11)
@qi qj =qi @qi @qj qj =qi @qi @qi @qi
113.1 Competition and quality provision
Applying Cramer’s Rule on (6), the e¤ect of competition on equilibrium quality provision
is given by
@qi 1 @Fe @Fq @Fq @Fe
= : (12)
@ @ @ei @ @ei
Since > 0, @Fe =@ei < 0 and @Fe =@ = 0, we have
@qi @Fq
sign = sign ; (13)
@ @
which implies that
@qi @c @Bi
> ( ( q. Thus, the condition in (14) needs
to be seen in conjunction with the …rst-order condition for optimal quality provision,
given by (2).12 For this purpose, it is useful to re-write (2) as follows:
@c @Bi @xi @Bi @c
p + + = ; (15)
@xi @xi @qi @qi @qi
Comparing (14) and (15), we see that the sign of @qi =@ is given by the sign of the …rst
term on the left-hand side of (15).
Consider …rst the special case of purely pro…t-oriented hospitals (i.e., = 0). It is
evident from (15) that, if an interior solution exists, each hospital will choose a quality
level that implies a positive price-cost margin (i.e., p @c=@xi > 0). This implies, from
(14), that @qi =@ > 0. Because of continuity, this result holds also for su¢ ciently small
12
These conditions represent a generalised version of the main result derived in Brekke et al. (2011),
where competition is explicitly modelled as a switch from local monopolies to localised competition in a
spatial framework.
12values of . Thus, if the degree of altruism is su¢ ciently low, competition leads to higher
quality.13 The intuition behind this result is straightforward. If the marginal patient is
pro…table to treat, a su¢ ciently pro…t-oriented hospital will react to competition (which
implies a more quality-elastic demand) by increasing quality in order to attract more
patients.
However, a su¢ ciently high degree of altruism might introduce a counteracting incen-
tive. All else equal, altruism stimulates incentives for quality provision. This creates not
only a larger scope for the existence of an interior-solution equilibrium, but it also creates
a scope for an interior solution with a negative price-cost margin (i.e., p @c=@xi < 0).
In this case, competition has two counteracting e¤ects on the incentives for quality pro-
vision. On the one hand, hospitals have an incentive to ‘compete’ to avoid treating
unpro…table patients (since p @c=@xi < 0), implying lower quality. On the other hand,
the presence of semi-altruistic preferences creates an incentive for ‘altruistic competition’
to treat more patients, implying higher quality. Overall, competition will lead to less
quality provision in equilibrium if the former e¤ect is stronger than the latter. From
(14)-(15) we see that the scope for a negative relationship between competition and
quality (i.e., @qi =@ < 0) is larger if p is relatively low, and if @Bi =@qi is large relative to
@Bi =@xi (i.e., if the hospitals care more about the quality o¤ered to patients than how
many patients are treated).
13
Alternatively, if an interior solution does not exist, i.e., if
@c @Bi @xi @Bi @c
p + + <
@xi @xi @qi @qi @qi
for all qi q, each hospital will choose quality at the minimum level and (a marginal increase in)
competition has no e¤ect on equilibrium quality provision.
133.2 Competition and cost e¢ ciency
Applying once more Cramer’s Rule to (6), the e¤ect of competition on equilibrium cost-
containment e¤ort is given by
@ei 1 @Fe @Fq @Fq @Fe
= : (16)
@ @qi @ @qi @
Since > 0 and @Fe =@ = 0, we have
@ei @Fe @Fq @Fe @qi
sign = sign = sign : (17)
@ @qi @ @qi @
Thus, under the condition @Fe =@qi > 0, competition leads to higher (lower) cost e¢ -
ciency if it also leads to higher (lower) quality provision. The condition @Fe =@qi > 0
requires that either (i) higher quality provision leads to higher total demand for hospital
treatment, i.e., @ (xi + xj ) =@qi > 0, or (ii) more cost-containment e¤ort reduces the
marginal cost of quality provision for a given treatment volume, i.e., @ 2 c=@ei @qi < 0.
If (i) holds, a positive relationship between competition and quality provision implies
that competition also leads to a higher treatment volume at each hospital, which gives
each hospital a stronger incentive to increase the pro…t margin by reducing marginal
treatment costs. If (ii) holds, a positive relationship between competition and quality
provision also gives each hospital a stronger incentive to reduce the marginal cost of
quality provision through cost-containment e¤ort. Obviously, the logic is reversed for
the case of a negative relationship between competition and quality provision. Thus, if
(i) and/or (ii) holds, quality and cost-containment e¤ort are complementary strategies
for each hospital. On the other hand, if total demand for hospital treatment is …xed
and if it is not possible to reduce the marginal cost of quality provision through cost-
containment e¤ort, then competition has no e¤ect on hospital cost e¢ ciency.
144 Institutional background and NHS reforms
Norway has a mandatory health insurance scheme provided by the government and
…nanced through general taxation. Almost all health care is provided by the National
Health Service (NHS) with only a very limited private provision alongside. Primary care
is provided by publicly funded physicians, so-called general practitioners (GPs), that are
gatekeepers, implying that patients need a referral to access secondary care. Secondary
care is provided by NHS hospitals. During our analysis period from 1998 to 2005, there
are in total 64 NHS hospitals in Norway with 58 being public and 6 private non-pro…t.
Figure 1 shows the geographical distribution of the 64 hospitals in the Norwegian NHS,
revealing substantial variation in the density of hospitals across the country, with highest
(lowest) hospital density in Eastern (Northern) Norway.
FIGURE 1: Distribution of NHS hospitals in Norway, 1998 - 2005
The NHS hospitals are funded by a combination of block grants and …xed prices
per patient (treatment). The block grant payment is a sort of capitation scheme (risk-
15adjusted …xed payment per inhabitant in the catchment area), whereas the …xed prices
are based on the diagnosis related groups (DRG) system. The mixed funding scheme,
which was introduced in 1997 in the Norwegian NHS, implies that the …xed DRG prices
are cut according to the relative share of block grant and …xed price funding. During
the analysis period, the share of the …xed DRG price funding ‡uctuates between 40 to
60 percent, as shown in Figure 2. Thus, the NHS hospitals receive between 40 to 60
percent of the …xed treatment prices, which are set equal to the average cost across NHS
hospitals within each DRG, during this period.
FIGURE 2: Fixed (DRG) price share of total hospital funding, 1998 to 2005.
Health care within the NHS is almost free at the point of use. For hospital care, there
are virtually no patient copayments. For primary care, patients are charged copayments,
but only up to an annual expenditure cap, which was less than NOK 2000 (£ 200 or $250)
during the period 1998 to 2005. After the cap is reached, there is 100 percent insurance
coverage for all additional copayments. However, as common in NHS systems, access to
secondary care is rationed through waiting lists.
Motivated by large di¤erences in waiting lists across geographical regions, the Nor-
wegian government introduced a patient choice reform in the NHS in 2001, replacing an
administrative system where GPs automatically referred patients to the closest hospital
16o¤ering the relevant treatment within their county of residence. The reform changed this
system drastically, as patients were entitled with the right to choose among any NHS
hospital across the whole of Norway for elective (non-acute) treatments. Since Norway
is a wide country with large distances, the government also allowed for reimbursement
of travel expenditures to stimulate the exercise of patient choice within the NHS. A sep-
arate website was also set up with information on quality indicators and waiting time,
so that patients, and perhaps more importantly their GPs, could make informed choices
of hospital.
Following the patient choice reform, the public hospitals were corporatised into so-
called state-owned health enterprises, and ownership was transferred from the county-
level to the state-level. The motivations behind this ownership reform, which was imple-
mented in 2002, were mainly to enforce harder budgets and reduce the political in‡uence
on the governance of the public hospitals. The public hospitals were also given more
…nancial autonomy, including the possibility of transferring surpluses (or de…cits) across
years. Norway was also divided into …ve health regions each with a regional health
authority governing the provision hospital care within their health region, which were
previously done by 19 county administrations prior to the reform. Thus, public hospi-
tals were given more autonomy and …nancial ‡exibility, which could make them more
responsive to patient choice, as gain (loss) of patients would increase (reduce) revenues.
Notably, the reforms in the Norwegian NHS have clear parallels to the reforms in the
English NHS studied by Cooper et al. (2011) and Gaynor et al. (2013), which allow for
comparison of results.
5 Data and descriptive statistics
To analyse the e¤ects of exposing NHS hospitals to competition, we have assembled a
rich database with panel information at the hospital and DRG level on a wide set of
17variables, including mortality, readmission, length of stay, hospital characteristics, pa-
tient characteristics, etc. The primary data source is the Norwegian Patient Registry
(NPR), which covers the universe of hospital episodes in the Norwegian NHS.14 From
this registry we have obtained detailed patient level information over a period of eight
years from 1998 to 2005, comprising around 250,000 admissions in 64 hospitals. For each
hospital episode, we observe a set of patient characteristics (age, gender, comorbidities,
municipality of residence, etc.), treatment characteristics (date of admission, diagnosis,
DRG, emergency or elective, regular admission or readmission, etc.), and hospital char-
acteristics (university, regional or local hospital, address, ownership status, etc.). Since
the data include patient and hospital identi…ers, we can compute travel distances and
patient ‡ows by using a distance matrix containing information in terms of kilometers
and time. All hospitals in our sample provide emergency treatments, leaving us with
a sample of 64 hospitals, where 6 are private non-pro…t and the residual 58 are public.
However, for the analysis of AMI and stroke mortality, we exclude hospitals with very
few patients in order to avoid the problem of variability of rates from small denomina-
tors, reducing our sample to 61 hospitals. The data are aggregated such that the unit
14
More information is available on the webpage of the Norwegian Directorate of Health:
https://helsedirektoratet.no/english/norwegian-patient-registry
18of observation is at hospital level or hospital-DRG level per quarter.
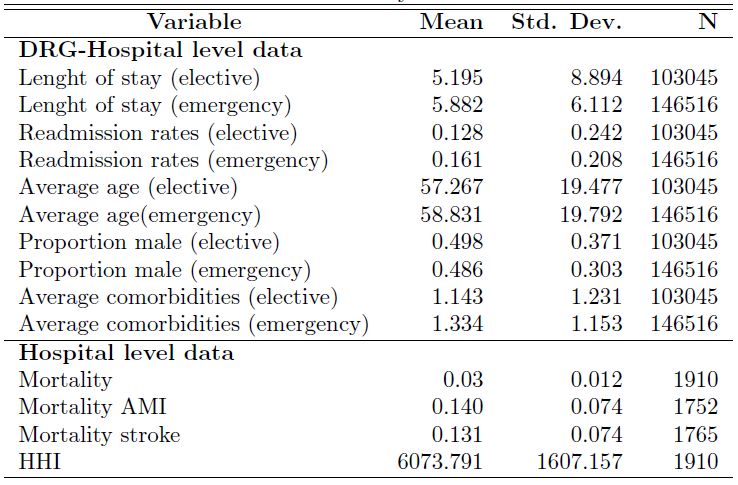
TABLE 1: Descriptive statistics
Table 1 presents the summary statistics of all variables used in the regressions. The
average hospital in our sample has a length of stay of 5:2 and 5:9 days for elective and
emergency patients, respectively. 12:8 percent of elective patients are readmitted to
the hospitals, whereas the same …gure for emergency patients is 16:1 percent. Patients
receiving emergency (elective) treatment are on average 58:8 (57:3) years old, 48:6 (49:8)
percent men, and have on average 1:3 (1:1) comorbidities. Thus, emergency patients
appear to be slightly more severe than elective patients. Furthermore, the average
hospital in our sample has an overall mortality rate of 3 percent, AMI mortality rate of 14
percent, and stroke mortality rate of 13:1 percent. These are in-hospital mortality rates.
We would have liked to also have information on post-hospital discharge mortality rates
(e.g., 30 day AMI mortality rate), but this was not available for us during this period.
However, most studies do …nd similar e¤ects for both in-hospital and after discharge
19mortality rates.15 Finally, the Hirschman-Her…ndahl Index (HHI) at 6073 implies a
fairly high degree of market concentration in the Norwegian NHS. We compute the HHI
at hospital level based on patient ‡ows, which will be described in more detail below.
6 Empirical strategy
To estimate the e¤ects of competition on hospitals’provision of care, we exploit a policy
reform introducing nation-wide patient choice in Norway in January 2001 for elective
(non-acute) treatments. The new scheme replaced an administrative system where GPs
were obliged to referred patients to the closest NHS hospital within the county of resi-
dence. After the reform, patients (or the GPs acting as the patients’agent) can choose
among any NHS hospital in Norway, depending on their preferences regarding location,
quality, waiting time, etc. Since prices are regulated and copayments are basically zero
for hospital care within the NHS, the patient choice reform possibly induces non-price
competition among the NHS hospitals in Norway.
Based on the theoretical analysis in Section 2, we predict that the introduction of
(or simply harder) non-price competition induces hospitals to improve their quality of
care if they are su¢ ciently pro…t oriented and face a positive price-cost margin (i.e., the
regulated DRG price exceeds the marginal cost). However, if hospitals are su¢ ciently
patient utility oriented (altruistic), the e¤ect of competition is generally ambiguous.
Indeed, in the case of a negative price-cost margin, the introduction of competition may
have adverse e¤ects on hospitals’incentives to improve quality of care. We also identify
a positive relationship between quality and cost-containment e¤ort, implying that the
e¤ect of competition on hospitals’ cost e¢ ciency is qualitatively similar to the e¤ect
on quality. The predictions from the theoretical analysis in Section 2 can therefore be
15
See, for instance, Kessler and McClellan (2001) and Gaynor et al. (2013).
20summarised as follows:
TABLE 2: Predicted e¤ects of hospital competition on quality and cost e¢ ciency
Hospital preferences
Pro…t oriented Patient utility oriented
Price-cost Positive + +
margin Negative 0
The majority of hospitals in the Norwegian NHS have public ownership, which makes
it less obvious that pro…t maximisation is their key objective. Moreover, the mixed
hospital payment scheme with partly block grant funding implies a signi…cant cut in
the DRG prices (around 50 percent), which may result in negative price-cost margins,
especially if hospitals operate close to their capacity limits. These observations suggest,
according to our theoretical predictions, that the e¤ect of introducing competition in
the Norwegian NHS is an open, and indeed empirical, question.
Our empirical strategy to identify the e¤ects of competition on hospitals’provision
of care builds on the work by Cooper et al. (2011) and Gaynor et al. (2013). The idea is
simply that while the treatment (i.e., the reform introducing competition) is common to
all NHS hospitals, the intensity of the treatment (i.e., the scope for competition) varies
signi…cantly across geographical regions depending on the distribution of patients and
hospitals. This feature facilitates a di¤erence-in-di¤erence (DiD) research design, where
the e¤ects of competition are identi…ed by using hospitals located in areas with limited
or no scope for competition as the counterfactual.
A key issue, though, is to obtain a treatment (or competition) intensity measure
for each hospital. We follow the approach taken by Kessler and McClellan (2001) by
estimating a predicted Her…ndahl-Hirschman index (HHI) for each hospital based on
individual patient ‡ow information. This approach is also adopted by Cooper et al.
21(2011) and Gaynor et al. (2013). A key di¤erence in their approaches is that Cooper
et al. (2011) use instantaneous HHIs based on patient ‡ows in each period both before
and after the English patient choice reform, whereas Gaynor et al. (2013) use only a
pre-reform HHIs based on patient ‡ows for a given year prior to the reform. As patient
‡ows after the reform are likely to depend on quality di¤erences between hospitals, we
take the same approach as Gaynor et al. (2013) in order to avoid possible endogeneity
issues when estimating the e¤ects of hospital competition.
To derive the predicted HHIs for each hospital, we …rst estimate the probability that
patient i chooses hospital h out of a total of H hospitals using the following conditional
logit model at individual patient level
exp( + 1 kmih + 2 minih + 03 kmih Xi + 04 minih Xi )
Pih = PH 0 0
; (18)
l=1 exp( + 1 kmil + 2 minil + 3 kmih Xi + 4 minih Xi )
where kmih is the distance in kilometers from patient i’s municipality of residence to
the municipality where hospital h is located, and minih is the same distance measured
in minutes of travel. We also include the interactions between distance measures and a
vector of patient characteristics (age and gender) denoted by Xi . To reduce computa-
tional complexity, we include in the choice set of each patient only the hospital where the
patient was treated and the four closest hospitals where the patient did not get treated.
The estimates are derived using data from 1998, which is our …rst year of observation
prior to the patient choice reform.
Based on the estimated individual patient choice probabilities, we compute the
hospital-speci…c HHIs following the same two-step procedure as in Cooper et al. (2011)
and Gaynor et al. (2013). First, the HHI in each municipality is calculated as the sum
of squared patient shares across all hospitals where the residents in the municipality
migrates to for all elective care.16 Second, the HHI for each hospital is calculated as
16
Our analysis is based at municipality level, which are larger areas than the de…ned neighbourhoods in
Cooper et al. (2011) and Gaynor et al. (2013) and zip-codes in Kessler and McClellan (2001). However,
22a weighted average of the HHIs for the municipalities severed by the hospital, where
the weights are the shares of the hospital’s patients that live in each municipality. We
calculate hospital-speci…c HHIs based on both actual and predicted patient ‡ows.
FIGURE 3: Kernel density estimates for the distribution of actual and predicted HHIs
Figure 3 displays the kernel densities for the predicted HHIs (based on patient ‡ow data
from 1998) and the actual HHIs (based on patient ‡ow data from 1998 to 2005).17 The
predicted HHIs tends to be more concentrated than the actual HHIs, which may be due
to changes in the actual patient ‡ows induced by hospital competition after the patient
choice reform in 2001. Since hospital-speci…c HHIs based on actual patient ‡ows are
likely to be endogenous, we use only HHIs based on predicted patient ‡ows prior to the
reform (year 1998) as the treatment (competition) intensity measure in the analysis.
As explained above, we apply a DiD approach to estimate the e¤ect of competition on
there are more than 400 municipalities in Norway which implies an average population size of around
45,000 inhabitants.
17
The correlation between the two measures is 0:39.
23hospitals’care provision, where the predicted pre-reform HHIs (speci…c for each hospital)
are interacted with a post-reform dummy (common to all hospitals). The predicted pre-
reform HHIs are treatment intensity dummies, re‡ecting the intensity of competition
each hospital is facing after the reform. This approach implies that we are essentially
estimating the change in hospital quality and cost-e¢ ciency before and after the reform,
using hospitals located in less competitive areas as a control group. We estimate the
following DiD regression model
0
Yhdt = hd + t + (Dt HHIh ) + Xhdt + "hdt ; (19)
where h denotes the hospital, d the DRG, and t the quarter. Yhdt is the dependent
variable of interest, which is either readmission rates, mortality rates (AMI, stroke,
and overall), or length of stay. Dt is a post-reform dummy taking the value 1 for all
periods after the reform was implemented in January 2001 and 0 otherwise. HHIh is
the predicted pre-reform HHIs speci…c for each hospital that are interacted with the
post-reform dummy. Thus, is the DiD coe¢ cient capturing the e¤ect of introducing
competition among the NHS hospitals.
In the regression, we also include hospital-DRG …xed e¤ects ( hd ) that control for
unobserved (and observed) hospital and treatment speci…c heterogeneity which are in-
variant over time. This implies that the e¤ects of competition are estimated using only
within hospital and DRG variation over time in our outcome variables. For overall mor-
tality, we include only hospital …xed e¤ects due to very low (often zero) mortality rates
for many of the DRGs. For AMI and stroke mortality, we exclude hospitals that treat
less than three patients in each quarter. The regression model also includes time dum-
mies ( t ) to control for time trends in our outcome variables, and a vector of observed
0 ) of each hospital’s patient population (average age, gender and co-
characteristics (Xhdt
morbidity at DRG level) which vary over time. This implies that we control for changes
24in the composition of each hospital’s patient population that may possibly be induced
by changes in patient ‡ows after the policy reform. Finally, "hdt is random noise.
7 Results
Our theoretical analysis in Section 2 demonstrates that the e¤ects of exposing hospitals
to (non-price) competition through patient choice are generally ambiguous. If hospitals
are su¢ ciently pro…t motivated and face a positive price-cost margin, competition is
likely to improve hospital quality and cost-e¢ ciency. However, if hospitals face negative
price-cost margins, competition may have adverse e¤ects, especially when hospitals are
highly altruistic. The impact of (non-price) competition on hospitals’provision of care
is therefore an empirical question. This is particularly the case for the Norwegian NHS
with mainly public hospitals facing relatively low DRG prices due to a mixed funding
scheme. In this section we report the results from our empirical analysis, described in
the previous section, on the impact of hospital quality and cost e¢ ciency. By the end,
we also report results on whether hospital ownership matters for the e¤ects of exposing
hospitals to (non-price) competition by exploring di¤erential e¤ects on public and private
(non-pro…t) hospitals.
7.1 Hospital quality
Hospital quality is measured by both mortality and readmission, where a reduction in
mortality and readmission rates indicate higher quality. For mortality, we use AMI and
stroke mortality rates, which are acute illnesses with a non-negible change of death,
as well as overall mortality rates. While mortality rates are measured at the hospital
level, readmissions are measured at the hospital-DRG level, as explained above. For
readmissions, we also estimate the e¤ects separately for acute and elective treatments,
where the former is less exposed to endogeneity issues related to changes in the patient
25population induced by the patient choice reform. This is also a main argument for
focusing on AMI and stroke mortality.
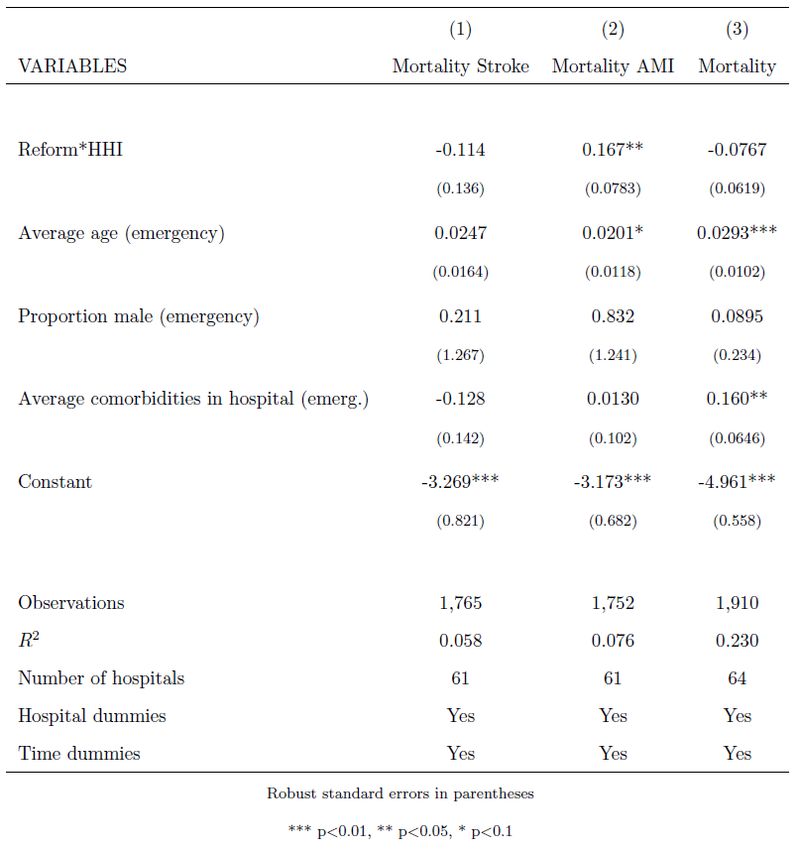
TABLE 3: DiD estimates of the impact of competition on hospital mortality
Table 3 reports our DiD estimates of the impact of exposing NHS hospitals to com-
petition on hospital quality measured by (in-hospital) mortality rates. The estimates
control for time trends, patient population charateristics, and hospital …xed e¤ects. The
…rst column presents the estimates for stroke mortality, the second for AMI mortality,
and the third for overall hospital mortality. While the DiD coe¢ cients for stroke and
overall mortality are small and statistically insigni…cant, we …nd a positive and statisti-
26cally signi…cant e¤ect on AMI mortality. The DiD coe¢ cient implies that a 10 percent
fall (i.e., 600 points reduction) in the HHI is associated with a 1:67 percent fall in the
AMI mortality. This amounts to a reduction of 0:23 percentage points at the mean AMI
mortality rate of 14 percent in the sample, implying around 40 fewer deaths in total per
year across the 61 NHS hospital in the sample. These …ndings are in line with Cooper
et al. (2011) and Gaynor et al. (2013), though the magnitude of the e¤ects are slightly
smaller in our study.18 This can be due to weaker incentives for competition in the Nor-
wegian NHS than in the English NHS because of the mixed payment scheme (implying a
lower DRG price) or simply longer travel distances. However, we do not …nd any adverse
quality e¤ects of exposing the NHS hospitals to competition, which, according to our
theoretical analysis, indicates that the Norwegian hospitals are concerned about pro…ts
18
Gaynor et al. (2013) also report a signi…cant positive DiD estimate for overall mortality, but the
coe¢ cient is very small.
27and face non-negative price-cost margins.
TABLE 4: DiD estimates of the impact of competition on hospital readmissions
Table 4 reports our DiD estimates of the e¤ect of competition on hospital readmission
rates. The estimates control for time trends, patient population charateristics, and
hospital-DRG …xed e¤ects. The …rst column presents the estimates for readmissions for
elective treatments, whereas the second column presents the estimates for emergency
treatments, which are less likely to be prone to selection issues due to changes in patient
‡ows after the policy reform. The DiD coe¢ cients indicate a positive signi…cant e¤ect of
market concentration on both emergency and elective readmission rates. The estimated
28coe¢ cients imply that a 10 percent fall in a hospital’s HHI on average results in a 7:4
(7:8) percent fall in the emergency (elective) readmission rates. These …ndings indicate
that exposing the NHS hospitals to (stronger) competition reduces the underlying risk
of being readmitted, which is an indicator for better hospital quality. These e¤ects are
estimated using only within hospital and DRG variation.
7.2 Hospital cost-e¢ ciency
We also examine whether the pro-competition reform had any impact on hospital cost
e¢ ciency measured by mean length of stay. While competition may not have a direct
impact on incentives to expend e¤ort on reducing treatment costs, there may be indirect
e¤ects through the impact of competition on quality, as described in Section 2. In
particular, the incentive to improve cost e¢ ciency and thus the pro…t margin is increasing
in a hospital’s demand, which implies that quality and cost-containment incentives are
complementary strategies. Thus, to the extent that competition induces higher quality
29and in turn demand, we expect to …nd a positive e¤ect on (mean) length of stay.
TABLE 5: DiD estimates of the impact of competition on length of stay
Table 5 reports our DiD estimates of the e¤ect of competition on hospital cost e¢ -
ciency measured by mean length of stay. The estimates control for time trends, patient
population charateristics, and hospital-DRG …xed e¤ects. The …rst column presents the
estimates for mean length of stay for elective treatments, whereas the second column
presents the estimates for mean length of stay for emergency treatments, which are less
likely to be endogenous due to changes in patient ‡ows after the reform. The DiD coe¢ -
cients are positive and signi…cant for mean length of stay for both elective and emergency
30treatments, with the e¤ect being slightly stronger for elective treatments. The estimates
imply that a 10 percent fall in the HHI on average results in a 0:9 (1:4) percent fall in
the mean length of stay for emergency (elective) treatments. At the mean length of stay
in the sample of 5:9 (5:2) days for emergency (elective) treatments, this amount to a
reduction of 1:3 (1:8) hours per emergency (elective) treatment.
7.3 Hospital ownership: public vs. private
Finally, we examine whether hospital ownership matters for the e¤ects of the pro-
competition reform in the Norwegian NHS. In particular, we analyse whether private
(non-pro…t) hospitals in the NHS respond di¤erently to competition than their public
counterparts. There are only six private non-pro…t hospitals in the NHS in the period, so
the results need to be interpreted with some caution. To analyse the potential ownership
e¤ect, we estimate the following regression model:
0
Yhdt = hd + t + (Dt HHIh ) + (Dt Ph ) + (Dt HHIh Ph ) + Xhdt + "hdt ; (20)
where Ph is a dummy variable taking value one if the hospital is private and zero oth-
erwise (it is equal to one in 9,983 observations).19 is the coe¢ cient capturing the
di¤erential ownership e¤ect of exposing hospitals to competition, where the ownership
dummy is interacted with the reform dummy and the pre-reform HHIs for each hospital.
The estimates for mortality and readmission are not statistically signi…cant. However,
we do …nd di¤erential e¤ects of competition depending on hospital ownership for length
19
One of the six private hospitals changed ownership and became public in 2003 (Orkdal hospital).
For this hospital, the dummy P takes value 1 only until December 2002.
31of stay. These results are reported in Table X.
TABLE 6: DiD estimates of di¤erential ownership e¤ect of competition on length of stay
The coe¢ cients capturing di¤erential ownership e¤ects are positive and statistically
signi…cant, indicating that the private non-private hospitals respond on average more
strongly to competition by reducing length of stay more than the public NHS hospitals.
The e¤ect is slightly stronger for elective treatments than for emergency treatments,
but this can be partly driven by endogenous changes in patient ‡ows after the reform,
32though we control for changes in each hospital’s patient population (age, gender and
comorbidity). It is therefore comforting that we observe similar e¤ects in the length
of stay for emergency treatments. In any case, these results indicate that both public
and private (non-pro…t) hospitals respond to competition by improving quality and cost
e¢ ciency, with the private hospitals being slightly more responsive in terms of cost
e¢ ciency. According to our theoretical analysis, this can be explained by stronger pro…t
motivation and/or higher price-cost margins.
8 Concluding remarks
In this paper we have studied the impact of introducing (non-price) competition among
hospitals in the NHS on the provision of care. Our empirical analysis exploits a policy
reform that implemented nationwide patient choice in the Norwegian NHS in 2001, re-
placing an administrative scheme where patients were allocated to the closest hospital
within their county of residence. The reform facilitates a DiD research design due to
exogenous variation in the scope for competition based on the geographical distribution
of hospitals and patients. To capture this variation in market structure, we compute a
HHI for each hospital based on (predicted) patient ‡ows prior to the policy reform using
individual patient level data. Using rich administrative data with quarterly information
over eight years from 1998 to 2005, we estimate the e¤ects of exposing NHS hospitals
in Norway to competition on hospital quality (mortality and readmission) and cost ef-
…ciency (length of stay), controlling for time trends, patient population characteristics,
and hospital and DRG …xed e¤ects.
The results show that hospitals in more competitive areas have a sharper reduction in
AMI mortality rates, readmission rates, and length of stay than hospitals in less competi-
tive areas after the policy reform. The estimates for stroke and overall hospital mortality
are small and not statistically signi…cant. We also …nd that the private non-pro…t hos-
33You can also read