NHSScotland Workforce - LATEST STATISTICS AT 31 MARCH 2021 - An Official Statistics publication for Scotland - Turas Data Intelligence
←
→
Page content transcription
If your browser does not render page correctly, please read the page content below

NHSScotland Workforce
                            LATEST STATISTICS AT 31 MARCH 2021

An Official Statistics publication for Scotland

Publication date: 1 June 2021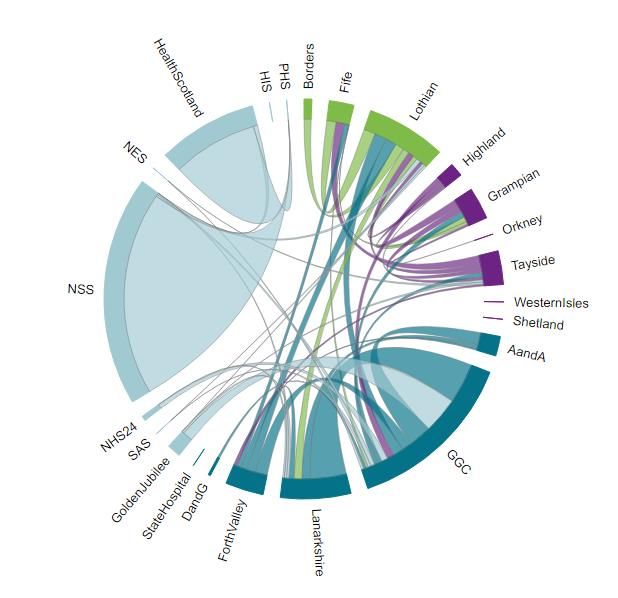
This is an Official
Statistics Publication
NHS Education for Scotland (NES) was named as a provider of Official Statistics in The Official Statistics
(Scotland) Amendment Order 2019. The following statistics have been produced in compliance with the UK
Statistics Authority’s Code of Practice for Statistics.

Find out more about the Code of Practice at:
https://www.statisticsauthority.gov.uk/osr/code-of-practice/

                                                          i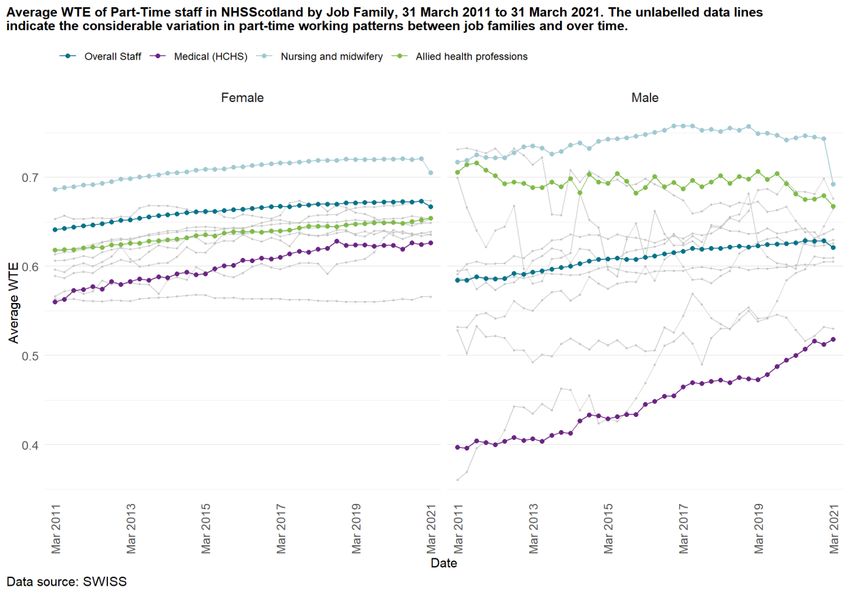
Contents
1.      Executive Summary ................................................................................................................... iii

2.      Introduction ............................................................................................................................... 1

     2.1.      Workforce data and information ............................................................................................................... 1

3.      The Workforce ............................................................................................................................ 3

     3.1.      Staff in Post ................................................................................................................................................ 3

     3.2.      Vacancies ................................................................................................................................................... 5

     3.3.      Other Workforce Indicators ....................................................................................................................... 7

4.      Challenges of COVID-19 for NHSScotland Workforce Data ............................................................. 17

5.      Data Group Discovery Work ....................................................................................................... 18

     5.1.      Time series ............................................................................................................................................... 19

     5.2.      Pharmacy Workforce Machine Learning Model ...................................................................................... 22

     5.3.      Spatial analysis: Understanding the role of space in the workforce ...................................................... 25

     5.4.      Turnover ................................................................................................................................................... 28

6.      Appendix 1: Data sources ........................................................................................................... 32

7.      Appendix 2: Methodologies and Data Quality .............................................................................. 33

     7.1.      Methodologies used in this report .......................................................................................................... 33

     7.2.      Data quality .............................................................................................................................................. 34

8.      Appendix 3: Early access to official statistics ............................................................................... 36

                                                                                    ii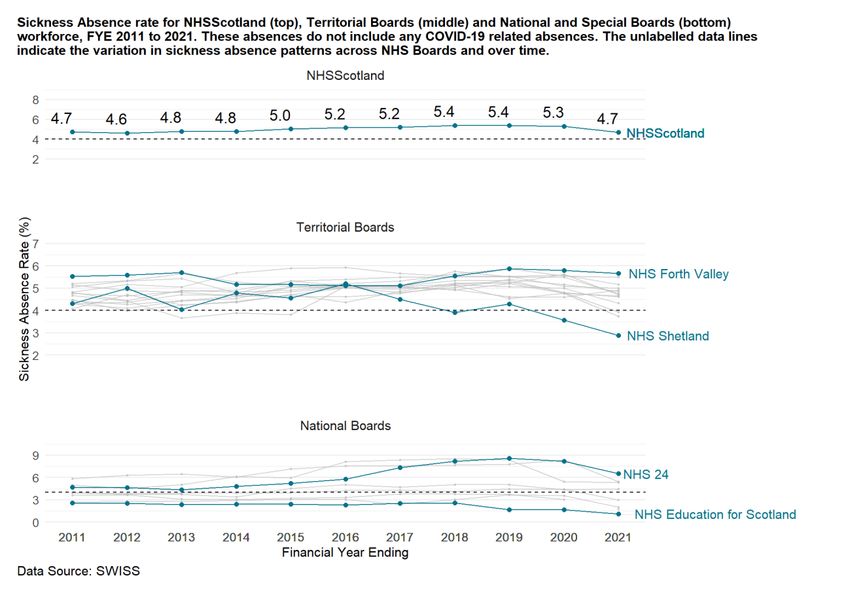
1. Executive Summary
Statistics on 31 March 2021:

  •    There were just over 178 thousand staff employed by NHSScotland, the highest
       reported to date and a 6% annual increase. The Whole Time Equivalent (WTE) has
       grown by 6% over the same period to just over 152 thousand.

  •    In Financial Year Ending (FYE) March 2021, the WTE inflow to NHSScotland has
       increased to a high of around 16 thousand WTE. The WTE outflow has decreased to the
       lowest reported value since FYE 2013, with an outflow of just over 7 thousand WTE
       recorded this financial year.

  •    The sickness absence rate for NHSScotland in FYE 2021 has decreased by 0.6
       percentage points to 4.7%. This does not include COVID-19 related absence.

  •    There were just over 14 thousand WTE Medical and Dental staff in post, an annual
       increase of 5%. Doctors in Training and Consultants account for 43% and 40% of the
       Medical and Dental workforce, respectively.

  •    The national expenditure on Medical agency locum staff has decreased by 15% over
       the last year to £88 million in FYE 2021.

  •    The Nursing and Midwifery staff group is the largest in NHSScotland, accounting for
       just under 64 thousand WTE (42%) of the workforce. It has increased by 5% over the
       past year.

  •    The NHSScotland expenditure on Nursing and Midwifery bank staff rose by 9% over
       the last year to £197 million in FYE 2021. The expenditure on Nursing and Midwifery
       agency staff in FYE 2021 was £39 million.

  •    There were just over 12 thousand WTE Allied Health Professions in post, an annual
       increase of 2%.

  •    The number of dentists working in Scotland remains the same over the last year at
       around 3,700. The majority of these dentists are independent contractors and are in
       addition to the staff in post above.

                                             iii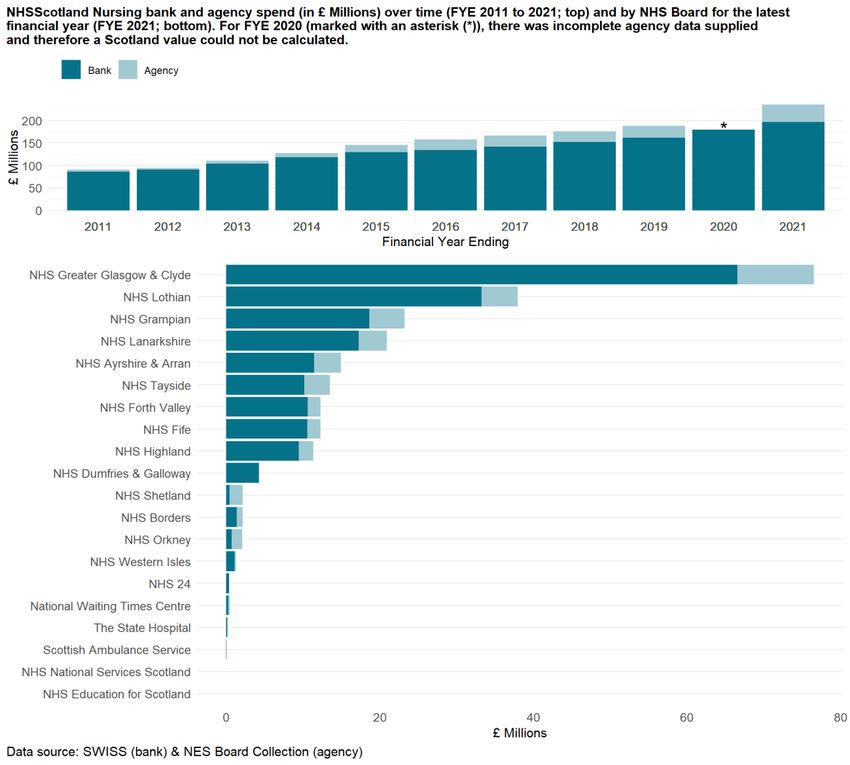
2. Introduction
NHS Education for Scotland (NES) is the source for Official Statistics on the NHSScotland
Workforce.

The NHSScotland workforce has a significant role to play in the delivery of quality services
that meet the needs of patients, their families and the general public in a modern health
service. Staffing also accounts for a large portion of the NHSScotland budget – the Scottish
Health Service costs report for the FYE 2020 reports that staff accounted for almost 68% or
£5 billion of hospital costs.

NES publishes quarterly updates on an extensive set of indicators, including staff in post and
vacancies. These data support NHS Boards and the Scottish Government with local, regional
and national workforce planning. This annual report reflects on the latest key indicators for
clinical staff including medical and dental consultants, doctors and dentists in training,
qualified nurses and midwives, and allied health professions (AHPs).

We will describe some of the ways in which COVID-19 has impacted the NHSScotland
workforce, including the impact on the provision of data (Section 4). We will also highlight
some projects being undertaken by the NES Data Group to improve the quality, value and
trustworthiness of the workforce information we produce (Section 5).

   2.1.       Workforce data and information
The primary source of information on staff employed by NHSScotland is the Scottish
Workforce Information Standard System (SWISS) which brings together HR and Payroll
information. In addition to this, NES collects a range of information directly from NHS Boards.

The data presented within this report, as well as in our dashboards and tables, includes all
staff employed directly by NHS Boards and excludes those working as independent
contractors, such as general medical practitioners (GPs) and general dental practitioners
(GDPs), or staff employed on bank and agency contracts. Throughout out this report,
numbers of staff in post and vacancies are described in terms of Headcount or Whole Time
Equivalent (WTE), a measure which accounts for part-time working.

In conjunction with this report, comprehensive workforce data for 31 March 2021 are
available via the Turas Data Intelligence website: six dashboards (Overall Staff, Medical and
Dental, Nursing and Midwifery, AHPs, Other Staff Groups, and Pharmacy) present quarterly
data over a ten-year period for staff in post. Due to significant changes in Nursing and

NES NHSScotland WORKFORCE REPORT             1
Midwifery job families in 2015, the Nursing and Midwifery dashboard contains data from
March 2015 onward to ensure consistent time series.

Variation in indicators between age band, contract type and sex, Agenda for Change (AfC)
band, grade and specialty where applicable, are available as chart visuals or tables. Using
Turas Data Intelligence, users can explore the dashboards to quickly identify trends and
compare professions, NHS Boards and regions.

Information on vacancies is available for consultants, nursing and midwifery staff and AHPs.
As described in Section 4 this data collection has been disrupted due to the COVID-19
pandemic, with an impact on our ability to report National vacancy information.

Much of the data are also available in Microsoft Excel tables. A full list of the data published
and a timetable of future releases are available on our webpages.

Official workforce publications prior to 3 December 2019 can be accessed via the ISD
Workforce publication page.

All data has been affected by COVID-19 either directly by interrupting data flows or indirectly
through its impact on workforce demand and supply. Throughout this report, where possible,
we will highlight the impact on the workforce over the last year due to the pandemic,

NES NHSScotland WORKFORCE REPORT               2
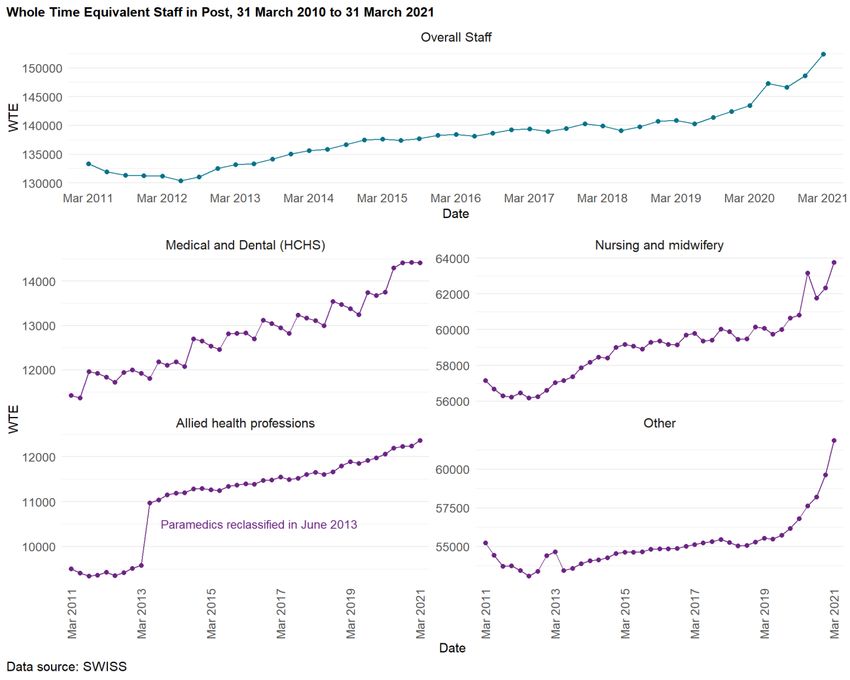
3. The Workforce
   3.1.       Staff in Post
On 31 March 2021, NHSScotland had a total headcount of 177,710 staff, the highest reported
to date and a 6.4% increase in the past year. Adjusting for part-time working, the Whole Time
Equivalent (WTE) also increased by 6.2% to 152,395.9 WTE (Figure 1).

During the past year the demand for staff has increased due to the COVID-19 pandemic. It is
challenging to accurately quantify increases in staffing directly due to the pandemic. Staffing
data reported by NES does not include staff working on bank contracts which will have been
used to assist with both the clinical response and vaccination programme. However, if we
compare the latest overall increase in the workforce with the increase seen in the previous
year (March 2019 to March 2020: 1.2% based on WTE), we see that the workforce has grown at
a greater rate over the most recent year.

One aspect of NHSScotland’s response to the pandemic was a process of accelerated
recruitment. NHS Education for Scotland facilitated the recruitment and onboarding of
student Nurses and midwives, as well as returning healthcare professionals during the
pandemic through a recruitment portal.

Between March and June 2020 there was an increase of 2,300 WTE nurses (Figure 1). These
were largely nursing students in their second or third year who were employed early to help
with the COVID-19 response. However, this number is likely to be an underestimate since
there were some staff who were not onboarded onto both the HR and Payroll system and
are therefore excluded in these data.

The majority of the second year Nursing students returned to their normal studies at the end
of August 2020, account for a decrease in the Nursing and Midwifery workforce between June
and September 2020. A second increase of 2,000 WTE nurses is seen between September 2020
and March 2021 and reflects the additional employment arising from winter pressures and
the vaccination programme (split across Adult and Public Health nursing). This second
increase may also include some students who worked during the first wave of the pandemic
but were not recorded on both the HR and Payroll system and hence were not visible in the
data earlier.

Historically, approximately 500 WTE doctors join the NHSScotland workforce in August each
year when they graduate from university. This inflow appeared earlier, between March and

NES NHSScotland WORKFORCE REPORT             3
June, as doctors in the final year of university were onboarded early as part of the pandemic
response.
Figure 1: Number of Staff in Post has grown during the past ten years to 152,396 WTE on 31
March 2021

Other areas of the workforce have seen significant increases as a result of the pandemic
(Figures 2). Employment in ambulance support services have increased by 42.3% to 3,723.4
WTE, with some additional staff employed to support the mobile testing units. Administration
staff have increased by 8.9% to 28,446 WTE to provide support to contact tracing and the
vaccination programme.

NES NHSScotland WORKFORCE REPORT             4
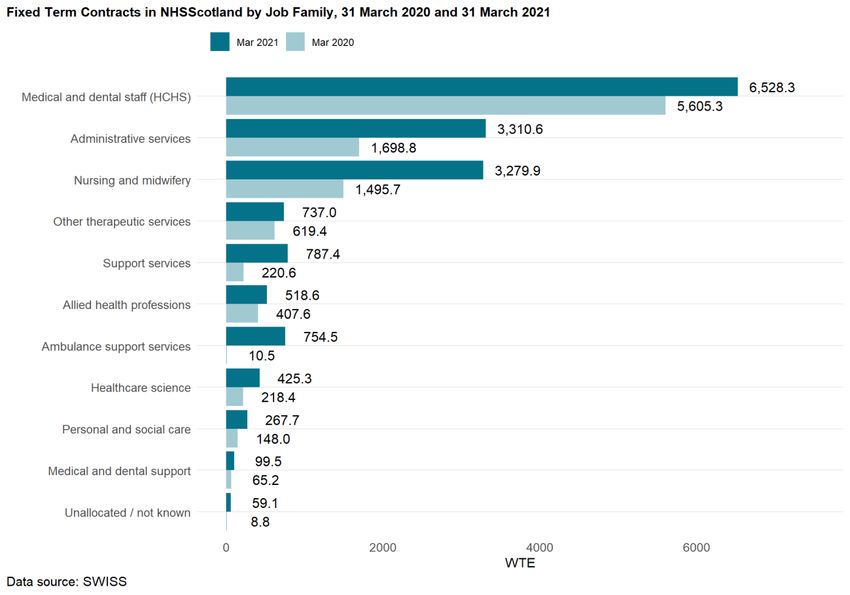
Figure 2: Most staff groups have grown over the last year: largest increases are in Administration
and Ambulance Services

Users can explore the changes in staff in post over time in detail in the dashboards on the
Turas Data Intelligence website.

   3.2.        Vacancies
NHS boards provide information on vacancies for Medical and Dental Consultants, Nursing
and midwifery and Allied health professions. Similar to trend shown in the UK Labour Market
Vacancy Survey, prior to the pandemic the number of vacant posts has been increasing.

NES NHSScotland WORKFORCE REPORT              5
From 31 March 2011 to 31 December 2020, the number of vacant Medical and Dental
Consultant posts and the vacancy rate has increased from 135.7 WTE (3%) to 480.8 WTE
(8.2%), and for Allied Health Professions the increase has been from 206.7 WTE (2.1%) to
724.3 WTE (5.7%). Since the review of community nursing undertaken in 2015, Nursing and
Midwifery vacancies have increased from 1,991.8 WTE (3.3%) to 3,606.9 WTE (5.6%).

The pandemic has brought challenges with the provision of data, with several NHS Boards
unable to supply data for 31 March, 30 June and 31 December 2020. Where any Board is
unable to supply data it is not possible to report statistics at NHSScotland level and the
charts that follow indicate instances of this using an asterisk (*) in the affected quarters.

Figure 3: Vacancy rate for Medical and Dental Consultants, Nursing and midwifery and Allied
health professions has been increasing

 Notes: For the dates marked with an asterisk (*) the data provided is incomplete and we
therefore have not calculated a Scotland value. For March, June and December 2020 the data

NES NHSScotland WORKFORCE REPORT             6
provision was disrupted due to COVID-19 pandemic. Nursing and Midwifery staff the vacancy
figures are shown from the community review (March 2015) onwards.
Users can explore changes in vacancies over time in detail in the dashboards on the Turas
Data Intelligence website.
3.3. Other Workforce Indicators
3.3.1. Sex and Age Profile
NHSScotland is Scotland’s biggest employer. Comparing the number of females and males
working for the NHS in Scotland with the number of females and males employed (and
aged 16-64) in Scotland there is a large difference: 10.6% (140,067) of employed females
work for the NHS compared with only 2.8% (37,644) of employed males.
Prior to the pandemic (March 2011 to March 2020), the percentage of females has steadily
increased by about 0.6%; however, over the last year this trend has reversed (Figure 4).
Figure 4: Prior to the pandemic the percentage of females has steadily increased by about 0.6%;
however, over the last year this trend has reversed
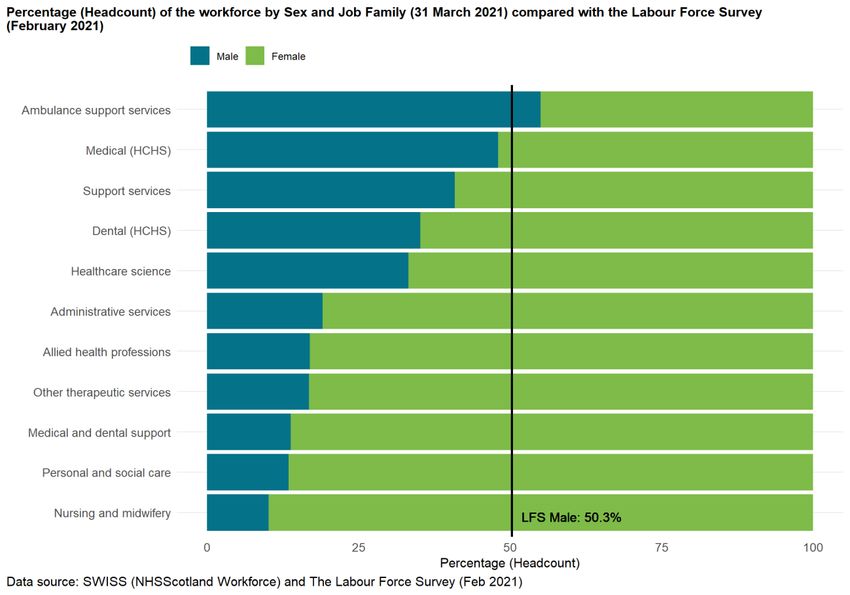
There is much variation across different staff groups: 55% of staff in Ambulance Support
Services are male compared with only 10.1% of staff in Nursing and Midwifery (Figure 5).
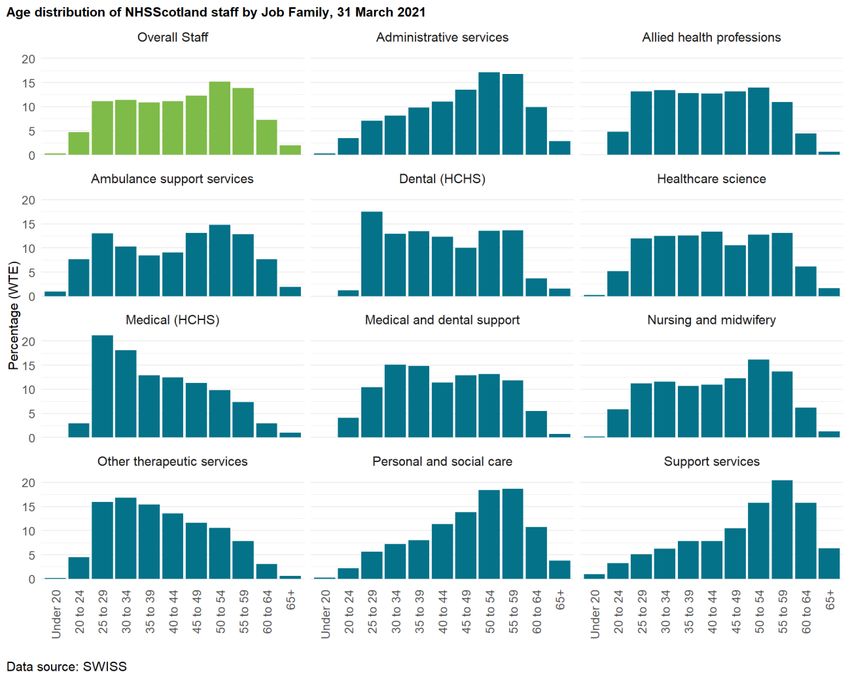
NES NHSScotland WORKFORCE REPORT 7Figure 5: The percentage of Males in the workforce varies by Job Family The median age of the workforce has increased from 45 on 31 March 2011 to 46 on 31 March 2020. However, over the last year the median age has decreased to the value that it was ten years ago (45). The age distribution varies across Job Families (Figure 6). For example, on 31 March 2021 11.3% of medical staff were aged 55 and over compared with 42.3% of support staff. NES NHSScotland WORKFORCE REPORT 8
Figure 6: Age distribution varies by Job Family

       3.3.2. Average WTE
In Scotland, results from the Labour Force Survey in Dec - Feb 2021 indicate that 38% of
females and 12.9% of males employed are working part-time. The percentage of the
NHSScotland workforce working part-time is slightly higher: on 31 March 2021, there are
49.8% of females and 18.7% of males working part-time.

Whole Time Equivalent (WTE) - the number of contracted hours as a proportion of the
conditioned hours for a given post - is a way of measuring the size of the workforce taking
part-time working into account. Examining average WTE over time shows how part time
working has changed in NHSScotland. Over the last decade the average WTE has increased

NES NHSScotland WORKFORCE REPORT              9
for both females and males and across most staff groups (Figure 7). Assuming a weekly
standard of 37.5 hours, the average WTE for females has increased from 0.64 to 0.67 which
equates to an extra 1.5 hours. For males the increase is slightly larger, from 0.58 to 0.62,
roughly 2.4 hours. There is much variation over average WTE across area of work.
Over the last quarter there has been a decrease in the average WTE for Nursing and Midwifery
staff working part-time. This may be due to the staff employed on Fixed Term Contract
(covered in the next section) finishing their contract.
Figure 7: Average WTE for part-time staff has increased over the last decade for both female and
male staff
3.3.3. Fixed Term Contracts
During the pandemic the NHS Workforce has had to adapt quickly, and a large number of new
staff have had to be brought into the workforce. One way this has been done is using fixed-
term contracts.
NES NHSScotland WORKFORCE REPORT 10The number of fixed-term contracts over the past five years has remained relatively stable at
around 7% of total WTE. In the past year this has increased to 11%. There were 10,498.2 WTE
staff (11,946 headcount) on a fixed-term contract on 31 March 2020, rising to 16,767.8 WTE
(20,248 headcount) on 31 March 2021 (Figure 8).
Over the coming quarters, as these members of staff come to the end of their fixed-term
contracts, the staff in post figures may decrease as a result.
Figure 8: Over the last year the number of people on Fixed Term Contracts has risen to 9.5%, but
this varies depending on the Job Family.
3.3.4. Turnover
High rates of staff turnover in an organisation can indicate a loss of organisational
knowledge, increased costs in recruitment of new staff and costs for induction and training.
NES NHSScotland WORKFORCE REPORT 11The outflow from NHSScotland was been relatively stable between FYE 2016 to FYE 2020 with
around 8,500 WTE staff leaving each financial year (range: 8,418.6 - 8,853.5, average: 8,569.6).
Over the last financial year, the number of leavers has dropped by 16.7% to 7,168.7 WTE.
After a period of stability, the inflow of WTE has increased over the last few years. This is
particularly evident over the last financial year with a 45.9% increase to 16,280.4 WTE, likely
due to the recruitment of staff to aid with the COVID-19 pandemic.
Figure 9: Number of Joiners has increased significantly over the last financial year, whereas the
number of leavers dropped
Turnover rates can be explored in more detail in the Overall Staff dashboard on Turas Data
Intelligence and Turnover discovery section.
3.3.5. Sickness Absence
The sickness absence data reported here do not include any COVID-19 absences as this is
captured in a different data source which we do not have access too. The Scottish
Government has reported absences due to COVID-19 on their website.
Sickness absence in NHSScotland can result in cancelled appointments and procedures and
lead to increased expenditure on supplementary staff, such as medical locum and agency
nurses. The Scottish Government set a national standard which required NHS Boards to
NES NHSScotland WORKFORCE REPORT 12achieve a sickness absence rate of 4.0% or less from 31 March 2009. Over the last ten years the national rate has varied between a high of 5.4% in FYE 2019 to a low of 4.6% in FYE 2012. The sickness absence rate for NHSScotland in FYE 2021 has decreased by 0.6 percentage points to 4.7%. A decrease in the rate is shown in all but two Boards (NHS Orkney and National Waiting Times Centre). However, there is wide variation in sickness absence rates across Boards as shown in Figure 10. COVID-19 has likely had an impact on sickness absence rates for multiple reasons. For example, a low level of seasonal respiratory illnesses combined with the restrictions on movement, shielding and staff working from home where possible, will likely have reduced the rate of absence. Further work is needed to explore the long-term mental and physical impact the pandemic may have on the workforce. Figure 10: The sickness absence rate has decreased by 0.6% over the last financial year Users can explore the sickness absence data in the Overall Staff dashboard on the Turas Data Intelligence website. NES NHSScotland WORKFORCE REPORT 13
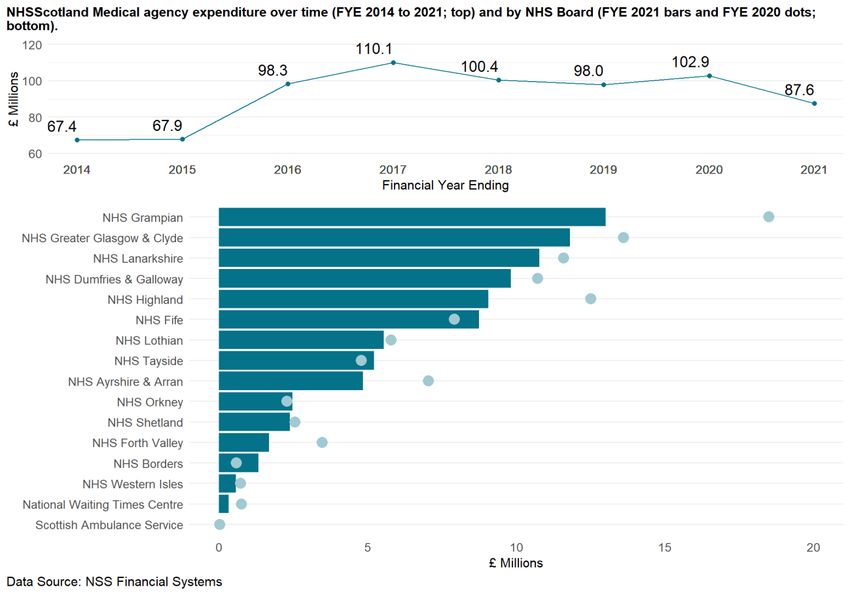
3.3.6. Medical Agency and Nursing Bank and Agency Expenditure
Medical Agency

Agency locum doctors and dentists are used by NHS Boards to support the workforce by
providing additional temporary capacity. The annual expenditure on locums includes those
who are hired through private agencies (and not locums who are directly employed by NHS
Boards).

The national expenditure on agency locums has decreased by 14.9% in the past year to the
lowest level since FYE 2015 (£88 million; Figure 11).

There is a decrease across ten territorial Boards (Figure 11) with the largest relative decreases
in NHS Forth Valley (by 52% to £1.6 million), NHS Ayrshire & Arran (by 31% to £4.9 million) and
NHS Grampian (by 30% to £13 million). The four Boards which had an increase of agency
locum expenditure are NHS Borders (by 125% to £1.3 million), NHS Fife (by 11% to 8.7
million), NHS Tayside (by 9% to £5.2 million) and NHS Orkney (by 8% to £2.5 million).

NES NHSScotland WORKFORCE REPORT             14
Figure 11: Medical agency expenditure (£ Millions) has decreased over the last financial year

Readers can explore the agency locum expenditure data in the Medical and Dental
dashboard on the Turas Data Intelligence website.

Nursing Bank and Agency

NHS Boards use supplementary staff to temporarily fill vacant posts, to cover sickness
absence and maternity/paternity or annual leave, and to provide additional temporary
capacity. Bank staff are NHS employees while Agency staff are employed by private
companies.

Bank staff figures for FYE 2021 show an increase for the tenth consecutive year (Figure 12).
NHSScotland expenditure on bank staff rose by 128.3% (£196.7 million) since FYE 2011. Over

NES NHSScotland WORKFORCE REPORT              15
the same time period the expenditure on agency staff rose by 802.3% (£ 39.3 million) since
FYE 2011.
Figure 12: Nursing Bank and Agency expenditure (£ Millions) has been increasing

Readers can explore the nursing and midwifery bank and agency data in the Nursing and
Midwifery dashboard on the Turas Data Intelligence website.

NES NHSScotland WORKFORCE REPORT            16
4. Challenges of COVID-19 for NHSScotland Workforce Data
Throughout this year there have been significant challenges in collecting data on the
workforce as it adapted and grew. The majority of the reported data in this publication is
extracted from administrative systems such as e:EES, the HR system used by most of the NHS
Boards, and the National Payroll systems.

As Doctors in Training were moved from their main specialty training programme to areas
that were more focused on treating patients with COVID-19, often the field used to categorise
their specialty was updated to a Not Known, causing a large increase in this category and
decreases in others. As the year as gone on, many of these doctors have returned to their
main specialty training programme.

In the early stages of the pandemic, a process known as COVID Accelerated Recruitment
Programme (CARP) sent out an appeal for anyone with medical, nursing, or other relevant
experience to provide their details and if appropriate they would be recruited. In addition to
the members of the public, nurses and medical students in their final year were also recruited
as nurses and doctors, and nursing students in their second year were employed as health
care assistants. Due to the speed of this process, some of the larger boards did not add these
students to their HR systems, and only recorded them on their payroll systems. Due to the
way NES combines data from these systems, an individual must have records in both to be
included in our staff in post.

Many of the final-year students will have taken up permanent employment in August when
they were due to graduate and will have been included in subsequent staff in post figures.

The members of the public that were recruited were often employed as bank staff which are
also not included in our staff in post figures. These two factors mean that our staff in post
figures are likely an underestimate of the actual workforce over the past year.

There are additional data we report that are collected using bespoke data collection systems,
such as vacancies and nursing agency data which are collected using a manual survey
completed by the NHS Boards. As this requires some manual input from the boards when
they had many other pressures, some NHS Boards indicated that they would not be in a
position to supply these data for 31 March, 30 June and 31 December 2020 census. The NHS
Boards that could not supply the data are noted in the notes sections of the excel tables and
dashboards on Turas Data Intelligence.

NES NHSScotland WORKFORCE REPORT            17
5. Data Group Discovery Work
The Data Group is a group of data engineers, analysts and scientists who utilise a range of
skills to provide a suite of reports enabling evidenced-based decision-making on workforce
planning. This section introduces you to key areas of our work and some projects we are
currently focussing on. Our ambition is to release dedicated reports once these projects have
reached maturity.

Data on different aspects of the workforce are often kept in disparate systems. A
fundamental requirement to understanding workforce dynamics is connecting data on
different workforce topics. Through implementation of a data platform, we are changing the
way these data are ingested, stored and processed so we can build a connected picture
offering a single source of truth.

Some of our data are sourced by manual collections to NHS Boards. With the implementation
of new systems, we are adapting our processes so we can minimise the burden on data
providers and maximise consistency of data capture. However, sometimes, we can apply new
technologies to “old” systems to derive more information. This is the case for the pharmacy
workforce where we have applied a machine learning model to the staff in post data to
reveal more information about their area of work.

As we grow our understanding on the workforce data landscape, we can start to fill gaps in
evidence crucial to building intelligence. An example of this is decomposing the movement
of the workforce to explore internal movement and employment retention. Similarly,
understanding workforce dynamics requires robust analytical methodologies such as the
application of specialist time series and spatial techniques.

NES NHSScotland WORKFORCE REPORT            18
5.1.       Time series
Contact: Kevin Cutt

       5.1.1. Introduction
Nursing and Midwifery make up the largest staff group in NHS Scotland. This generates a
large and increasing amount of data, which presents challenges for the storage, processing,
visualisation, and extraction of valuable insight.

Time series analysis is toolbox of methods that allows the researcher to go “beyond the line”.
It allows for a deeper understanding of what is going on within the data and can highlight
interesting and unexpected findings.

       5.1.2. Data and Methodology
Monthly staff in post data between 31 January 2010 and 31 March 2021 were sourced from
SWISS and were then cleaned, processed, and restructured using the R programming
language to allow for analysis. These were then added to a table on a Postgres SQL database.
A second table was also created for the results to be stored upon completion of the analytics
processing.

Contemporary methods for decomposing and analysing time series data were applied to
monthly aggregated NHSScotland workforce statistics.

       5.1.3. Time Series Decomposition
Decomposition splits a time series like the one below into its components that represent
different patterns in the data.

There are several time series decomposition methods. The one used for this example was STL
(Seasonal and Trend using Loess), which decomposes a time series into a trend, seasonal and
remainder component.

NES NHSScotland WORKFORCE REPORT            19
Figure 13: An example of a time series decomposition showing the Nursing and Midwifery staff in
post trend and its component parts
The trend component shows a steady increase over time, whereas the level of the seasonal
component is relatively constant but becomes more prominent from around 2016 onwards.
This could suggest that a different decomposition method would be more applicable to this
series.
Random variation in the series can be seen in the remainder component, which is a way of
exploring outliers e.g. the bump in 2020 is explained by the COVID-19 pandemic.
Comparing the component trend to the staff in post, we can see the effect of the
decomposition as the peak in staff in post during the COVID-19 pandemic is smoothed.
5.1.4. Seasonally adjusted workforce data
Removing the seasonal component results in seasonally adjusted data, which is useful as it
can be used to show variation based on other components such as long run trends and short
run shocks. A further use is in the development of forecasting and model development for
workforce planning.
NES NHSScotland WORKFORCE REPORT 20Figure 14: A comparison between the staff in post data and the seasonally adjusted trend
5.1.5. Conclusion
Time series methods and techniques offer considerable benefits for both developing a deeper
understanding of our existing data based upon mathematical models, and providing data fit
for workforce planning and modelling purposes.
NES NHSScotland WORKFORCE REPORT 215.2. Pharmacy Workforce Machine Learning Model
Contact: Michele Battagalia
5.2.1. Introduction
Data on the NHS Pharmacy Workforce are collected through the annual staff and vacancy
survey (a Pharmacy Dashboard is available on the TDI website). The survey reports
aggregate information on the number of funded and filled, and funded and unfilled posts on
30 September each year. Due to the aggregate nature of the survey’s data and the fact that it
relates to posts rather than employees, it is not possible to use these data to model the
workforce in the same way as we can with the SWISS data used throughout our published
statistics. For example, it is not possible to examine the age and sex distribution of staff or to
decompose any changes in funded and filled posts into inflows and outflows. The annual staff
and vacancy survey also imposes a relatively large administrative burden on Boards
supplying the data.
By contrast, routinely collected SWISS data contains these employment variables and
provides more up-to-date individual-level data on the number of filled and funded posts,
which can be used to model and forecast the workforce. However, there are data
completeness issues with some of the variables in SWISS. For example, there are many
missing values in the Job Title field for pharmacy staff, making it problematic to accurately
identify and model the key subgroups in the pharmacy workforce: Pharmacists, Pharmacy
Technicians and Pharmacy Support Workers.
A machine learning model may help to better identify these three subgroups. The aim of the
process is to train an algorithm to correctly classify instances of new and incomplete data,
based on a period of training with a data set that contains all the relevant information. The
algorithm learns to take new data and apply the correct labels – in this case Pharmacist,
Pharmacy Technician or Pharmacy Support Worker.
5.2.2. Data Preparation
A supervised machine learning classification model tries to classify missing values based on
the information available from other observations in the data where the sub job family value
is provided (“labelled”). In this project the job title variable is the outcome of the model (Y).
The independent variables Xi to use in the model and their values are determined through the
Data Wrangling process and the process of Parameters Selection.
NES NHSScotland WORKFORCE REPORT 22Data Wrangling is the process of gathering and transforming data into a digestible and
appropriate format for better decision making. Data Understanding and Data Cleaning are
two key parts of this process. Data Understanding is where variables that might be useful in
identifying the three groups of the pharmacy workforce are first identified. These variables
are identified through the understanding of the variables and how the data contained within
them has been derived. SWISS contains dozens of variables, but only those useful for the goal
of the analysis were selected. As some of the selected variables are directly correlated to
other independent variables (i.e. Length of service has a positive correlation with the Age) this
could distort the model result, and these variables are deleted.
Data Cleaning is the process of removing systematic errors in the dataset that might
invalidate the analysis or make them less valuable. Some examples of systematic errors are
missing values, outliers and input mistakes.
Parameters Selection is the procedure that allows the analyst to find the best subset of
variables for the analysis through the Attribute Subset Evaluation method. The best subset is
selected based on three key aspects: accuracy of the model, overfitting and time to train the
data. The different solutions for the pharmacy workforce analysis were evaluated through the
“Info Gain Attribute Evaluator” with “Ranker” as Search Method. The final dataset was
composed of 5 variables: Job Title, Agenda for Change (AfC) Band, Age group, Staff Category
and Part-Time/Full-Time.
5.2.3. Machine Learning Model
The modelling stage is the core of the machine learning process. Several models were tested
in the “Training” dataset in order to select the best one to use in the “Test” dataset. Decision
Trees are the group of data mining models that might better represent the subset of variables
for the pharmacy workforce analysis and consequently report better results. Several decision
tree models were tested through the hyperparameters tuning process which allows the
analyst to test several hyperparameter combinations and to maximise the predictive
accuracy for the model. Hyperparameters are control values which are set up to influence the
capacity of a model to predict through the process of parameters estimation. After this
procedure, the 4 different candidate models reported similar accurate results. LMT (Logistic
Model Tree) was selected because it was easiest to interpret. The final model output is
reported in Figure 15.
The percentage of correctly classified instances was 96.14% and the true positive rates (TP)
for Pharmacy Technicians, Pharmacists and Support Workers were respectively 0.903, 0.987
NES NHSScotland WORKFORCE REPORT 23and 0.989. The selected model performs well, even though it is less effective to represent the
Pharmacy Technicians. The model is however fully accepted.
Figure 15: A Machine Learning Model performs well at classifying pharmacy staff groups
5.2.4. Next steps
The model performs well with the Pharmacist and Pharmacy Support Worker groups but
there is still a degree of error. The NES Data Group is in contact with NHS Boards to identify
potential solutions and improvements to both the source data and the model.
Similar Machine Learning models could potentially be used to identify other staff groups
where the available data does not accurately identify the groups of interest.
The project confirms the potential value of machine learning technology in making effective
use of incomplete data as well as reducing the administrative burden associated with regular
manual data collections.
NES NHSScotland WORKFORCE REPORT 245.3. Spatial analysis: Understanding the role of space in the
workforce
Contact: Lindsey Mathieson
There are often differences in patterns and trends in the workforce data across NHS Boards.
These differences can be due to numerous reasons, but location itself can be a leading factor.
For example, past trends in vacancy data and experiences in NHS Boards suggest rurality may
present particular changes to recruiting staff in the North of Scotland.
In Spatial Analysis each data observation contains information about location in addition to
all the other information. This is helpful during analysis over space because “everything is
related to everything else, but near things are more related than distant things” (First Law of
Geography, Tobler 1970). Analysing spatial data can lead to the discovery of “hotspots” for a
given phenomenon or providing evidence of spatial patterns over time and space.
The NES Data Group have begun to carry out spatial analysis of Nursing and Midwifery
students studying in Scotland. Data on students is collected by the Higher Education
Statistics Agency (HESA) and supports analysis of the number of nursing and midwifery
students each year, from 2005 to 2018, by university course. The data also contain
information on the location of the student prior to commencing their university course, and
this information can be used in spatial analysis. The geographical unit used for this
investigation is the Travel to Work Area (TTWA) associated with the students home location.
TTWAs are statistically-defined labour market areas. They reflect areas where the bulk of the
resident population also work within the same area. The current criteria for defining TTWAs is
that generally at least 75% of an area’s resident workforce work in the area and at least 75%
of the people who work in the area also live in the area. There are 228 TTWAs in the UK.
This analysis is intended to aid in future workforce planning. We can look into the relationship
between a student’s home location and where they study. Are students more likely to study
at a university near their home or are they just as likely to travel further to study?
Clustering analysis can then be carried out on both the number of students and the
proportion of students within each TTWA, to identify areas of higher acceptance into
university courses. For the purposes of the investigation, both k-means clustering and
hierarchical clustering are being used. Once results have been gathered, the clusters over the
two methods will be compared to look for hotspots within the data. The clusters can also be
NES NHSScotland WORKFORCE REPORT 25compared over the years to see if these hotspots shift location or if they remain relatively constant over time. Using Pre-registration Midwifery as an example, we are interested to know if the location of the students who choose to study this course has changed over time. In 2010 the number of universities across Scotland offering this course decreased from 7 to 3 and the number of university places and students decreased correspondingly. But what is also of interest is whether the location of students has changed? Figure 16: The number of people who are studying Pre-registration Midwifery students by home location in 2008 (left) and 2018 (right). The location is shown by Travel to Work Area of their permanent residence (which is likely where they lived upon applying to university). The two maps in figure 16 don’t appear to show much difference in the spread of students. If anything, the spread in 2018 is larger with some students coming from the south-east of England and from the Western Isles. In both years there appears to be a similar distribution of students across central Scotland, centred around Glasgow. It is these sorts of patterns that are of interest for future planning. NES NHSScotland WORKFORCE REPORT 26
Within the framework of spatial statistics we are interested in the number of students from
each TTWA, and also the number of students as a proportion of the working age population of
a TTWA. The two approaches allow us to address different questions.

The number of students from a TTWA provides information on the spatial distribution of past
and current students and allows us to look at relationships between home location and place
of study. For example, a university may offer twenty places on a programme of study. If ten of
these places are taken by students from the same TTWA as the university campus, this may
suggest that there is a relationship between the home location and the university.

Understanding the number of students from a TTWA as a proportion of its working age
population allows us to make better inferences about the likelihood of students coming from
other TTWAs, as this approach takes into account differences in the size of working age
populations between TTWAs. TTWAs with larger or smaller working age populations are likely
to produce correspondingly larger or smaller numbers of students, and with a good
understanding of proportions we may be able to estimate these numbers.

       5.3.1. Further Uses
Currently, this analysis is focusing on location of students in relation to the location of the
university. For future investigations, it would also be of interest to look into which university
hospitals the students have placements in. Due to the practical nature of Pre-registration
Nursing and Midwifery study, hospital locations may be just as relevant as the location of the
university campus.

This analysis could then be extended to look at the relationship between where a student
studies and where they work after qualifying. If there were a correlation between the two
locations, this information could support workforce planning by not only helping to predict
the number of newly-qualified staff joining the workforce in a given year, but also the location
of these staff.

This analysis could be used in the future to support University planning decisions and to feed
into workforce planning in specific Boards or Hospitals where it is particularly important to
understand the likely availability of new-qualified health professionals. The NES Data Group
will explore the availability of data that may allow this kind of analysis for a wider range of
health-related education.

NES NHSScotland WORKFORCE REPORT              27
5.4. Turnover
Contact: Ben Tait
5.4.1. Introduction
The current methodology for reporting the official statistics on overall turnover for an NHS
board is based on whether a member of staff is present in that NHS board on the 31st of
March compared to the 31st of March the previous year. This will give you the number of
joiners and leavers for that board, but is not able to give detail on where employees are
joining or leaving from, specifically, whether they are joining from another NHS Board, or
whether they are joining from external to the NHS. Similarly, are the leavers simply moving to
a different NHS Board or have they left NHSScotland entirely?
In addition, when the current methodology reports joiners and leavers by job family, it is not
clear whether these are people who are moving between job families or have joined the job
family from external sources.
The NES Data Group has been looking at these movements more closely to identify any
trends, and alternative ways of looking at the data on joiners and leavers.
As with our current published methodology for turnover, the following analyses do not
include Doctors in Training who move between NHS Boards regularly as part of their training.
5.4.2. Turnover in FYE 2021
Between 31 March 2020 and 31 March 2021, the NHSScotland workforce grew by 10,685 staff,
the largest recorded annual increase in overall staff in NHSScotland.
There have also been internal changes within NHSScotland, such as the formation of Public
Health Scotland, a Special NHS Board formed of staff and functions previously based in NHS
Health Scotland and NHS National Services Scotland (NSS). From our current published
figures, it is not possible to examine what the true turnover from NHS NSS was, or the number
of staff who moved to PHS.
The chart below shows the number of joiners and leavers in a selection of NHS Boards, with
the colours of the bars indicating internal movers vs. external joiners/leavers. Staff who work
in multiple NHS Boards and move between NHS Boards have been excluded due to
complexities in identifying which NHS Board they are moving from and to.
NES NHSScotland WORKFORCE REPORT 28Figure 17: In most boards, external joiners and leavers make up the majority of the turnover
For most NHS Boards, the majority of joiners and leavers join from, and leave to, external
sources.
Some NHS Boards, particularly the Scottish Ambulance Service have seen a very large
increase in the number of staff employed, with 1368.0 WTE joining the organisation over the
last year. The majority of these are external joiners, rather than staff redeployed during the
pandemic.
5.4.3. Recent Trends
The data over the past five years shows the numbers of movers has remained relatively stable
with a slight rise in the past year due to the movements of staff to Public Health Scotland. The
effect of the pandemic can be clearly seen where the number of external joiners has risen
sharply, even after two previous years of increase. The number of leavers has fallen slightly.
There are a number of possible reasons for this, staff delaying changes in their careers,
e.g. retirement during the pandemic, a reduction in the ability of staff to move to other jobs
outside of the NHS or in England and the restrictions in international travel may have
prevented staff taking up opportunities elsewhere.
NES NHSScotland WORKFORCE REPORT 29Figure 18: External Joiners have increased dramatically during the pandemic, and the number of
movers has increase slightly due to internal NHS Board level restructuring
5.4.4. Flow of workforce between NHS Boards
Finally, we can look in more detail at where the flow of movers between NHS Boards is
happening: where do people move from and to? As previously mentioned, the largest internal
move recently has been the creation of Public Health Scotland, shown in the chart below as
the large blue “chord” between National Services Scotland and Health Scotland to Public
Health Scotland.
We can see that most of the movement happens between boards that are in the same region.
An exception is NHS Forth Valley, but as this sits geographically in the centre of Scotland
these movements are not unexpected. The colours of the boards below show which region
they are in.
NES NHSScotland WORKFORCE REPORT 30Figure 19: Most of the flow between NHS Boards occurs within the regions
Note: Does not include movements between boards of five or fewer employees to simplify the
diagram.
5.4.5. Future Work
Building on this, we hope to look at turnover over shorter time periods, rather than only a
year-to-year basis. In addition, we would like to analyse the stability index of the workforce
which, instead of looking at the number of people who leave each year, lets us look at the
percentage of people who have remained in post and how this changes as the length of time
in post increases. As well as looking at individuals moving between NHS Boards, we could
also look at other internal turnover such as employees moving from one job to another job,
either as a sideways move at the same salary band or as a promotion.
NES NHSScotland WORKFORCE REPORT 316. Appendix 1: Data sources The main source of workforce statistics is the Scottish Workforce Information Standard System (SWISS). SWISS brings together HR and Payroll information into a single data repository. A national HR system, the Electronic Employee Support System (e:ESS), is currently being rolled out across all NHSScotland Boards. While NHS Boards migrate to the new system, any data captured in e:ESS continues to be fed into SWISS. Twenty-one of the 22 NHS Boards are now using e:ESS, with only NHS Grampian still to migrate. From 30 September 2018, the employment model for Doctors in Training (DiTs) changed to a Lead Employer model, with a small number of Boards directly employing all DiTs. An implication of this for workforce reporting was that DiTs’ Board of Placement, as opposed to Board of Employment, was not stored in SWISS and had to be sourced from a different system, Turas People (maintained by NHS Education for Scotland). For staff in post doctors in training, SWISS is merged with Turas People. From 30 September 2018, staff on Locum Appointment in Training (LAT) and Locum Appointment in Service (LAS) grades were included in the NHSScotland medical workforce figures for the first time. This change impacts trend figures for the Doctor in Training grade (staff on a LAT grade) and the Other grade (staff on a LAS grade). Further information on current data sources and collections can be found on the Turas Data Intelligence Data Quality and Sources page. NES NHSScotland WORKFORCE REPORT 32
7. Appendix 2: Methodologies and Data Quality
      7.1.      Methodologies used in this report
         7.1.1. Vacancy reporting
Vacancies are counted as posts that have been cleared for advert after being through the
redeployment process (internal or external advert) and remain as a vacancy until an
individual starts in the post.

The number of vacancies is a measure of how many posts are being recruited to. Figures may
reflect a variety of circumstances within a Board such as a gap in staffing or growth of services
in which new staff are being recruited to. However, note that a post marked as a vacancy may
still be occupied by the previous incumbent and so also included within the staff in post
figure. In contrast, some NHS Boards may not recruit where the post is currently being
covered by a locum.

Job Train is the new national job recruitment system all NHS boards in Scotland now use. All
NHS Boards were using the system by 9th December 2019.

         7.1.2. Net Turnover
The methodology for turnover was revised in 2016 and historical figures were refreshed
accordingly. Specifically at a NHSScotland level:

  •      Leavers are defined as employees who were in post as at 31 March year n and not in
         post at 31 March year n+1.
  •      Joiners are defined as employees who are in post as at 31 March year n+1 and were
         not in post at 31 March year n.
  •      Turnover is calculated as the number of leavers divided by staff in post as at 31 March
         year n.

Net turnover is the rate at which employees leave the workforce and is calculated by dividing
the number of net leavers over the year by the staff in post at the start of the period. The term
‘net’ is employed as the methodology does not account for staff who leave and join (or vice-
versa) within the two census points.

NES NHSScotland WORKFORCE REPORT              33
7.1.3. Sickness Absence Rate
Sickness absence is defined as an absence belonging to one of the following groups: normal
sick leave, unpaid sick leave, industrial injury, accident involving a third party, and injury
resulting from a crime of violence. The NES Data Group extract these data from SWISS by
which is fed from Scottish Standard Time System (SSTS). SSTS records all time and
attendance information, but only sickness absence data flows to SWISS.
COVID-19 absences data are recorded as “special leave” (so it does not affect pay) which does
not flow to SWISS and we are therefore not currently able to extract these data.
The sickness absence data is for all staff in post directly employed by NHSScotland. For
Information Governance reasons, these data have not been through the same processing as
the staff in post reported. Therefore, the staff included in these data might be slightly
different compared with the staff in post data. For example, any doctors in training will be
included in the Board as recorded in SWISS (Board of Employment).
Sickness absence rate is the working hours lost divided by total contracted hours, where:
• the working hours lost is the days lost, multiplied by weekly contracted hours, and
divided by 5 (days - a working week); and
• the total contracted hours is the weekly contracted hours multiplied by 52.179.
7.2. Data quality
7.2.1. NHS Board data sources
Workforce information is sourced from each NHS Board’s HR and payroll systems. These are
live, operational systems in which data can and does change over time. It is recognised that
the published information does not always reflect the data used at local and regional level
when Boards are engaged in planning and reporting on the workforce. Accuracy of data
coding is crucial to the quality and credibility of the data, and NES works to minimise data
inaccuracies arising from local differences in practice. However, responsibility for data
accuracy lies with the NHS Boards providing the data.
The NES Data group work with Boards throughout the year to improve data quality.
Published information may change over time to reflect these improvements. e:ESS was
introduced across NHSScotland in phases, with only one NHS Board, NHS Grampian, due to
migrate later in 2021. When NHS Boards migrated their data to e:ESS, this affected data on
NES NHSScotland WORKFORCE REPORT 34location of service delivery, medical grade and medical specialty. Changes have been seen in
these as Boards review their data as part of the migration process.
Public Health Scotland was formed on 1 April 2020. This Special NHS Board was formed of
staff and functions previously based in NHS Health Scotland and NHS National Services
Scotland (NSS). Changes to Staff numbers in these organisations can be seen in the data from
the 30 June 2020 census date.
7.2.2. Community Nursing review
A review of community nursing staff data, including district nurses and health visitors, was
undertaken in 2014/15 to ensure the availability of more accurate and consistent data
reporting for these staff groups. The main section of the review is now complete and
workforce information for these staff groups is now available in a separate table. Please see
the relevant nursing and midwifery tables for further information.
7.2.3. Health and social care integration
NHS Highland and Highland Council are currently developing an integrated model for health
and social care. Staff involved in the delivery of core integrated services started to transfer
from Highland Council to NHS Highland in June 2012. Staff that have already transferred into
NHS Highland but have not yet been assimilated to AfC are currently recorded as unallocated
/ not known.
A proportion of NHS Highland’s health visitors are employed by Highland council and not by
the Board and are therefore not included in the health visitor figures for the Board and, by
extension, for NHSScotland.
NES NHSScotland WORKFORCE REPORT 358. Appendix 3: Early access to official statistics Early access details Pre-Release Access Under terms of the “Pre-Release Access to Official Statistics (Scotland) Order 2008”, NES is obliged to publish information on those receiving Pre-Release Access (“Pre-Release Access” refers to statistics in their final form prior to publication). The standard maximum Pre-Release Access is five working days. Named individuals in the following organisations are approved to receive standard Pre- Release Access: • Scottish Government Health & Social Care Directorate • NHS Board Chief Executives • NHS Board Communication leads NES NHSScotland WORKFORCE REPORT 36
Contact
MORAG MACPHERSON                               BEN TAIT

Specialist Data and Information Analyst        Specialist Data and Information Analyst
morag.macpherson@nhs.scot                      ben.tait@nhs.scot

PETER WARD
                                               e-mail: datagroup@nes.scot.nhs.uk
Senior Specialist Information Analyst
peter.ward@nhs.scot

NES NHSScotland WORKFORCE REPORT          37
This resource may be made available, in full or
summary form, in alternative formats and
community languages. Please contact us on 0131
656 3200 or email alformats@nes.scot.nhs.uk to
discuss how we can best meet your requirements.
NHS Education for Scotland
Westport 102
West Port
Edinburgh EH3 9DN
tel: 0131 656 3200
NES NHSScotland WORKFORCE REPORT 38
www.nes.scot.nhs.ukYou can also read