Sleep Quality among Police Officers: Implications and Insights from a Systematic Review and Meta-Analysis of the Literature - MDPI
←
→
Page content transcription
If your browser does not render page correctly, please read the page content below
International Journal of
           Environmental Research
           and Public Health

Review
Sleep Quality among Police Officers: Implications
and Insights from a Systematic Review and
Meta-Analysis of the Literature
Sergio Garbarino 1 , Ottavia Guglielmi 1, *, Matteo Puntoni 2 , Nicola Luigi Bragazzi 3,†         and
Nicola Magnavita 4,†
 1    Department of Neuroscience, Rehabilitation, Ophthalmology, Genetics and Maternal/Child Sciences,
      University of Genoa, Polyclinic Hospital San Martino IRCCS, 16132 Genoa, Italy;
      sgarbarino.neuro@gmail.com
 2    Clinical trial Office, E.O. Galliera Hospital, 16128 Genoa, Italy; matteo.puntoni@gmail.com
 3    UNESCO Chair of Anthropology of Health - Biosphere and Healing System, University of Genoa,
      16132 Genoa, Italy; robertobragazzi@gmail.com
 4    Department of Woman/Child & Public Health, Università Cattolica del Sacro Cuore,
      Fondazione Policlinico Gemelli IRCCS, 00168 Roma, Italy; nicolamagnavita@gmail.com
 *    Correspondence: ottavia.guglielmi@gmail.com
 †    Contributed equally as last authors.

 Received: 16 January 2019; Accepted: 7 March 2019; Published: 11 March 2019

 Abstract: Poor sleep is associated with bad health outcomes, worse wellbeing and decreases in
 performance, productivity and safety at work. Police officers are exposed to several risk factors
 including extended work schedules, shift work, occupational stress, dangerous and traumatic events
 and can, as such, develop sleep problems. The aim of the present study was to analyze the sleep
 quality among police officers. A systematic literature search, in PubMed/MEDLINE, PsycINFO,
 Scopus, ISI/Web of Science (WoS) and the Cochrane Library was conducted. Original articles,
 published in English, French, Italian, Spanish and Portuguese, the primary objective of which was the
 evaluation of the quality of sleep through the Pittsburgh Sleep Quality Index (PSQI) in Police Forces,
 were selected. From an initial sample of 1,149 studies, 13 articles were included in the meta-analysis
 (3,722 police officers). The pooled prevalence of bad sleep quality in police officers was 51% [95%CI
 42–60%]. The pooled global score of the PSQI was 5.6 [95%CI 5.0–6.3], corresponding to a low average
 quality. At the meta-regressions, statistically significant associations could be found for work seniority
 (in terms of years of service) and being on shift. The poor quality of sleep in police officers could
 have negative consequences for workers’ health and for the safety of third parts. The implementation
 of health and sleep hygiene promotion programs in police forces is strongly recommended.

 Keywords: police; sleep; occupational health; meta-analysis; prevalence; public health; sleep
 deprivation; health promotion; sleep hygiene

1. Introduction
     Good sleep is important for maintaining general health and wellbeing, in that sleep is an integral
component of human life and can impact on several variables and parameters of human physiology.
Sleep disorders are common in the general population and affect up to one third of adults, both in
high- and low-medium income countries [1]. Sleep problems are associated with bad health outcomes,
and poor sleep quality has been shown to be associated with poor food choice, unhealthy dietary
intakes [2], high body fat and obesity [3]. Deregulation of hypothalamic functions in sleep disorders
can contribute to these alterations [4]. Bad sleep is a risk factor for metabolic syndrome [5] and

Int. J. Environ. Res. Public Health 2019, 16, 885; doi:10.3390/ijerph16050885   www.mdpi.com/journal/ijerph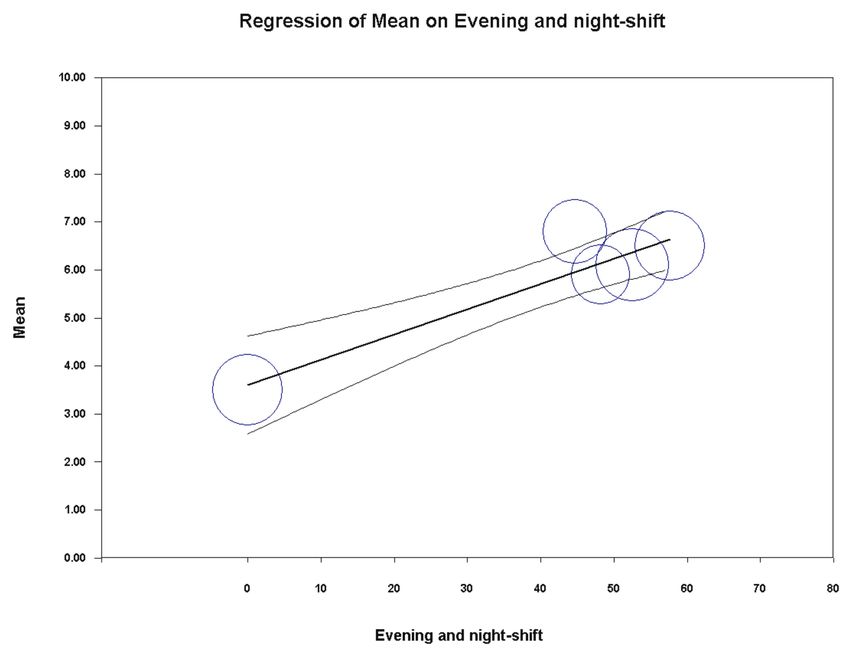
Int. J. Environ. Res. Public Health 2019, 16, 885                                                      2 of 15

impacts on lifestyle behaviors that affect cardiovascular health [6,7]. Bad sleepers are more exposed to
mild cognitive impairment when compared to good sleepers [8]. For instance, Paunio et al. [9], in a
longitudinal study in which a representative sample of the Finnish adult population was followed
up for many decades, found that long-term poor sleep increased risk of depression and disability
retirement due to depressive disorders. Furthermore, sleep disorders have been associated with
negative work outcomes, poor health [10], work injuries [11] and driving accidents [12,13].
      Many occupational factors can, indeed, alter workers’ sleep health. These include irregular shift
work, night shift and extended work schedules [14]. In a recent meta-analysis, bad sleep quality was
associated with an increased risk of work-related injuries [15]. Workers with poor sleep tend to report
higher job stress than good sleepers [16] and some authors have observed that the bi-directionality of
the relationships could indicate a vicious cycle, in which work-related stress, perseverative cognition,
and sleep quality mutually influence each other [17]. Sleep may be also involved in the development
of burnout, as individuals with symptoms of burnout tend to report sleep fragmentation [18], poorer
subjective sleep quality and non-restorative sleep [19]. High levels of stress and fatigue are strictly
inherent to police work. Police officers often experience extended work schedules, shift work,
occupational stress, and dangerous and traumatic events [20,21]. Numerous studies have reported
that, compared with other professions, police officers are at increased risk for stress-related physical
illnesses, including heart disease and metabolic syndrome [22,23]. Furthermore, they are at high risk for
developing psychological problems such as depression [24]. Rajaratnam et al. [25], in a study involving
4,957 police officers from two countries (the United States and Canada), observed a considerable
percentage of sleep problems. A high prevalence of sleep disorders, excessive daytime sleepiness and
sleep-related accidents has also been observed in Italian police officers [26]. Emotional traumas, shift
work, and occupational stress interfere with the quality of sleep in police officers [27] and this can have
significant consequences for workers’ health and public safety, hence the interest in systematically
evaluating sleep in police forces.
      The aim of this study was to analyze sleep quality among police officers through a systematic
review, appraisal and meta-analysis of the literature. In order to obtain fairly homogeneous data, so as
to be able to summarize the results in a meta-analysis, we have limited our research to studies that
have assessed the quality of sleep using the most used self-filled questionnaire, the Pittsburgh Sleep
Quality Questionnaire (PSQI).

2. Materials and Methods

2.1. Questionnaire
      The PSQI [28] consists of 19 items and 7 clinically relevant domains of sleep difficulties: namely, i)
subjective sleep quality, ii) sleep latency, iii) sleep duration, iv) sleep efficiency, v) sleep disturbances,
vi) use of sleep medication, and vii) daytime dysfunction. A global score of overall sleep quality can be
calculated by adding up the single scores of these dimensions, producing scores ranging from 0 to 21.
      Global scores >5 are generally used to indicate poor sleep. A recent meta-analysis has shown a
strong reliability and validity, and a moderate structural validity of the PSQI in a variety of samples
and settings, suggesting the tool fulfills its intended utility [29]. Given the PSQI’s widespread use
as well as its psychometric soundness, we based our quantitative analysis on studies that adopted
this tool.

2.2. Search Strategy
     The present systematic review and meta-analysis has been conducted according to the “Preferred
Reporting Items for Systematic reviews and Meta-Analyses” (PRISMA) guidelines. We systematically
searched the following scholarly databases and bibliographic thesauri: namely, PubMed/MEDLINE,
PsycINFO, Scopus, ISI/Web of Science (WoS) and the Cochrane Library from inception up to
Int. J. Environ. Res. Public Health 2019, 16, 885 3 of 15
August 2018. Articles written in English, Italian, French, Spanish and Portuguese languages were
considered for potential inclusion.
The overall search strategy comprised of a string of keywords related to the profession under
scrutiny (police OR police officer OR police force OR policeman OR policemen OR police operators)
and sleep quality and its synonymous (sleep OR sleep disorders OR sleep quality OR Pittsburgh Sleep
Quality Questionnaire OR PSQI), properly combined by Boolean operators.
All the empirical studies (designed as cross-sectional, prospective, case-control or
quasi-experimental investigations) were included. Studies focusing on sleep quality, assessed by
the PSQI were selected. Studies that evaluated specific sleep disorders, or assessed sleep quality
by means of tools different from the PSQI were excluded. Additionally, studies that used PSQI but
lacked sufficient quantitative details—for instance, studies not reporting the PSQI global score or the
prevalence rate of poor sleepers—were excluded. Finally, we excluded all secondary literature studies,
such as reviews (of any type), systematic reviews and meta-analyses. These studies were, anyway,
read and consulted for reducing the risk of missing investigations potentially relevant. In addition, we
manually searched target journals and scanned reference lists of included studies for increasing the
chance of getting articles related to the topic under study.
2.3. Selection of Published Studies
First, two researchers (SG and OG) independently reviewed all titles/abstracts to identify
potentially relevant articles. They, then, performed study selection, based on a full-text review,
according to the previously stated inclusion/exclusion criteria. Disagreements were resolved by
discussion with a third author (NM), acting as the final referee. Finally, selected studies meeting with
pre-defined inclusion/exclusion criteria and coherent with the topic of interest were included in the
present systematic review and meta-analysis.
2.4. Study Quality Assessment
The assessment of the methodological quality of these studies was conducted applying the
Newcastle–Ottawa scale (NOS) [30]. Disagreement on quality assessment and appraisal was resolved
by discussion until consensus was reached.
2.5. Data Extraction and Analysis
The following data were extracted for each study: study design, year of publication, sample size,
country, mean age of police officers, percentage of female police officers, mean body mass index (BMI),
smoking status, alcohol intake, marital status, education level (percentage of participants having
completed high school), percentage of white and Hispanics participants, years of service, hierarchical
role (sergeant, lieutenant, captain), percentage of police officers with administrative role, percentage of
military police officers or with previous military experience, PSQI cut-off adopted for defining poor
sleepers, prevalence rate of poor sleepers, mean PSQI global score, average sleep duration, and the
main factors associated with sleep quality evaluated in the included studies.
2.6. Quantitative Data Synthesis
The pooled prevalence of low/poor sleep quality was computed by the meta-analytic weighting
of the original rates of police officers exceeding the PSQI cut-off adopted in each study. A further
quantitative analysis was carried out pooling the PSQI global scores obtained in each study. Fixed-effect
or DerSimonian–Laird random-effect models were applied according to the amount of heterogeneity
found. Sensitivity analysis (removing each study per time) was carried out to investigate the stability
and reliability of the findings. Univariate and multivariate meta-regressions were performed to assess
the association between poor sleep quality/PSQI global score and the other variables under study.Int. J. Environ. Res. Public Health 2019, 16, 885 4 of 15
In case of missing data, authors of the present systematic review and meta-analysis personally
contacted the authors of the studies, who were requested to provide the missing values. For several
articles, the proper parameters were computed by the authors themselves.
Heterogeneity among studies was assessed by visual inspection of the forest plot and by using a
standard chi-squared test with a significance level of alpha = 0.01 [31]. The percentage of heterogeneity
among the various studies was quantified by computing the I2 statistics, with I2 of 25%, 50% and 75%
corresponding to a small, medium and large degree of heterogeneity, respectively [32].
Publication bias was evaluated by both visually inspecting the funnel plot and performing the
Egger’s linear regression test. In case of evidence of publication bias, the “true” effect size (ES) was
estimated by the trim-and-fill analysis.
2.7. Statistical Software
All statistical analyses were performed with the commercial software Comprehensive
Meta-Analysis (CMA version 3.0, for Windows, Biostat, Englewood, NJ, USA).
3. Results
The initial search strategy produced a total of 1149 studies (Figure 1).
Figure 1. Article selection algorithm.
We discarded 32 papers: 2 were theoretical investigations and 30 were methodological studies.
18 articles were included in the systematic review [33–50]. Furthermore, from the quantitative synthesis
(i.e., the meta-analysis) several studies (n = 6) [36,40,48] were based on the same sample obtained
from the “Buffalo Cardio-Metabolic Occupational Police Stress” (BCOPS) cohort trial and, as such,
we included only the publication of Charles et al. (2011), having the largest sample size [36].
The final sample comprised a total of 3722 participants (Table 1), with a sample size that ranged
from 22 [45] to 796 [35] police officers.Int. J. Environ. Res. Public Health 2019, 16, 885 5 of 15
Table 1. Characteristics of the studies included in the present systematic review and meta-analysis.
Caucasians Years of Evening PSQI Global
Type of BMI Smoking Education Military/Previous Prevalence of
Sample Mean Age Alcohol Married and Service Hierarchical Administrative and Score (Number Main Factor
Author (Year) Study, Mean Status (High–School Military Poor Sleep
Country) (% fem) Intake (%) Hispanics (Work Hours Role (%) Role (%) Night–Shift of Hours of Related
Quality (SD) (%) %) Experience Quality
(%) per Day) (%) Sleep)
Physical
Bernardo et al., 438 33.2 ± 7.6 No data (no
Cross sec * No data No data No data No data No data No data 4.6% 26.3% Military police 73.7% 79.2% No data (no data) activity (low,
(2018) [33] (Brazil) [20–53] (10.5%) data)
20.5%)
Traumatic
Bond et al., 41.3 ± 6.7 14.6 ± 7.0
Cross sec ** 372 (USA) 29.1 ± 4.7 39.7% 5.6 ± 9.4 72.9% 79.3% 10.5% 16.6% No data 22.3% 59.3% 54.8% 6.5 (6.1 ± 1.2) event
(2013) [34] (27.7%) (high 63.8%)
exposure
Chang et al., 796 37.4 ± 7.7 6.1 ± 3.1 (6.1 ± Met S, shift
Cross sec ** 25.2 ± 3.6 43.1% 1.8% No data No data No data No data No data No data No data 52.5% 52.3%
(2015) [35] (China) [20–60] (0%) 1.1) work
Charles et al., 42.1 ± 8.4 No data (high No data (6.1 ± Perceived
Cross sec ** 430 (USA) 29.2 ± 4.8 41.4% 5.6 ± 9.5 No data 80% 11% 15.7% No data 25.4% 57.6% 51.9%
(2011) [36] (25.8%) 36.0%) 1.2) stress
PTSD,
Chopko et al. 41.6 ± 9.2 14.7 ± 1.9 16.4 ± 8.9 4.8 ± 3.1
Cross sec * 193 (USA) No data No data No data 82.4% 93.3% 15% No data No data No data No data general
(2018) [37] [23–63] (6.7%) years [12–22] [1–42] (no data)
health
Blood pres.,
Elliot et al., 206
Cross sec * 31.6 ± 8.5 (32%) No data No data No data No data No data No data 6.4 ± 7.5 17.5% No data No data 44.7% 69% 6.8 ± 3.6(no data) fatigue, card.
(2016) [38] (Australia)
diseases
Card. disease
and mental
Everding et al., 5.4 ± 3.1
Cross sec * 379 (USA) 41.5 ± 8.6 (6%) 28.8 ± 3.9 No data No data No data No data No data No data No data No data No data No data 38% health,
(2016) [39] (no data)
inflammatory
markers
29.2 ± 4.7
Fekedulegn et 41.2 ± 6.6 14.4 ± 6.8
Cross sec ** 363 (USA) (BMI>25 39.3% 5.5 ± 9.4 72.2% 76.5% 10.5% 28.1% No data No data 50.4% 54% No data (no data) Shift work
al., (2016) [40] [27–66] (28%) (high 64%)
81%)
49% ≥15
Hartley et al., 6.5 ± 3.4 (6.1 ±
Cross sec ** 356 (USA) 41.3 ± 6.7 (28%) 29.2 ± 4.7 40.4% 5.6 ± 9.4 73.9% 79.5% 10.7% years (no 28.1% No data 21.4% 59.9% 54.2% Stress
(2014) [41] 1.2)
data)
McCanlies et
Cross sec ** 98 (USA) 39.6 (39.8%) No data 53.1% No data 65.3% 81.6% 18.4% No data 34.7% No data No data No data No data No data (6.4) Met S
al., (2012) [42]
Neylan et al., Critical
Cross sec ** 733 (USA) 37.0 (29%) No data No data No data 68.8& 69% 28% 12.6 (no data) No data No data No data No data 64% 6.1 ± 3.2 *
(2002) [43] incidents
Neylan et al., 26.4 ± 4.2 3.5 ± 2.1 (6.25 ± Psychomotor
Cross sec * 189 (USA) No data No data No data No data No data No data No data No data No data No data 0% No data
(2010) [44] [21–43] (12%) 1.70) performance
Pinto et al., 25.2 9 [6–25] (No 5.5 ± 3.0 *(6.5 ± QoL, work
Cross sec * 22 (Brazil) 34.6 ± 6.1 (0%) No data No data No data No data 22.7% 27.2% No data Military No data 63.6%
(2018) [45] [23–31] data) 0.8) accidents
5.9 ± 2.9 [2–13]
Ramey et al., 39.6 ± 9.0 No data (45.9 41/85
Cross sec * 85 (USA) 80%> 25 No data No data No data No data No data No data No data No data 23% (6.8 ± 1.3 Shift work
(2012) [46] [22.4–63.3] (0%) ± 7.5 [8–70]) (48.2%)
[3.5–9.5])
Roustaei et al.,
Cross sec * 60 (Iran) No data (100%) No data No data No data No data No data No data No data No data 50% No data No data 48.3% 6.1 (no data) QoL
(2017) [47]
Slaven et al., 40.7 ± 7.1 6.5 ± 3.4
Cross sec ** 391 (USA) No data 40% 5.4 ± 9.2 73% 80% 10% No data No data No data No data No data 66.2% Depression
(2011) [48] (27.4%) (no data)
Chronotype
Yadav et al.,
Cross sec * 85 (India) 26.6 ± 0.6 (60%) 22.9 ± 0.2 No data No data No data No data No data No data No data No data No data No data 31.8% No data (no data) and duty
(2016) [49]
schedule
Yoo et al., 5.4 ± 3.4 Met S, mental
Cross sec * 106 (USA) 42.3 ± 8.4 (0%) 29.7 ± 4.1 No data No data No data No data No data No data No data No data No data No data 36.8%
(2013) [50] (no data) health
Notes: *: low study quality; **: medium study quality. Abbreviations: BMI (body mass index); Met S: metabolic syndrome; PSQI: Pittsburgh Sleep Quality Index; PTSD: post-traumatic
stress disorder; QoL: quality of life; SD (standard deviation).Int. J. Environ. Res. Public Health 2019, 16, 885 6 of 15
Most researches were conducted in the USA, two in Brazil [33,45], one in Australia [38], India [49],
Iran [47], and China [35], respectively. All the studies included in the present systematic review
and meta-analysis were cross-sectional. Overall, studies were characterized by medium-low quality
according to the NOS.
The heterogeneity among studies was high, exceeding 95% for both estimates (96.62% for the
pooled PSQI global score and 95.86% for percentage of poor sleepers, respectively). Due to the large,
statistically significant degree of heterogeneity, we calculated study weights and ES according to the
DerSimonian–Laird random-effect model.
The prevalence of poor sleep quality among police officers was reported by 11 investigations and
ranged between 23% and 79%. As reported in Figure 2, the pooled prevalence of poor sleepers was
51.1% [95%CI 41.8–60.3]. Figure 3 reports the sensitivity analysis, showing the stability and reliability
of the findings after removing each study per time. Finally, visual inspection of the funnel plot and
computation of the Egger’s linear regression test did not reveal any evidence of publication bias
regarding percentage of poor sleepers (Figure 4).
Figure 2. Prevalence of low sleep quality in police officers.
Figure 3. Sensitivity analysis for the prevalence of low sleep quality in police officers, showing stability
and reliability of the findings.Int. J. Environ. Res. Public Health 2019, 16, 885 7 of 15
Figure 4. Funnel plot of the meta-analysis of the prevalence of low sleep quality in police officers.
Univariate meta-regression analysis failed to capture any significant association between the
percentage of poor sleepers and the variables under study (publication year p = 0.8762; country
p = 0.1066; mean age p = 0.2252; percentage of female participants p = 0.9604; BMI p = 0.9844;
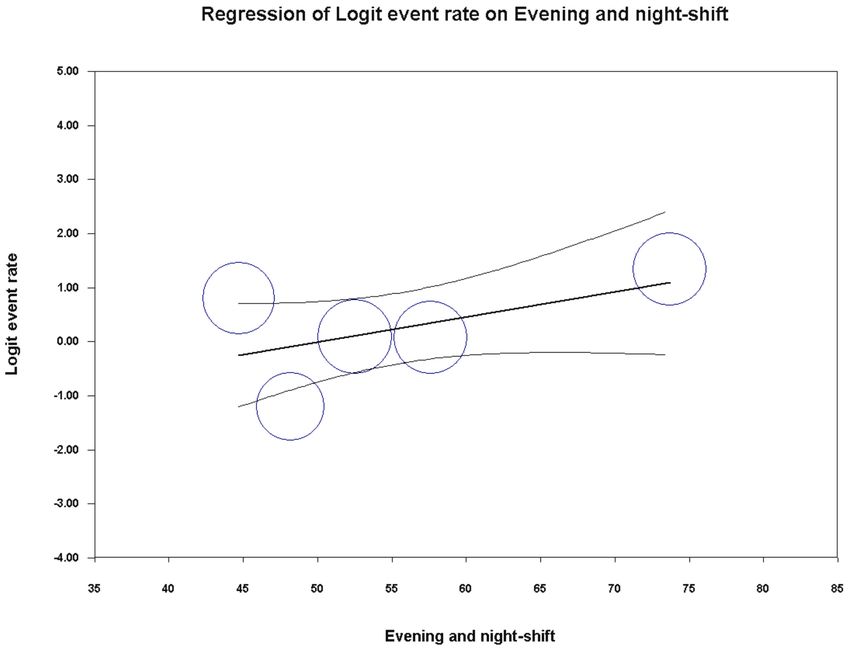
hierarchical role p = 0.3549). Interestingly, the association between the percentage of poor sleeper
and the policemen under evening/night shift yielded a statistically borderline result (coefficient
= 0.05, SE = 0.03 [95%CI –0.01 to 0.10], z-value = 1.76, p = 0.0782), as shown in Figure 5. For the
other variables under study, it was not possible to perform any meta-regression analysis due to
the insufficient number of studies. Furthermore, for the same reason, it was not possible to run a
multivariate meta-regression analysis.
Figure 5. Meta-regression analysis showing a statistically borderline association between prevalence of
low sleep quality in police officers and percentage of police officers on evening/night shift.
The PSQI global score was reported by 11 papers and ranged between 6.8 and 3.5. In most of
the researches included, a high PSQI global score was reported, well exceeding the PSQI cut-off of 5.
As pictorially shown in Figure 6, the pooled mean score of the PSQI resulted 5.64 [95%CI 5.02–6.26].Int. J. Environ. Res. Public Health 2019, 16, 885 8 of 15
Sensitivity analysis is shown in Figure 7, confirming the reliability of our findings. However, evidence
of publication bias was detected (Figure 8). As such, the “true” ES was estimated to be 5.43 [95%CI
4.84–6.01], after trimming 2 studies.
Figure 6. Pooled global score of PSQI in police officers.
Figure 7. Sensitivity analysis for the pooled PSQI global score in police officers, showing stability and
reliability of the findings.
Figure 8. Funnel plot of the meta-analysis of the pooled PSQI global score in police officers.Int. J. Environ. Res. Public Health 2019, 16, 885 9 of 15
Univariate meta-regression analysis indicated a significant association between the PSQI global
score and years of service (coefficient = −0.17, SE = 0.07 [95%CI −0.31 to −0.04], z = −2.54, p = 0.0112)
and percentage of policemen on evening/night shifts (coefficient = 0.05, SE = 0.01 [95%CI 0.03 to
0.08], z = 5.75, p = 0.0000) (Figures 9 and 10). On the contrary, year of publication (p = 0.9902),
country (p = 0.7936), gender (p = 0.4032), mean age (p = 0.2271), hierarchical role (p = 0.8845), BMI
(p = 0.8689) and sample size (p = 0.3752) did not achieve the significance threshold. As for the previous
meta-analysis, for the other variables under study, it was not possible to perform any meta-regression
analysis due to the insufficient number of studies. Furthermore, for the same reason, it was not possible
to run a multivariate meta-regression analysis.
Figure 9. Meta-regression analysis showing a statistically significant association between the pooled
PSQI global score in police officers and years of service.
Figure 10. Meta-regression analysis showing a statistically significant association between the pooled
PSQI global score in police officers and the percentage of policemen on evening/night shift.Int. J. Environ. Res. Public Health 2019, 16, 885 10 of 15
Moreover, the main determinants of poor sleep quality were coded and grouped according to
the main area/theme of interest. Some studies analyzed the association between sleep disorders and
medical condition, such as metabolic syndrome, cardiovascular disease and blood pressure, or mental
health, response to traumatic events, distress and depression. Other studies analyzed the association
between sleep and quality of life, chronotype, shift work, and other occupational aspects.
Shift work appears to be associated with sleep deprivation and bad sleep quality in police officers,
especially if they are working "out-of-phase" with reference to chronotype.
Significant association between bad sleep quality and mental health was observed, even if, in the
absence of longitudinal studies, it is not possible to know the direction of the association, i.e., whether it
is the mental health status that determines sleep disorders, or the opposite. Chopko et al. [37], in a study
on 193 police officers, argued that sleep quality mediates the association between post-traumatic stress
disorder (PTSD) and health outcomes, including physical disorders or depression. Neylan et al. [43]
observed that sleep disorders were strongly associated with post-traumatic stress symptoms and
general psychopathology, but that critical incident exposure was only weakly associated with poor
global sleep quality. In contrast, prolonged exposure to routine stress factors from officers’ general
work environment was found to be strongly associated with poor global sleep quality. This result is in
agreement with what is reported by other authors, according to which the stress of routine operations
can be more harmful to the health of the police operators than exposure to a single stressful event.
The study of Hartley et al. [41] on 356 police officers from the BCOPS cohort confirmed that
different types of police stress may adversely affect sleep quality, and those with higher depressive
symptoms may be more adversely affected by police stress. Everding et al. [39] observed that poor sleep
was associated with decreased health-related quality of life and depressive symptoms. Chang et al. [35]
showed that poor sleepers in Taiwanese police had a higher prevalence of metabolic syndrome (MetS)
and abdominal obesity than other officers. In other studies, the association between quality of life and
quality of sleep was statistically significant among military police officers.
However, some scholars reported also negative findings. For example, Yoo and Franke [50] failed
to demonstrate a significant association between sleep quality and MetS in a very small sample of police
officers, even if they found a relationship between long sleep duration and MetS. Bernardo et al. [33]
failed to demonstrate the association that would be expected between exercise/physical activity level
and a good quality of sleep in a sample taken from the Brazilian military police.
4. Discussion
Our data documented that police officers show a considerable level of poor sleep quality as
assessed by means of the PSQI, the most used tool to evaluate sleep disorders both in clinical and not
clinical populations. The current quantitative analysis has allowed to estimate that more than half of
policeman complain of bad sleep quality. Statistically significant associations were found with years of
service and being on evening/night shift. More in detail, work seniority was found to correlate with
higher sleep quality, suggesting that adaptive mechanisms and strategies could intervene, whereas
shift work resulted in worse sleep outcomes. These results are highly relevant because police officers
emerge as a population at augmented risk of sleep disorders. This characterizes police officers as
population target for health promotion programs, especially focused on sleep hygiene and healthy
lifestyle habits. These interventions could be particularly useful for police officers at the beginning
of their career and for those on evening/night shift. To the best of our knowledge, this is the first
systematic review and meta-analysis that provides a quantitative, updated estimation of subjective
sleep quality among police officers.
Sleep disorders are common but remain largely undiagnosed and untreated in general population,
and also in police officers [51]. Rajaratnam et al. [25] performed the most comprehensive sleep
disorders screening program in this occupational group and observed that 40.4% of police officers
reported symptoms consistent with at least one sleep disorder, where the most prevalent disorder
was obstructive sleep apnea (OSA), followed by moderate-to-severe insomnia and shift work disorder.Int. J. Environ. Res. Public Health 2019, 16, 885 11 of 15
Authors observed that sleep disorders were significantly associated with increased risk of self-reported
adverse health, performance and safety outcomes.
The quantitative synthesis conducted in the present study indicates that 51% of police officers
reported bad sleep quality, with a pooled global PSQI score of 5.6. These data are significantly higher
than those observed in community samples. The percentage of general population reporting poor
sleep quality ranges between 26.5% in Austrian males and 32% in both genders [52] and 39% among
adult Chinese in Hong Kong [53]. Hinz et al. [54] in a survey regarding a sample of more than
9,000 adults, obtained a PSQI global score of 4.38 for male participants. The results observed in our
meta-analysis, obtained from observations composed mainly by men, confirmed that police officers
present a significant higher PSQI score than the general population.
The heterogeneity in our analysis was elevated. However, we could not perform a moderator
analysis, because the determinants of sleep quality in the included studies were quite different.
The possible reasons of the high heterogeneity could be the variety of samples employed in the studies
by age, sex distribution, health conditions and others characteristics. Moreover, the low-moderate
quality of the studies could have influenced data about the heterogeneity. Selected studies observed
that occupational stress and traumatic events were among the strongest predictors of low sleep
quality. These results are in line with those obtained among other workers and occupational groups.
For instance, truck drivers that reported bad sleep quality had a worse psychological wellbeing than
the group of good sleepers [55]. In a sample of firefighters, in addition to the high prevalence of sleep
disturbance, a significant relationship between psychological distress and poor sleep quality was also
identified [56].
Similar results were obtained in a wide sample of female workers in manufacturing jobs [57],
and in a group of newspaper couriers who permanently woke up early [58]. Another important factor
that could influence sleep quality is shift work. Police officer sleep and wellbeing could be affected by
nightshift and long work schedules. This result confirms the findings observed in other categories
of workers.
Polysomnographic studies have demonstrated the existence of a dose-response relationship
between the duration of shift work and the frequency of altered sleep patterns [58,59]. At the
meta-regression analysis, we were able to find a statistically significant association and to confirm this
relationship among police officers. The poor quality of sleep in the police officers of the selected studies
was associated with physical illnesses, particularly of a cardiovascular nature, and poor mental health
in the observed cohorts. The few observations that have studied the association of sleep disorders
with adverse health effects do not allow to reach definitive evidence, but the results are in line with
the literature trends. A recent longitudinal study observed that police officers suffering from stress
and sleep disorders had a significantly greater risk of developing metabolic syndrome than their less
distressed colleagues with good sleep habits [23].
In this review, all the selected studies had a cross-sectional design. This does not allow us to
exclude reverse causation. The most plausible explanation of the observed association is that the
poor quality of sleep could cause physical and mental illness, but the opposite relationship cannot be
ruled out. A circular relationship between sleep and health variables is also possible. A recent review
concluded that sleep can act as a moderator; therefore, a vicious circle between low wellbeing and
poor sleep quality can affect the performance, the health and the safety of workers [60].
However, this systematic review and meta-analysis has some limitations. The exclusion of studies
that did not use the PSQI may have reduced the number of observations and studies addressing sleep
problems in police officers. However, this choice made it possible to compare very different cases
with the same measure, ensuring the reliability of the findings. Another shortcoming is given by the
medium-low quality of the included studies. This phenomenon is intrinsic to all the investigations
conducted on the police forces. The most likely explanation is that the delicacy of police tasks
discourages many researchers from tackling this sector with the due wealth of epidemiological methods.Int. J. Environ. Res. Public Health 2019, 16, 885 12 of 15
Finally, most data were from the United States. No studies carried out in Europe could be found.
This could affect the generalizability of our results.
5. Conclusions
This study, the first meta-analysis about sleep quality in police officers, shows a high presence of
poor sleep quality in this workers’ collective. The meta-analysis of the scores obtained with the PSQI in
the different studies showed a pooled mean score higher than the cut-off that is considered indicative
of poor quality of sleep. Significant associations with work seniority and shift work could be detected.
Sleep disorders are a relevant issue among police officers, and can cause significant damage to
health. Sleep health promotion programs are, therefore, strongly needed in police forces. The health
and wellbeing of the police officers, because of the type of their work, should be pursued not only from
the viewpoint of occupational medicine but also within the perspective of public health, in order to
guarantee the safety of all of society. Society as a whole has a high interest in improving the health of
police officers. The scientific world should contribute to this need by improving the quality of studies
dedicated to police work.
Author Contributions: Conceptualization, S.G., O.G. and N.M.; methodology, M.P. and N.L.B.; software, M.P. and
N.L.B.; validation, M.P. and N.L.B.; formal analysis, M.P. and N.L.B.; investigation, S.G., O.G. and N.M.; resources,
S.G.; data curation, M.P. and N.L.B.; writing—original draft preparation, S.G., O.G. and N.M.; writing—review
and editing, S.G., O.G., M.P., N.L.B. and N.M.; visualization, M.P. and N.L.B.; supervision, S.G. and N.M.; project
administration, S.G.; funding acquisition, S.G.
Funding: This research received no external funding.
Conflicts of Interest: The authors declare no conflicts of interest.
References
1. Simonelli, G.; Marshall, N.S.; Grillakis, A.; Miller, C.B.; Hoyos, C.M.; Glozier, N. Sleep health epidemiology
in low and middle-income countries: A systematic review and meta-analysis of the prevalence of poor sleep
quality and sleep duration. Sleep Health 2018, 4, 239–250. [CrossRef] [PubMed]
2. Min, C.; Kim, H.J.; Park, I.S.; Park, B.; Kim, J.H.; Sim, S.; Choi, H.G. The association between sleep duration,
sleep quality, and food consumption in adolescents: A cross-sectional study using the Korea Youth Risk
Behavior Web-based Survey. BMJ Open 2018, 8, e022848. [CrossRef] [PubMed]
3. Rahe, C.; Czira, M.E.; Teismann, H.; Berger, K. Associations between poor sleep quality and different
measures of obesity. Sleep Med. 2015, 16, 1225–1228. [CrossRef] [PubMed]
4. Nixon, J.P.; Mavanji, V.; Butterick, T.A.; Billington, C.J.; Kotz, C.M.; Teske, J.A. Sleep disorders, obesity,
and aging: The role of orexin. Ageing Res. Rev. 2015, 20, 63–73. [CrossRef] [PubMed]
5. Okubo, N.; Matsuzaka, M.; Takahashi, I.; Sawada, K.; Sato, S.; Akimoto, N.; Umeda, T.; Nakaji, S. Hirosaki
University Graduate School of Medicine. Relationship between self-reported sleep quality and metabolic
syndrome in general population. BMC Public Health 2014, 14, 562. [CrossRef] [PubMed]
6. Hoevenaar-Blom, M.P.; Spijkerman, A.M.; Kromhout, D.; van den Berg, J.F.; Verschuren, W.M. Sleep duration
and sleep quality in relation to 12-year cardiovascular disease incidence: The MORGEN study. Sleep 2011,
34, 1487–1492. [CrossRef] [PubMed]
7. St-Onge, M.P.; Grandner, M.A.; Brown, D.; Conroy, M.B.; Jean-Louis, G.; Coons, M.; Bhatt, D.L. American
Heart Association Obesity, Behavior Change, Diabetes, and Nutrition Committees of the Council on
Lifestyle and Cardiometabolic Health; Council on Cardiovascular Disease in the Young; Council on
Clinical Cardiology; and Stroke Council. Sleep duration and quality: Impact on lifestyle behaviors and
cardiometabolic health: A scientific statement from the American Heart Association. Circulation 2016, 134,
e367–e386. [PubMed]
8. Dlugaj, M.; Weinreich, G.; Weimar, C.; Stang, A.; Dragano, N.; Wessendorf, T.E.; Teschler, H.; Winkler, A.;
Wege, N.; Moebus, S.; et al. Sleep-disordered breathing, sleep quality, and mild cognitive impairment in the
general population. J. Alzheimers Dis. 2014, 41, 479–497. [CrossRef] [PubMed]Int. J. Environ. Res. Public Health 2019, 16, 885 13 of 15
9. Paunio, T.; Korhonen, T.; Hublin, C.; Partinen, M.; Koskenvuo, K.; Koskenvuo, M.; Kaprio, J. Poor sleep
predicts symptoms of depression and disability retirement due to depression. J. Affect. Disord. 2015, 172,
381–389. [CrossRef] [PubMed]
10. Garbarino, S.; Lanteri, P.; Durando, P.; Magnavita, N.; Sannita, W.G. Co-Morbidity, Mortality, Quality of
Life and the Healthcare/Welfare/Social Costs of Disordered Sleep: A Rapid Review. Int. J. Environ. Res.
Public Health 2016, 13, 831. [CrossRef] [PubMed]
11. Garbarino, S.; Guglielmi, O.; Sanna, A.; Mancardi, G.L.; Magnavita, N. Risk of occupational accidents in
workers with obstructive sleep apnea: Systematic review and meta-analysis. Sleep 2016, 39, 1211–1218.
[CrossRef] [PubMed]
12. Garbarino, S.; Magnavita, N.; Guglielmi, O.; Maestri, M.; Dini, G.; Bersi, F.M.; Toletone, A.; Chiorri, C.;
Durando, P. Insomnia is associated with road accidents. Further evidence from a study on truck drivers.
PLoS ONE 2017, 12, e0187256. [CrossRef]
13. Garbarino, S.; Durando, P.; Guglielmi, O.; Dini, G.; Bersi, F.; Fornarino, S.; Toletone, A.; Chiorri, C.;
Magnavita, N. Sleep apnea, sleep debt and daytime sleepiness are independently associated with road
accidents. A cross-sectional study on truck drivers. PLoS ONE 2016, 11, e0166262. [CrossRef] [PubMed]
14. Magnavita, N.; Garbarino, S. Sleep, health and wellness at work: A scoping review. Int. J. Environ. Res.
Public Health 2017, 14, 1347. [CrossRef] [PubMed]
15. Uehli, K.; Mehta, A.J.; Miedinger, D.; Hug, K.; Schindler, C.; Holsboer-Trachsler, E.; Leuppi, J.D.; Künzli, N.
Sleep problems and work injuries: A systematic review and meta-analysis. Sleep Med. Rev. 2014, 18, 61–73.
[CrossRef] [PubMed]
16. Kim, H.C.; Kim, B.K.; Min, K.B.; Min, J.Y.; Hwang, S.H.; Park, S.G. Association between job stress and
insomnia in Korean workers. J. Occup. Health 2011, 53, 164–174. [PubMed]
17. Van Laethem, M.; Beckers, D.G.; Kompier, M.A.; Kecklund, G.; van den Bossche, S.N.; Geurts, S.A.
Bidirectional relations between work-related stress, sleep quality and perseverative cognition.
J. Psychosom. Res. 2015, 79, 391–398. [CrossRef] [PubMed]
18. Åkersted, T.; Kecklund, G.; Gillberg, M. Sleep and sleepiness in relation to stress and displaced work hours.
Physiol Behav 2007, 92, 250–255. [CrossRef] [PubMed]
19. Ekstedt, M.; Södeström, M.; Åkerstedt, T.; Nilsson, J.; Søndergaard, H.P.; Aleksander, P. Disturbed sleep and
fatigue in occupational burnout. Scand. J. Work Environ. Health 2006, 32, 121–131. [PubMed]
20. Habersaat, S.A.; Geiger, A.M.; Abdellaoui, S.; Wolf, J.M. Health in police officers: Role of risk factor clusters
and police divisions. Soc. Sci. Med. 2015, 143, 213–222. [CrossRef] [PubMed]
21. Santana, A.M.; Gomes, J.K.; De Marchi, D.; Girondoli, Y.M.; Rosado, L.E.; Rosado, G.P.; de Andrade, I.M.
Occupational stress, working condition and nutritional status of military police officers. Work 2012, 41,
2908–2914. [CrossRef] [PubMed]
22. Dubrow, R.; Burnett, C.A.; Gute, D.M.; Brockert, J.E. Ischemic heart disease and acute myocardial infarction
mortality among police officers. J. Occup. Med. 1998, 30, 650–654.
23. Garbarino, S.; Magnavita, N. Work Stress and metabolic syndrome in police officers. A prospective study.
PLoS ONE 2015, 10, e0144318. [CrossRef] [PubMed]
24. Garbarino, S.; Cuomo, G.; Chiorri, C.; Magnavita, N. Association of work-related stress with mental health
problems in a special police force unit. BMJ Open 2013, 3, e002791. [CrossRef] [PubMed]
25. Rajaratnam, S.M.; Barger, L.K.; Lockley, S.W.; Shea, S.A.; Wang, W.; Landrigan, C.P.; O’ Brien, C.S.; Qadri, S.;
Sullivan, J.P.; Cade, B.E.; et al. Sleep disorders, health, and safety in police officers. JAMA 2011, 306,
2567–2578. [CrossRef] [PubMed]
26. Garbarino, S.; De Carli, F.; Nobili, L.; Mascialino, B.; Squarcia, S.; Penco, M.A.; Beelke, M.; Ferrillo, F.
Sleepiness and sleep disorders in shift workers: A study on a group of Italian police officers. Sleep 2002, 25,
648–653. [PubMed]
27. Garbarino, S. 24-Hour work: The interaction of stress and changes in the sleep-wake cycle in the police force.
G. Ital. Med. Lav. Ergon. 2014, 36, 392–396. [PubMed]
28. Buysse, D.J.; Reynolds, C.F.; Monk, T.H.; Berman, S.R.; Kupfer, D.J. The Pittsburgh Sleep Quality Index:
A new instrument for psychiatric practice and research. Psychiatry Res. 1989, 28, 193–213. [PubMed]
29. Mollayeva, T.; Thurairajah, P.; Burton, K.; Mollayeva, S.; Shapiro, C.M.; Colantonio, A. The Pittsburgh sleep
quality index as a screening tool for sleep dysfunction in clinical and non-clinical samples: A systematic
review and meta-analysis. Sleep Med. Rev. 2016, 25, 52–73. [CrossRef] [PubMed]Int. J. Environ. Res. Public Health 2019, 16, 885 14 of 15
30. Wells, G.A.; Shea, B.; O’Connel, D.; Petersen, J.; Welch, V.; Losos, M.; Tugwell, P. The Newcastle-Ottawa
Scale (NOS) for Assessing the Quality of Nonrandomized Studies in Meta-Analyses. 2012. Available online:
http://www.ohri.ca/programs/clinical_epidemiology/oxford.asp (accessed on 5 September 2018).
31. Greenland, S. Variance estimators for attributable fraction estimates consistent in both large strata and sparse
data. Stat. Med. 1987, 6, 701–708. [PubMed]
32. Borenstein, M.; Hedges, L.V.; Higgins, J.P.T.; Rothstein, H.R. Introduction to Meta-Analysis; Wiley: Chichester,
UK, 2011.
33. Bernardo, V.M.; Cascaes da Silva, F.; Goncalves Ferreira, E.; Bento, G.G.; Zilch, M.C.; Andrade de Sousa, B.;
da Silva, R. Actividade fisica e qualidade do sono em policiais militares. Physical activity and sleep quality
in military police officers. Rev. Bras. Cienc. Esporte 2018, 408, 131–137. [CrossRef]
34. Bond, J.; Hartley, T.A.; Sarkisian, K.; Andrew, M.E.; Charles, L.E.; Violanti, J.M.; Burchfiel, C.M. Association
of traumatic police event exposure with sleep quality and quantity in the BCOPS Study cohort. Int. J. Emerg.
Ment. Health 2013, 15, 255–265. [PubMed]
35. Chang, J.H.; Huang, P.T.; Lin, Y.K.; Lin, C.E.; Lin, C.M.; Shieh, Y.H.; Lin, Y.C. Association between sleep
duration and sleep quality, and metabolic syndrome in Taiwanese police officers. Int. J. Occup. Med. Environ.
Health 2015, 28, 1011–1023. [CrossRef] [PubMed]
36. Charles, L.E.; Slaven, J.E.; Mnatsakanova, A.; Ma, C.; Violanti, J.M.; Fekedulegn, D.; Andrew, M.E.; Vila, B.J.;
Burchfiel, C.M. Association of perceived stress with sleep duration and sleep quality in police officers. Int. J.
Emerg. Ment. Health 2011, 13, 229–241. [PubMed]
37. Chopko, B.A.; Palmieri, P.A.; Adams, R.E. Trauma-related sleep problems and associated health outcomes in
police officers: A path analysis. J. Interpers. Violence 2018. [CrossRef]
38. Elliott, J.L.; Lal, S. Blood pressure, sleep quality and fatigue in shift working police officers: Effects of a
twelve hour roster system on cardiovascular and sleep health. Int. J. Environ. Res. Public Health 2016, 13, 172.
[CrossRef] [PubMed]
39. Everding, B.; Hallam, J.E.; Kohut, M.L.; Lee, D.C.; Anderson, A.A.; Franke, W.D. Association of sleep quality
with cardiovascular disease risk and mental health in law enforcement officers. J. Occup. Environ. Med. 2016,
58, e281–e286. [CrossRef] [PubMed]
40. Fekedulegn, D.; Burchfiel, C.M.; Charles, L.E.; Hartley, T.A.; Andrew, M.E.; Violanti, J.M. Shift Work and
Sleep Quality Among Urban Police Officers: The BCOPS Study. J. Occup. Environ. Med. 2016, 58, e66–e71.
[CrossRef] [PubMed]
41. Hartley, T.A.; Violanti, J.M.; Sarkisian, K.; Fekedulegn, D.; Mnatsakanova, A.; Andrew, M.E.; Burchfiel, C.M.
Association between police-specific stressors and sleep quality: Influence of coping and depressive symptoms.
J. Law Enforc. Leadersh. Ethics 2014, 1, 31–48. [PubMed]
42. McCanlies, E.C.; Slaven, J.E.; Smith, L.M.; Andrew, M.E.; Charles, L.E.; Burchfiel, C.M.; Violanti, J.M.
Metabolic syndrome and sleep duration in police officers. Work 2012, 43, 133–139. [PubMed]
43. Neylan, T.C.; Metzler, T.J.; Best, S.R.; Weiss, D.S.; Fagan, J.A.; Liberman, A.; Rogers, C.; Vedantham, K.;
Brunet, A.; Lipsey, T.L.; et al. Critical incident exposure and sleep quality in police officers. Psychosom. Med.
2002, 64, 345–352. [CrossRef] [PubMed]
44. Neylan, T.C.; Metzler, T.J.; Henn-Haase, C.; Blank, Y.; Tarasovsky, G.; McCaslin, S.E.; Lenoci, M.; Marmar, C.R.
Prior night sleep duration is associated with psychomotor vigilance in a healthy sample of police academy
recruits. Chronobiol. Int. 2010, 27, 1493–1508. [CrossRef] [PubMed]
45. Pinto, J.N.; Perin, C.; Dick, N.R.; Lazzarotto, A.R. Avaliação do sono em um grupo de policiais militares de
elite. Acta Paul. Enferm. 2018, 31, 153–161. [CrossRef]
46. Ramey, S.L.; Perkhounkova, Y.; Moon, M.; Budde, L.; Tseng, H.C.; Clark, M.K. The effect of work shift and
sleep duration on various aspects of police officers’ health. Workplace Health Saf. 2012, 60, 215–222. [CrossRef]
[PubMed]
47. Roustaei, N.; Jamali, H.; Jamali, M.R.; Nourshargh, P.; Jamali, J. The association between quality of sleep
and health-related quality of life in military and non-military women in Tehran, Iran. Oman Med. J. 2017, 32,
134-130. [CrossRef] [PubMed]
48. Slaven, J.E.; Mnatsakanova, A.; Burchfiel, C.M.; Smith, L.M.; Charles, L.E.; Andrew, M.E.; Gu, J.K.; Ma, C.;
Fekedulegn, D.; Violanti, J.M. Association of sleep quality with depression in police officers. Int. J. Emerg.
Ment. Health 2011, 13, 267–277. [PubMed]Int. J. Environ. Res. Public Health 2019, 16, 885 15 of 15
49. Yadav, A.; Rani, S.; Singh, S. Working “out-of-phase” with reference to chronotype compromises sleep quality
in police officers. Chronobiol. Int. 2016, 33, 151–160. [CrossRef] [PubMed]
50. Yoo, H.; Franke, W.D. Sleep habits, mental health, and the metabolic syndrome in law enforcement officers.
J. Occup. Environ. Med. 2013, 55, 99–103. [CrossRef] [PubMed]
51. Garbarino, S.; Magnavita, N.; Elovainio, M.; Heponiemi, T.; Ciprani, F.; Cuomo, G.; Bergamaschi, A. Police
job strain during routine activities and a major event. Occup. Med. 2011, 61, 395–399. [CrossRef] [PubMed]
52. Zeitlhofer, J.; Schmeiser-Rieder, A.; Tribl, G.; Rosenberger, A.; Bolitschek, J.; Kapfhammer, G.; Saletu, B.;
Katschnig, H.; Holzinger, B.; Popovic, R.; et al. Sleep and quality of life in the Austrian population.
Acta Neurol. Scand. 2000, 102, 249–257. [CrossRef] [PubMed]
53. Wong, W.S.; Fielding, R. Prevalence of insomnia among Chinese adults in Hong Kong: A population-based
study. J Sleep Res 2011, 20, 117–126. [CrossRef] [PubMed]
54. Hinz, A.; Glaesmer, H.; Brähler, E.; Löffler, M.; Engel, C.; Enzenbach, C.; Hegerl, U.; Sander, C. Sleep quality
in the general population: Psychometric properties of the Pittsburgh Sleep Quality Index, derived from a
German community sample of 9284 people. Sleep Med. 2017, 30, 57–63. [CrossRef] [PubMed]
55. Guglielmi, O.; Magnavita, N.; Garbarino, S. Sleep quality, obstructive sleep apnea, and psychological distress
in truck drivers: A cross-sectional study. Soc. Psychiatry Psychiatr. Epidemiol. 2018, 53, 531–536. [CrossRef]
[PubMed]
56. Vargas de Barros, V.; Martins, L.F.; Saitz, R.; Bastos, R.R.; Ronzani, T.M. Mental health conditions, individual
and job characteristics and sleep disturbances among firefighters. J. Health Psychol. 2013, 18, 350–358.
[CrossRef] [PubMed]
57. Cho, H.S.; Kim, Y.W.; Park, H.W.; Lee, K.H.; Jeong, B.G.; Kang, Y.S.; Park, K.S. The relationship between
depressive symptoms among female workers and job stress and sleep quality. Ann. Occup. Environ. Med.
2013, 25, 12. [CrossRef] [PubMed]
58. Kara, N. Effect of sleep quality on psychiatric symptoms and life quality in newspaper couriers.
Noro Psikiyatr. Ars. 2016, 53, 102–107. [CrossRef] [PubMed]
59. Monk, T.H.; Buysse, D.J.; Billy, B.D.; Fletcher, M.E.; Kennedy, K.S. Polysomnographic sleep and circadian
temperature rhythms as a function of prior shift work exposure in retired seniors. Healthy Aging Clin.
Care Elder 2013, 2013, 9–19. [PubMed]
60. Garbarino, S.; Guglielmi, O.; Sannita, W.G.; Magnavita, N.; Lanteri, P. Sleep and mental health in truck
drivers: Descriptive review of the current evidence and proposal of strategies for primary prevention. Int. J.
Environ. Res. Public Health 2018, 15, 1852. [CrossRef] [PubMed]
© 2019 by the authors. Licensee MDPI, Basel, Switzerland. This article is an open access
article distributed under the terms and conditions of the Creative Commons Attribution
(CC BY) license (http://creativecommons.org/licenses/by/4.0/).You can also read