Ambient air quality monitoring report for the Waikato Region 2017 - Waikato Regional Council Technical Report 2018/15
←
→
Page content transcription
If your browser does not render page correctly, please read the page content below
Waikato Regional Council Technical Report 2018/15

Ambient air quality monitoring
report for the Waikato Region -
2017

www.waikatoregion.govt.nz
ISSN 2230-4355 (Print)
ISSN 2230-4363 (Online)
Prepared by:
Jonathan Caldwell

For:
Waikato Regional Council
Private Bag 3038
Waikato Mail Centre
HAMILTON 3240

August 2019

Document #: 12332239
Peer reviewed by:
 Dr Emily Wilton (Environet Ltd)        Date         March 2019

 Approved for release by:
 Mike Scarsbrook                        Date         June 2019

Disclaimer
This technical report has been prepared for the use of Waikato Regional Council as a reference document
and as such does not constitute Council’s policy.

Council requests that if excerpts or inferences are drawn from this document for further use by individuals
or organisations, due care should be taken to ensure that the appropriate context has been preserved,
and is accurately reflected and referenced in any subsequent spoken or written communication.

While Waikato Regional Council has exercised all reasonable skill and care in controlling the contents of
this report, Council accepts no liability in contract, tort or otherwise, for any loss, damage, injury or
expense (whether direct, indirect or consequential) arising out of the provision of this information or its
use by you or any other party.

Doc # 12332239
Doc # 12332239
Acknowledgement
The Environmental Monitoring team, particularly Kevin Mullane and Kane Lynn, are gratefully
acknowledged for the supply, collection and management of the monitoring data used in this
report and servicing and maintenance of the monitoring stations used. Asaeli Tulagi is also
thanked for coordinating laboratory services.

Doc # 12332239                                                                        Page i

Table of Contents
Executive summary vi
1 Introduction 1
1.1 Background 1
1.2 Regulatory requirements and assessment criteria 1
1.3 Monitoring objectives 4
1.4 Airsheds and contaminants monitored in 2017 4
2 Methodology 10
2.1 PM10 & PM2.5 monitoring 10
2.2 BTEX monitoring 11
2.3 Nitrogen dioxide monitoring 12
2.4 Meteorological monitoring 14
2.5 Trend analysis 15
3 Results 16
3.1 PM10 monitoring in Hamilton 16
3.2 BTEX monitoring in Hamilton 19
3.3 NO2 monitoring in Hamilton 20
3.4 PM10 and PM2.5 monitoring in Tokoroa 21
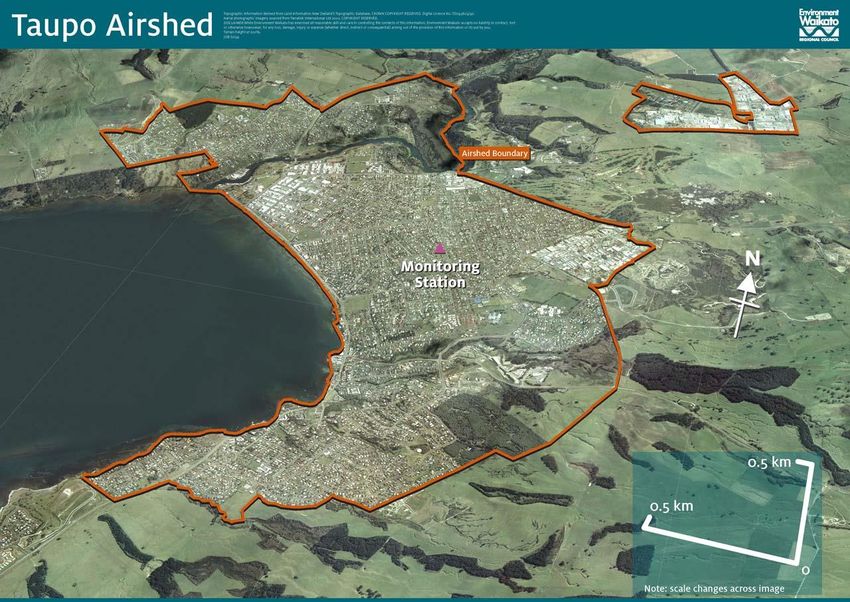
3.5 PM10 monitoring in Taupo 29
3.6 NO2 monitoring in Taupo 34
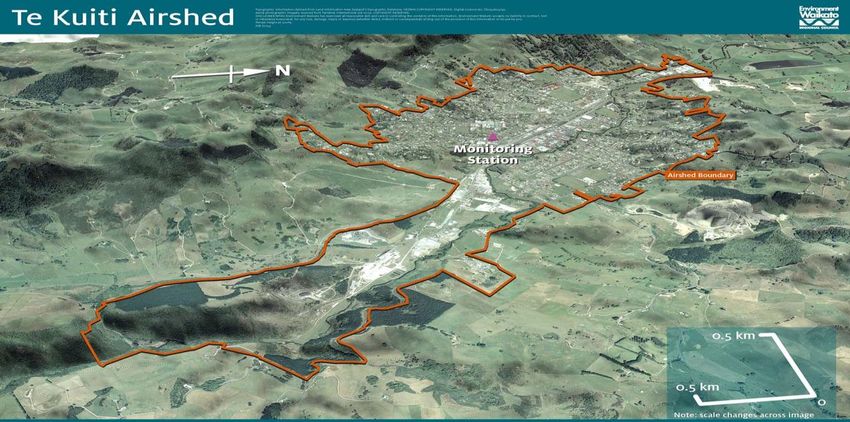
3.7 PM10 monitoring in Te Kuiti 35
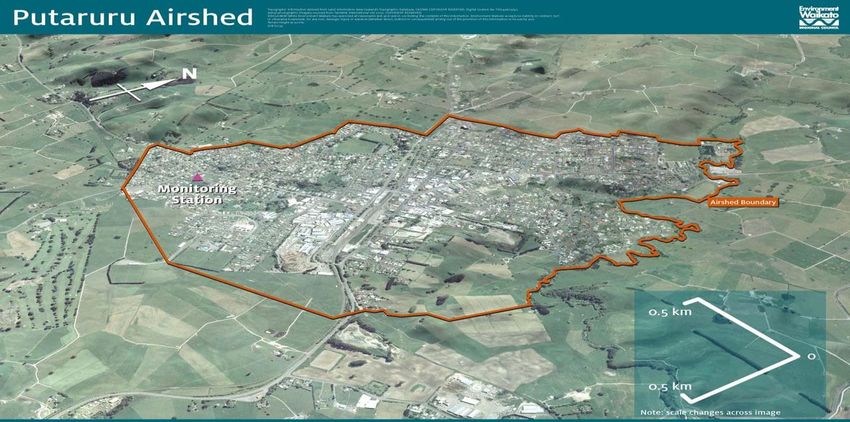
3.8 PM10 monitoring in Putaruru 38
3.9 PM10 monitoring in Turangi 41
3.10 NO2 monitoring in Cambridge 43
3.11 NO2 monitoring in Te Awamutu 44
3.12 PM10 monitoring in Morrinsville 44
3.13 PM10 monitoring in Thames 45
4 Summary and conclusions 46
References 49
Appendix 1 51
Appendix 2 53
Appendix 3 55
Appendix 4 56
Appendix 5 57
Appendix 6 58
Appendix 7 58
Appendix 8 59
Page ii Doc # 12332239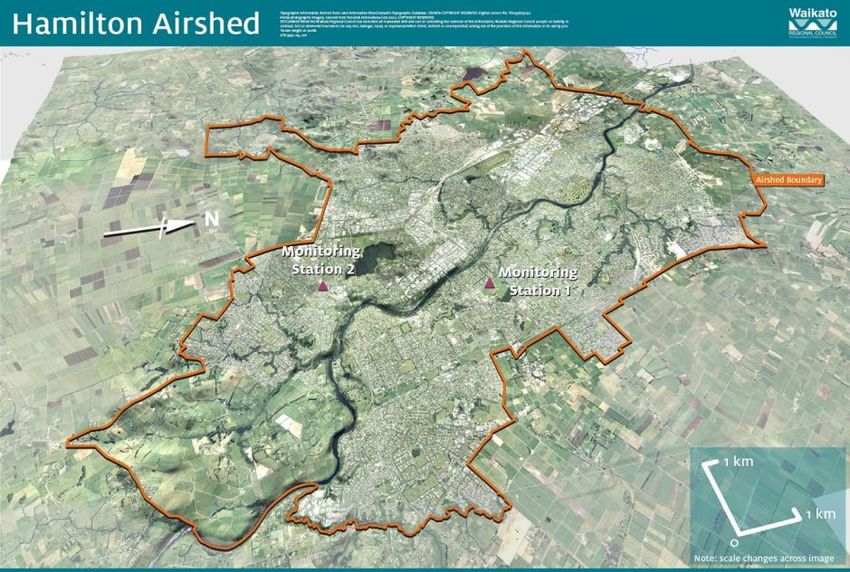
List of Tables
Table 1.1: National Environmental Standards for Air Quality.                                 2
Table 1.2: Ambient air quality guidelines.                                                   2
Table 2.1: PM10 and PM2.5 monitoring stations and instruments for 2017.                     10
Table 2.2: Site-specific corrections applied to BAM PM10 data.                              11
Table 2.3: Site locations for passive NO2 monitoring in 2017.                               12
Table 2.4: Meteorological monitoring instrument details.                                    15
Table 3.1: Annual average concentrations of volatile organic compounds (VOCs) at Hamilton sites
            for 2017.                                                                       20
Table 3.2: Dates and concentrations for exceedences of the PM10 standard of 50 µg/m3 as a 24-
            hour average in Tokoroa during 2017.                                            21
Table 4.1: Summary of PM10 monitoring results for 2017.                                     46
Table 4.2: Five-year exceedance average and trend analysis for the five worst airsheds.     47

List of figures
Figure 1.1: Map of Waikato Region indicating the 20 urban centres that have been gazetted as
            airsheds.                                                                        3
Figure 1.2: Hamilton, Tokoroa and Taupo 1                                                    5
Figure 1.3: Te Kuiti, Putaruru and Turangi airsheds with monitoring stations identified by pink
            triangle.                                                                        6
Figure 1.4: Cambridge, Te Awamutu-Kihikihi and Morrinsville airsheds with monitoring stations
            identified by pink triangle.                                                     7
Figure 1.5: Thames airshed with monitoring station identified by pink triangle.              8
Figure 2.1: Map of BTEX sites in Hamilton 1                                                 11
Figure 2.2: Map of passive NO2 monitoring sites in Hamilton.                                13
Figure 2.3: Map of passive NO2 monitoring sites in Cambridge. Te Awamutu and Taupo.         14
Figure 3.1: 24-hour average PM10 concentrations measured at Ohaupo Road during 2017.        16
Figure 3.2: 24-hour average PM10 concentrations measured at Claudelands during 2016.        16
Figure 3.3: Comparison of 24-hour average PM10 concentrations measured at Claudelands in
            Hamilton from 2014 to 2017 relative to air quality indicator categories.        17
Figure 3.4: Comparison of 24-hour average PM10 concentrations measured at Ohaupo Road site
            in Hamilton from 2012 to 2016 relative to air quality indicator categories.     17
Figure 3.5 Comparison of monthly average PM10 concentrations measured at Claudelands and
            Ohaupo Rd sites in Hamilton in 2017.                                            18
Figure 3.6: Windrose of wind direction and windspeed data as measured at Claudelands station
            in Hamilton in 2016 and 2017.                                                   18
Figure 3.7: Hourly average PM10 concentrations, wind speed, wind direction and temperature on
            days when PM10 concentrations were elevated in Hamilton.                        19

Doc # 12332239                                                                                    Page iii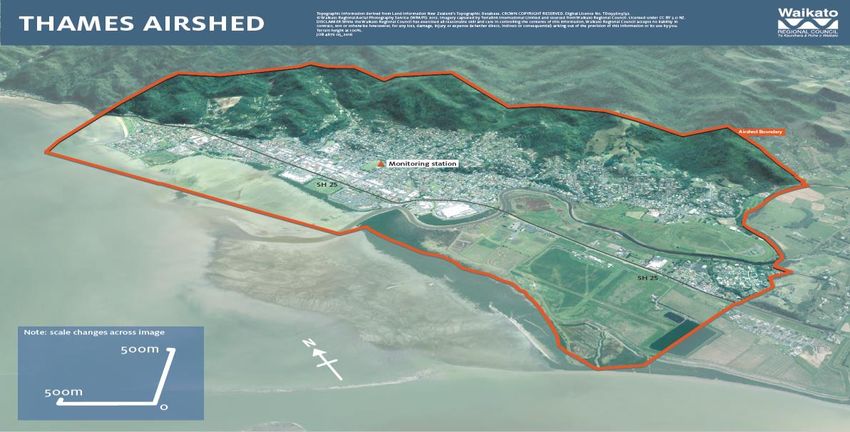
Figure 3.8: Annual average benzene measured at Hamilton sites (2003 to 2017).                     20
Figure 3.9: Annual average NO2 measured at Hamilton sites (2007 to 2017).                         21
Figure 3.10: 24 hour average PM10 concentrations measured in Tokoroa during 2017.                 22
Figure 3.11: 24 hour average PM2.5 concentrations measured in Tokoroa during 2017.                22
Figure 3.12: Relationship between 24 hour average PM10 and PM2.5 concentrations measured in
            Tokoroa for winter 2017.                                                              23
Figure 3.13: Comparison of 24 hour average PM10 concentrations measured in Tokoroa from 2006
            to 2017 to air quality indicator categories.                                          23
Figure 3.14: Monthly average PM10 concentrations measured in Tokoroa in 2017.                     24
Figure 3.15: Number of days (left axis) when the PM10 standard of 50 µg/m3 as a 24 hour average
            was exceeded compared with the maximum 24 hour average concentration and the
            2nd highest 24 hour average concentration (right axis) measured from 2006 to 2017.
                                                                                                  24
Figure 3.16: Windrose of wind direction and windspeed data as measured at the Tokoroa station
            in 2016 and 2017.                                                                     25
Figure 3.17: Hourly average PM10, PM2.5, wind speed, wind direction and temperature on days
            when PM10 concentrations exceeded the NES in Tokoroa.                                 26
Figure 3.18: Year-to-year variation of the proportion of high pollution potential days which resulted
            in exceedances.                                                                       27
Figure 3.19: Year-to-year variation of the absolute number of high pollution potential days
            compared with the total number of exceedance days.                                    28
Figure 3.20: Comparison of the five-year exceedance averages for the period 2006 to 2017.         28
Figure 3.21: 24 hour average PM10 concentrations measured at Taupo during 2017.                   29
Figure 3.22: Comparison of 24 hour average PM10 concentrations measured at the Taupo site from
            2006 to 2017 to air quality indicator categories.                                     30
Figure 3.23: Monthly average PM10 concentrations measured in Taupo in 2017.                       30
Figure 3.24: Number of days (left axis) when the 24 hour average standard of 50 µg/m 3 was
            exceeded compared with the maximum concentration and the 2nd highest
            concentration (right axis) measured from 2006 to 2017.                                31
Figure 3.25: Windrose of wind direction and windspeed data as measured at the Taupo station in
            2016 and 2017.                                                                        31
Figure 3.26: Hourly average PM10, wind speed, wind direction and temperature on days when the
            24-hour average PM10 concentration was elevated in Taupo.                             32
Figure 3.27: Year-to-year variation in the proportion of high potential pollution days which resulted
            in exceedances.                                                                       33
Figure 3.28: Year-to-year variation in the absolute number of high pollution potential days
            compared with the total number of exceedance days.                                    33
Figure 3.29: Comparison of the five year exceedance averages for the period 2006 to 2017.         34
Figure 3.30: Annual average NO2 concentrations measured in Taupo (2007 to 2017).                  34
Figure 3.31: 24 hour average PM10 concentrations measured in Te Kuiti during 2017.                35
Figure 3.32: Comparison of 24 hour average PM10 concentrations measured at the Te Kuiti site from
            2006 to 2017 relative to air quality indicator categories.                            35
Page iv                                                                                      Doc # 12332239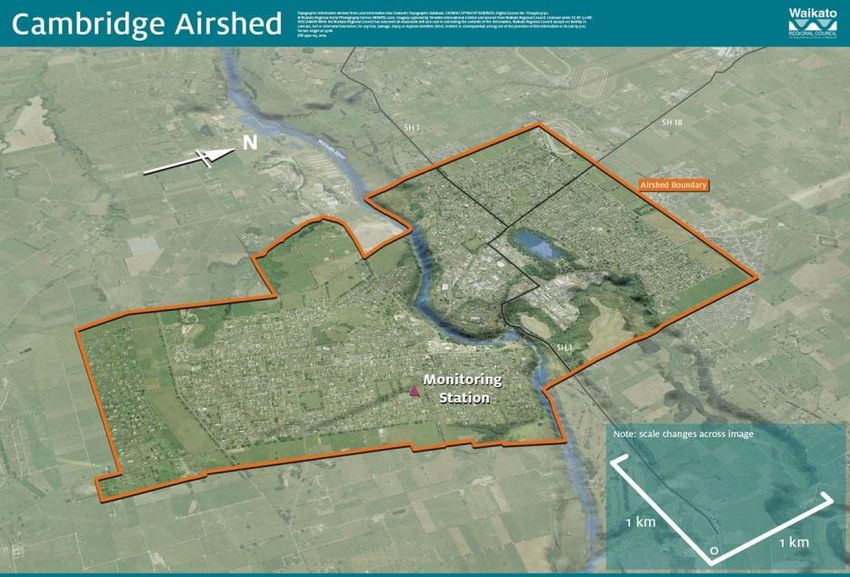
Figure 3.33: Monthly average PM10 concentrations measured in Te Kuiti in 2017.                  36
                                                                                            3
Figure 3.34: Number of days (left axis) when the 24 hour average PM10 standard of 50 µg/m was
            exceeded compared with the maximum concentration and the 2nd highest
            concentration (right axis) measured from 2006 to 2017.                              36
Figure 3.35: Windrose of wind direction and windspeed data as measured at the Te Kuiti station in
            2016 and 2017.                                                                      37
Figure 3.36: Hourly average PM10, wind speed, wind direction, and temperature on 30 June and 26
            July when the maximum 24 hour average PM10 concentrations of 46 µg/m3 and 43
            µg/m3 respectively were recorded at Te Kuiti.                                       37
Figure 3.37: Comparison of the five year exceedance averages for the period 2006 to 2017.       38
Figure 3.38: 24 hour average PM10 concentrations measured at the Putaruru site during 2017. 39
Figure 3.39: Comparison of 24 hour average PM10 concentrations measured at the Putaruru site
            from 2007 to 2017 relative to air quality indicator categories.                     39
Figure 3.40: Monthly average PM10 concentrations measured in Putaruru in 2017.                  40
Figure 3.41: Number of days when the 24 hour average standard of 50 µg/m3 was exceeded
            compared with the maximum concentration and the 2nd highest concentration
            measured from 2007 to 2017.                                                         40
Figure 3.42: Comparison of the five-year exceedance averages for the period 2006 to 2017.       41
Figure 3.43: Daily average PM10 concentrations measured at the Turangi site for 2017.           42
Figure 3.44: Comparison of 24 hour average PM10 concentrations measured at the Turangi site
            from 2009 to 2017 relative to air quality indicator categories.                     42
Figure 3.45: Comparison of the maximum 24 hour average PM10 concentration and the 2nd highest
            average PM10 concentration measured from 2009 to 2017.                              43
Figure 3.46: Annual average NO2 measured in Cambridge (2007 to 2017).                           43
Figure 3.47: Annual average NO2 measured in Te Awamutu (2007 to 2017).                          44
Figure 3.48: 24 hour average PM10 concentrations measured at Morrinsville during 2017.          44
Figure 3.49: Daily average PM10 concentrations measured at Thames during 2017.                  45
Figure 4.1: Comparison of changes in the annual exceedance average (5 year rolling average) for
            Hamilton, Tokoroa, Taupo, Te Kuiti and Putaruru.                                    47

Doc # 12332239                                                                                       Page v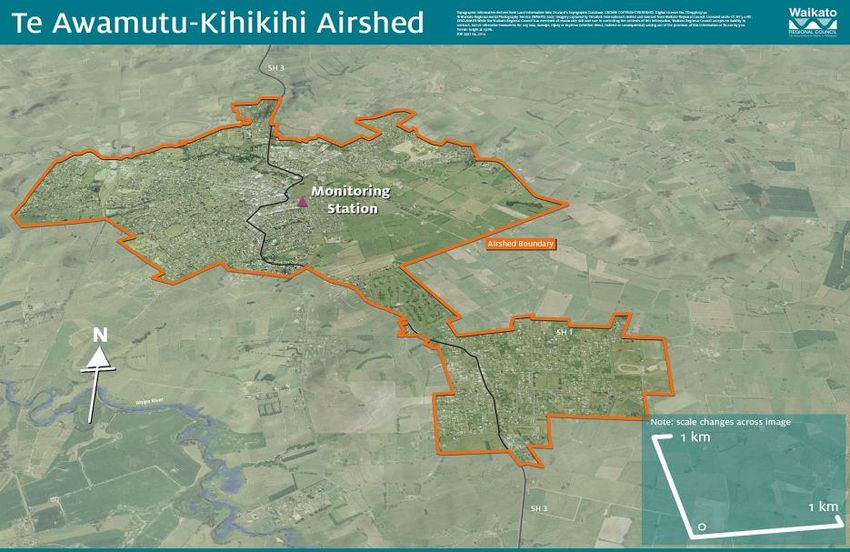
Executive summary
The main air contaminant of concern in the Waikato Region is PM10 (particles in the air 10
microns in diameter or less). Monitoring of PM10 was undertaken in the Hamilton, Tokoroa,
Taupo, Te Kuiti, Putaruru, Turangi, Morrinsville and Thames airsheds during 2017. In addition to
this, PM2.5 (particles in the air 2.5 microns in diameter or less) was monitored in Tokoroa. This
particulate monitoring was targeted mainly at identifying the impacts from domestic home
heating sources.

The National Environmental Standards for Air Quality (NESAQ) has set a maximum concentration
limit for PM10 of 50 µg/m3 as a 24 hour average. The NESAQ allows for one exceedance of this
standard per rolling 12 month period. More than one exceedance within a rolling 12 month period
is a breach of the standard and an airshed becomes classified as polluted as a result. A national
guideline of 20 µg/m3 as an annual average for PM10 is also used for assessment purposes. There
is currently no New Zealand based guideline or standard applicable to PM 2.5 and therefore the
World Health Organisation (WHO) guideline of 25 µg/m3 as a 24 hour average and 10 µg/m3 as an
annual average is used for assessment purposes.

In 2017 the 24 hour average standard for PM10 of 50 µg/m3 was exceeded 10 times in Tokoroa
which is the equivalent of nine breaches (based on one allowable exceedance per 12 month
period). The 24 hour average standard for PM10 of 50 µg/m3 was also exceeded once in Taupo
and once in Putaruru. There were no exceedances in any of the other airsheds monitored.
Annual average concentrations of PM10 were all within the annual average guideline of 20 µg/m3
in all airsheds.

In Tokoroa, PM2.5 concentrations exceeded the WHO guideline of 25 µg/m3 as a 24 hour average
on 53 occasions during 2017. The annual average PM2.5 concentration for Tokoroa was 14.7
µg/m3 which also exceeds the WHO annual average guideline of 10 µg/m3.

A statistical trends analysis of PM10 concentrations indicates a statistically significant decreasing
trend in Te Kuiti, Tokoroa, and Putaruru. A previous decreasing trend identified for Taupo is no
longer significant and indicates that concentrations are starting to level out. No change has been
identified for Hamilton. Improvements have been mainly attributed to reductions in emissions
from home heating sources although changes in meteorological conditions have also likely
contributed to these observed improvements.

Tokoroa has not complied with its specified NESAQ target of no more than three exceedences
of the 24 hour average PM10 standard of 50 µg/m3 from September 2016. Taupo and Putaruru
only just complied with the more stringent NESAQ target of no more than one exceedance of 50
µg/m3 from September 2016. However, ongoing compliance is likely to depend on
meteorological conditions and is unlikely to be sustained long term unless further decreases in
emissions occur. Te Kuiti now meets the criteria of “not polluted” having been compliant with
the NESAQ for over five years which is a pre-requisite for achieving this status under the NESAQ.

While woodburners for domestic home heating have been identified as the main source of poor
air quality in all airsheds, traffic sources in Hamilton have been identified as significant
contributors to poor air quality in localised areas close to busy traffic routes and intersections
based on the results of nitrogen dioxide (NO2) monitoring.

Monitoring of NO2 was undertaken by NZTA in Hamilton, Cambridge, Te Awamutu and Taupo,
in 2017 for purposes of identifying the impacts from traffic related emissions along state
highways. Monitoring of benzene, toluene, xylenes and ethylbenzene (BTEX) were also
undertaken in Hamilton by WRC in 2017 as additional indicators of traffic related emissions.

The results from NO2 monitoring indicate that the Lorne Street/Ohaupo Road site and
Greenwood Road/Killarney Road site in Hamilton continue to exceed the WHO annual guideline
Page vi                                                                               Doc # 12332239
of 40 g/m3 for NO2. No exceedances of the WHO annual guideline for NO2 at the other Hamilton sites and the Cambridge, Te Awamutu and Taupo sites have been identified. Long term seasonal trend analysis provides no indication of either a worsening or improving trend for monthly average NO2 concentrations at any of the monitoring sites for the period 2011 to 2017. Concentrations of benzene in Hamilton were within the national guideline of 3.6 µg/m3 at all sites and show evidence of a decreasing trend. The highest annual concentration was measured at the Greenwood Street monitoring site and was 2.2 µg/m3. Concentrations of toluene, ethylbenzene and xylene were also well within acceptable international criteria. Doc # 12332239 Page vii
1     Introduction
1.1   Background
      New Zealand (and the Waikato region) enjoys good air quality most of the time due to the
      country’s long narrow shape, exposure to strong eastward winds, and typically low population
      density. However, during the winter months when temperature inversions form on cold, still days,
      air pollutants can become trapped close to the ground leading to poor air quality in some towns
      and cities.

      Air quality within towns and cities can be affected by a number of activities including natural
      causes such as sea spray, pollen and volcanic activity and human created causes such as home
      heating, traffic and industrial discharges.

      Although air pollution is a complex mixture of contaminants and particles, the majority of health
      effects in New Zealand are associated with particulate matter less than 10 micrometres in size –
      commonly known as PM10. It is also a good indicator of the sources and effects of other air
      pollutants. However, while PM10 levels pose a risk to human health, it is now well established
      internationally, that the finer particle range, referred to as PM2.5, provides better evidence of
      effects on human health and is more indicative of the problem source, which is combustion
      related.

      The Health and Air Pollution in New Zealand Study (Kuschel et al., 2012) identified that domestic
      fires (open fires and wood and coal burners used for home heating) dominate the health impacts
      associated with PM10 in every location in New Zealand except Auckland.

      Emissions from motor vehicles are also sources of air pollutants that have adverse health effects.
      Exhaust emissions include fine particulate matter, volatile organic compounds (such as benzene)
      and the gases carbon monoxide and nitrogen oxides. Nitrogen dioxide emissions can occur
      directly from combustion processes and as a result of the conversion of nitric oxide gas (also
      produced from combustion processes) reacting in the atmosphere in the presence of ozone. In
      New Zealand, motor vehicle emissions are the main source of nitrogen dioxide in urban areas.

      Other gases (such as ozone and sulphur dioxide) and secondary particulate (sulphates and
      nitrates) can form in the atmosphere from reactions involving some of these primary emissions.
      Sulphur dioxide is typically associated with combustion of fuels containing high levels of sulphur
      such as coal from industry and heavy fuel oils used in shipping.

      Ambient air quality monitoring has been carried out in the Waikato region by the Waikato
      Regional Council (WRC) since 1998. The US EPA define ambient air monitoring as the systematic,
      long-term assessment of pollutant levels by measuring the quantity and types of certain pollutants
      in the surrounding, outdoor air.

1.2   Regulatory requirements and assessment criteria
      In New Zealand, monitoring and management of air quality is undertaken within defined air
      quality management areas referred to as airsheds. Airshed boundaries are officially identified by
      regional councils and approved and made public by the Ministry for the Environment (MfE).

      Regional councils have a responsibility to monitor and manage outdoor air quality under the
      Resource Management Act 1991 (RMA). The National Environmental Standards for Air Quality
      (NESAQ) are mandatory environmental regulations made under the RMA that:

      Doc # 12332239                                                                            Page 1
• direct regional councils to focus on monitoring of PM10 as the main contaminant of
concern and on managing the main source of PM10 emissions, namely woodburners used
for domestic home heating;
• include ambient air quality standards for PM10, carbon monoxide, nitrogen dioxide,
sulphur dioxide and ozone for protecting human health;
• require regional councils to monitor air quality if it is likely that the ambient air quality
standard for a contaminant will be breached in an airshed;
• state that an airshed is classified as polluted if it has more than one PM10 exceedance per
12 month period; and
• state that an airshed ceases to be polluted when the PM10 standard has not been
breached in the airshed for five years.
The air quality standard for PM10 is 50 micrograms per cubic metre of air (50 µg/m3) averaged
over a 24-hour period (from midnight to midnight), with one allowable exceedance per 12-month
period. The standards for PM10, carbon monoxide, nitrogen dioxide, sulphur dioxide and ozone
along with averaging periods and number of allowable exceedances are provided in Table 1.1. A
breach of the standards occurs when more than the allowable number of exceedances occurs
within the specified period.
Table 1.1: National Environmental Standards for Air Quality.
Contaminant Standard Standard Allowable exceedances
Concentration Averaging period per year
Carbon monoxide 10 mg/m3 8-hour 1
Particles (PM10) 50 µg/m3 24-hour 1
Nitrogen dioxide 200 µg/m3 1-hour 9
Sulphur dioxide 350 µg/m3 1-hour 9a
Sulphur dioxide 570 µg/m3 1-hour 0a
Ozone 150 µg/m3 1-hour 0
a. Note that the 1-hour average concentration of sulphur dioxide can exceed 350 µg m-3 up to 9 times within
any 12-month period but can never exceed a 1-hour average of 570 µg m-3.
For the assessment of other air contaminants not included under the NESAQ, the National
Ambient Air Quality guidelines (MfE, 2002) and the World Health Organisation guidelines (WHO,
2005) are used. A subset of ambient air quality guidelines relevant to WRC’s air quality monitoring
programme are provided in Table 1.2.
Table 1.2: Ambient air quality guidelines.
Contaminant Guideline Guideline Source
Concentration Averaging period
Benzene (year 2002) 10 µg/m3 Annual MfE, 2002
Benzene (year 2010) 3.6 µg/m3 Annual MfE, 2002
Particles (PM10) 20 µg/m3 Annual MfE, 2002
Particles (PM2.5) 25 µg/m3 24-hour WHO, 2005
Particles (PM2.5) 10 µg/m3 Annual WHO, 2005
Nitrogen dioxide 40 µg/m3 Annual WHO, 2005
There are 20 airsheds in the Waikato region that have been officially gazetted by MfE for
monitoring and management purposes (refer to Figure 1.1). To date, a total of 14 of these airsheds
have been monitored for PM10. A combination of long-term monitoring and short-term surveys
are undertaken as described below:
• Long-term monitoring is undertaken for airsheds that are shown to either breach or
have the potential to breach the ambient air quality standards. There are currently three
polluted airsheds in the Waikato region, namely Putaruru, Taupo, and Tokoroa. Te Kuiti
and Hamilton, although not currently classified as polluted, are also included for long-
term monitoring purposes due to previous breaches and or ongoing potential for future
breaches.
Page 2 Doc # 12332239• A three-yearly “rolling” survey is undertaken for airsheds that have not yet been
monitored. In these cases, WRC’s monitoring stations are moved to new locations
according to a three year rotation subject to the airshed having had no exceedances of
the 24 hour average PM10 standard over that three year period.
Figure 1.1: Map of Waikato Region indicating the 20 urban centres that have been gazetted as
airsheds.
The NESAQ also sets PM10 compliance targets for polluted airsheds. Polluted airsheds which have
had less than 10 exceedances per year, must not breach the standard after September 2016 (i.e.
Taupo, and Putaruru). Airsheds that have had 10 or more exceedances per year, must have no
more than three exceedances after September 2016 and no more than one exceedance after
September 2020 (i.e. Tokoroa). As of December 2016, the Te Kuiti airshed is now classified as non-
polluted as it has not had a breach of the NESAQ for five years. The Hamilton airshed is also not
classified as polluted as it has not had any breaches of the standard since 2009 apart from a series
of breaches in 2013 which were considered exceptional circumstances and were discounted by
MfE1.
1 An application was made to the Minister for the Environment in August 2013 and an exemption for the eight exceedances was
provided by the Minister in November 2013. As a result, the exceedances do not count towards determining the polluted status
Doc # 12332239 Page 31.3 Monitoring objectives
The objectives of Waikato Regional Council’s ambient air quality monitoring programme are to:
1. Determine compliance with national ambient air quality standards and guidelines.
2. Identify trends in ambient air quality and sources contributing to poor air quality.
3. Provide information to support the implementation of our regional plan and regional
policies on air quality, including consent processing and consented and permitted activity
compliance.
1.4 Airsheds and contaminants monitored in 2017
Ambient air quality and meteorological monitoring for 2017 was undertaken in the following
airsheds:
• Hamilton (PM10, PM2.5, NO2, benzene, ethyl benzene, toluene, xylenes and meteorology)
• Taupo (PM10, NO2 and meteorology)
• Tokoroa (PM10, PM2.5, NO2 and meteorology)
• Te Kuiti (PM10 and meteorology)
• Putaruru (PM10)
• Turangi (PM10)
• Cambridge (NO2)
• Te Awamutu-Kihikihi (NO2)
• Morrinsville (PM10)
• Thames (PM10)
Refer to Figures 1.2 to 1.5 for maps of the airsheds monitored in 2017. All stations, except
Hamilton’s Bloodbank station are set up for assessing ambient air quality including the impacts
of residential solid fuel heating. The Bloodbank station is located 10 metres away from a busy
roadway (Ohaupo Road) and is near to industry discharges (e.g. Waikato Hospital boilers) and is
therefore expected to be more influenced by traffic and industry sources compared with the
other Hamilton station at Claudelands.
of the Hamilton airshed i.e. Hamilton remains a non-polluted airshed and the industry offset and open fire place ban regulations
of the NESAQ are not triggered.
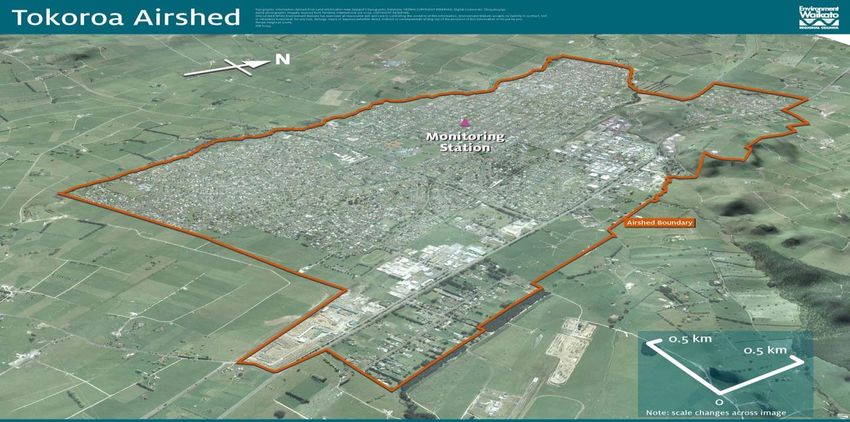
Page 4 Doc # 12332239Figure 1.2: Hamilton, Tokoroa and Taupo 1 Doc # 12332239 Page 5
Figure 1.3: Te Kuiti, Putaruru and Turangi airsheds with monitoring stations identified by pink
triangle.
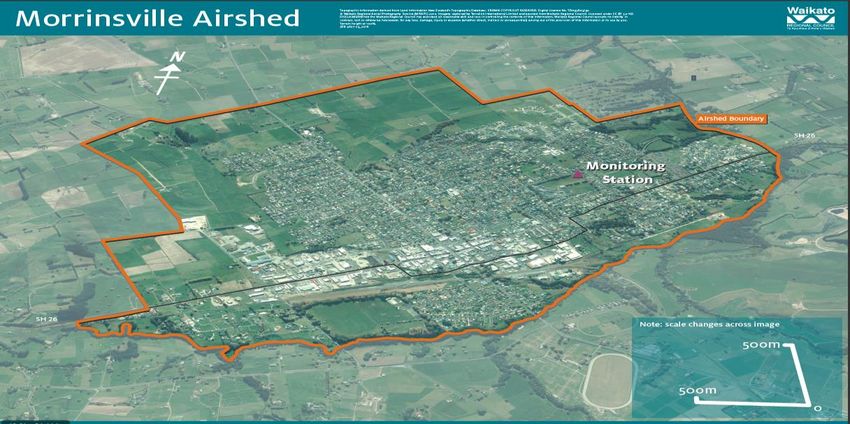
Page 6 Doc # 12332239Figure 1.4: Cambridge, Te Awamutu-Kihikihi and Morrinsville airsheds with monitoring stations
identified by pink triangle.
Doc # 12332239 Page 7Figure 1.5: Thames airshed with monitoring station identified by pink triangle. Hamilton is the Waikato region’s main urban area, with a population of 141,612. The airshed extends across both the eastern and western sides of the Waikato River. The main source of poor air quality during winter is from home heating using wood. However, traffic can also be a significant source of poor air quality especially in the vicinity of busy intersections. Hamilton currently has two active ambient PM10 monitoring stations and six localised traffic BTEX monitoring sites. The main ambient air quality monitoring station is at the Claudelands Event Centre on Heaphy Terrace on the eastern side of Hamilton. The Bloodbank station is a secondary air quality monitoring station, more influenced by localised traffic and industry sources. It is next to the NZ Blood Service at the Waikato Hospital on the corner of Ohaupo Road and Lorne Street on the western side of Hamilton. From November 1997 to October 2013, the main ambient air quality monitoring station was located on Peachgrove Road on the eastern side of Hamilton. The station was decommissioned in October 2013 because the property changed ownership. Tokoroa is located mid-way between Hamilton and Taupo on State Highway One, close to the foot of the Mamaku Ranges with a population of 12,243. The main source of poor air quality during winter is home heating using wood. Tokoroa’s one active ambient air quality and meteorological monitoring station is located at the Billah Street Reserve and was established in March 2001. In April 2015, the station was shifted (within the same site) to a new enclosure 25 metres from its previous location because of concern about potential impacts from the lime dosing process used on site by South Waikato District Council for treating drinking water at the Billah Street reservoir. Taupō, with a population of around 23,700, is the Waikato region’s second largest urban area after Hamilton. It is located within the Taupō Volcanic Zone at the northeastern end of Lake Taupō. The main source of poor air quality during winter is from home heating using wood. Because of its location within the Taupō Volcanic zone, there will be a larger contribution from volcanic/geothermal activity at times. The surrounding pumice soils are also likely to contribute to a higher summertime dust source. Taupō’s one active ambient air quality and meteorological monitoring station, located at Gillies Avenue Reserve, was established in November 2000. Te Kuiti is located approximately 78km south of Hamilton within a confined valley that is aligned along an approximately southeasterly to northwesterly direction. The town is located within the Waitomo District and has a population of 4221. The main source of poor air quality during winter is home heating using wood but there are also three significant industrial sources including a lime processing plant and two woodfired combustion plants associated with two separate sawmilling operations. Te Kuiti’s ambient air quality monitoring and meteorological station was established at the Waitomo District Council offices on Queen Street in May 2003. Putaruru is located 65 kilometres southeast of Hamilton and is close to Lake Arapuni on the Waikato River. It is situated midway between Tokoroa and Tirau on State Highway One, in the Page 8 Doc # 12332239
South Waikato District and has a population of 3777. Putaruru occupies a flat to gently undulating
site, and to the east the land rises to the Mamaku Range. The main source of poor air quality is
home heating. Putaruru’s ambient air quality monitoring station was established at the Bowling
Club on Arapuni Street, in July 2006.

Turangi, at the southern end of Lake Taupō, has a population of 2952. The main source of poor
air quality is home heating. Due to its location within the Taupo Volcanic zone, at times
volcanic/geothermal activity has been identified as contributing to PM10 concentrations. Turangi’s
ambient air quality monitoring station was established at the Turangi Fire Station on Ohuanga
Road in March 2009.

Cambridge, approximately 23km southeast of Hamilton, has a population of approximately
18,000. The airshed extends across both the eastern and western sides of the Waikato River. The
main source of poor air quality is home heating. PM10 was monitored in Cambridge at an ambient
air quality monitoring station located at Leamington Domain on Scott Street from May 2013 to
August 2016. NZTA have been monitoring NO2 at the intersection of Victoria St and Queen St since
2007.

Te Awamutu, approximately 30km south of Hamilton, has a population of 10,305. The main source
of poor air quality is likely to be home heating but there are also significant industrial emissions
associated with the Fonterra dairy factory which has milk powder driers and gas and coal fired
boilers. PM10 was monitored in Te Awamutu at an ambient air quality monitoring station located
at Albert Park on Albert Park Drive from June 2013 to October 2016. NZTA have been monitoring
NO2 at the intersection of Ohaupo Road and Albert Drive since 2010.

Morrinsville, approximately 30km northeast of Hamilton, has a population of approximately 7000.
The main source of poor air quality is home heating. Morrinsville’s ambient air quality monitoring
station was established at Morrinsville College in the vicinity of North Street in May 2015.

Thames is located at the southeastern end of the Firth of Thames on the banks of the Kauaeranga
River. Most of the urban area occupies a coastal strip of flat land at the western base of the
Coromandel Range. Thames has a population of 7,518. The main source of poor air quality is home
heating. Thame’s ambient air quality monitoring station was established at Thames High School
in the vicinity of Richmond Street in March 2016.

Doc # 12332239                                                                              Page 9
2     Methodology
2.1   PM10 & PM2.5 monitoring
      There are many different ways of measuring particle concentrations (e.g. PM 10 or PM2.5 etc.) in
      air and each method can provide varying levels of accuracy. One of the most common methods
      used by Regional Councils around New Zealand is the BAM. BAM stands for Beta Attenuation
      Monitor. This instrument type measures particle concentrations continuously. Sampled air is
      drawn through a filter which collects particles. A beam of beta radiation (electrons) is passed
      though the filter and counted on the other side of the filter by a detector. As the mass of particles
      on the filter increases the beta count is reduced and from this the mass of particles can be
      determined. This method is a US EPA equivalent method which is therefore accepted for
      compliance purposes under the NESAQ.

      All air quality monitoring stations in the Waikato region used a BAM for monitoring particulate
      concentrations in 2017.

      Refer to table 2.1 for details of monitoring station locations and instruments used for 2017. All
      stations, except Hamilton’s Bloodbank station are set up for assessing the impacts of residential
      solid fuel heating. The Bloodbank station is located 10 metres away from a busy roadway
      (Ohaupo Road) and is near to industry discharges (e.g. Waikato Hospital boilers) and is therefore
      expected to be more influenced by traffic and industry sources compared with the other
      Hamilton station at Claudelands.

      Table 2.1:       PM10 and PM2.5 monitoring stations and instruments for 2017.

           Station                       Location                     Airshed                  Instrument

       Claudelands1        Claudelands Event Centre, Heaphy        Hamilton         Thermo FH62 BAM (PM10)
                           Tce, Hamilton

       Bloodbank           Waikato Hospital, Ohaupo Road,          Hamilton         Thermo FH62 BAM (PM10)
                           Hamilton

       Billah Street       Billah St Reserve, Billah St, Tokoroa   Tokoroa          Thermo FH62 BAM (PM10) &
                                                                                    Thermo 5014i BAM (PM2.5)

       Bowling Club        Bowling Club, Arapuni St, Putaruru      Putaruru         Thermo FH62 BAM (PM10)

       Gillies Avenue      Gillies Ave Reserve, Taupo              Taupo            Thermo FH62 BAM (PM10)

       Waitomo DC          Waitomo District Council, Queen         Te Kuiti         Thermo FH62 BAM (PM10)
                           St, Te Kuiti

       Firestation         Fire Station, Ohuanga Rd, Turangi       Turangi          Thermo FH62 BAM (PM10)

       Morrinsville        Morrinsville College, North St,         Morrinsville     Thermo 5014i BAM (PM10)
       College             Morrinsville

       Thames              Thames High School, Richmond St,        Thames           Thermo 5014i BAM (PM10)
                           Thames
          1.    Note that prior to 2014, the main monitoring station in the Hamilton airshed was located 160 Peachgrove
                Road from 1997 to 2013. The Claudelands site is a replacement for this earlier “Peachgrove Rd” site.

      Page 10                                                                                          Doc # 12332239
PM10 and PM2.5 data from the BAM monitors are recorded and logged by iQuest iRIS 320
dataloggers and telemetered hourly to Waikato Regional Council and stored in the hydrotel
database. Subsequent data processing and archiving is undertaken in the WISKI database.
Over the period 2006 to 2010, several air quality monitoring stations in the Waikato region had
Thermo Sequential Partisol gravimetric samplers run in conjunction with existing BAM
instruments in order to determine the need to apply site-specific corrections to the BAM PM10
data. As a result, it was determined that site-specific corrections were required for BAM PM10
data collected at Tokoroa, Taupo and Putaruru. Monitoring data has therefore been adjusted
accordingly, at those sites. Table 2.2 provides details of the formulae used for applying the
corrections. Additional assessments using a sequential partisol have been undertaken in
Tokoroa in 2014 and 2016 and indicate that the currently applied correction factor for BAM PM10
data for Tokoroa is still valid. No corrections are applied to the PM2.5 data.
Table 2.2: Site-specific corrections applied to BAM PM10 data.
Station Correction factor
Tokoroa Corrected PM10 = 10 (1.09945logBAM - 0.08595)
Taupo Corrected PM10 = 1.255BAM – 1.538
Putaruru Corrected PM10 = 1.106BAM - 2.38
2.2 BTEX monitoring
Passive sampling for the volatile organic compounds benzene, ethyl-benzene, toluene and
xylenes (BTEX) was undertaken in Hamilton at six sites in 2017 using 3M Passive axial diffusion
samplers. Two of the six sites are located on Peachgrove Road adjacent to Countdown
supermarket and Hamilton Intermediate School. The other four sites are located at Bridge
Street/Grey Street intersection, Claudelands Road/Victoria Street intersection, Tristram Street
and Greenwood Street (refer to Figure 2.1).
Motor vehicles are the main sources of BTEX in urban areas. Pollutants such as benzene are
typically monitored using a passive sampling methodology where small plastic badges
containing activated carbon are attached to a power pole, for example, in proximity to a busy
street or intersection and are exposed for a certain period to the ambient air. The benzene is
adsorbed to the carbon over this period and can then be analysed in a laboratory at the end of
the exposure period.
Figure 2.1: Map of BTEX sites in Hamilton 1
Doc # 12332239 Page 11The method used is as described in Stevenson and Narsey (1999) with passive axial samplers
being deployed for periods of three months. The BTEX compounds are extracted from the
samplers using carbon disulphide and then analysed using Gas Chromatography Mass
Spectrometry by Hill Laboratories in Hamilton. While this type of passive sampling is
recommended as a screening method only, it is the most common approach to BTEX
monitoring in New Zealand and is significantly more cost effective than the radial passive
sampler method recommended by the Ministry for the Environment's ambient air quality
guidelines (MfE 2002).
Validation of this axial sampler method with the MfE recommended method was undertaken in
2010 by Waikato Regional Council. It was determined that the accuracy of the 3M passive axial
samplers is likely to be sufficient for monitoring purposes provided the deployment duration is
not excessive (Mathieson, 2010).
The 2017 monitoring period for BTEX covered the period 4 January to 6 December 2017. Aligning
the reporting period for BTEX with an exact calendar year is not always feasible as it would
require staff to deploy passive sampling equipment on 1 January. This misalignment with the
calendar year is not of concern when reporting annual averages as it is unlikely that there would
be any difference in the annual averages if the passive samplers were instead deployed on 1
January each year.
2.3 Nitrogen dioxide monitoring
Nitrogen dioxide (NO2) monitoring is used as a general proxy for air pollution from motor
vehicles. The NZ Transport Agency undertakes passive NO2 monitoring near to state highways
across New Zealand. The Waikato Regional Council partners with NZTA to collect additional NO2
data at selected sites in the Waikato region including Hamilton, Te Awamutu, Taupo and
Cambridge. Monitoring was undertaken in these four airsheds in 2017 for a full 12 month period.
The locations of monitoring sites are provided in Table 2.3 and Figures 2.2 to 2.3.
Table 2.3: Site locations for passive NO2 monitoring in 2017.
Airshed Location
Hamilton Cambridge Rd/Morrinsville Rd
Hamilton Bridge St/Cobham Dr
Hamilton Brooklyn Rd/Peachgrove Rd
Hamilton Victoria St/Ulster St
Hamilton Greenwood St/Killarney Rd
Hamilton Lorne St/Ohaupo Rd
Hamilton Avalon Dr/Grandview Rd
Hamilton Seamer Pl
Hamilton Te Rapa Rd/Ann Michele St
Cambridge Victoria St/Queen St
Te Awamutu Ohaupo Rd/Albert Dr
Taupo Tongariro St/Norman Smith St
Passive nitrogen dioxide samplers (similar to the BTEX samplers described above) are easy to
operate and relatively cheap, so they can be installed in large numbers (usually attached to
power poles for example) over a wide area giving good spatial coverage. The sampler tubes
contain triethanolamine which reacts with nitrogen dioxide to form nitrite ions. The tubes are
typically exposed for a one month duration and then analysed at a laboratory using UV
spectroscopy.
The results are indicative only and provide monthly rather than daily averages. Passive sampling
is therefore useful as a screening method rather than a regulatory method, for which continuous
monitors are used.2
2 Ambient air quality (nitrogen dioxide) monitoring network report 2007 – 2009, NZTA
Page 12 Doc # 12332239Figure 2.2: Map of passive NO2 monitoring sites in Hamilton. Doc # 12332239 Page 13
Figure 2.3:   Map of passive NO2 monitoring sites in Cambridge. Te Awamutu and Taupo.

2.4   Meteorological monitoring
      In 2017, meteorological data, including ambient air temperature, wind speed and wind direction
      were collected at Hamilton (Claudelands), Tokoroa, Taupo, Matamata and Te Kuiti monitoring
      stations. Relative humidity data was also collected at Hamilton (Claudelands) and Taupo. All
      meteorological data is collected at a height of six metres above ground level except for Tokoroa
      where meteorological data is collected from the top of an existing water reservoir tower at a
      height of 10 metres. Details of the meteorological instrumentation used is provided in Table 2.4.

      The meteorological data is recorded and logged by iQuest iRIS 320 dataloggers and telemetered
      hourly to Waikato Regional Council and stored in the hydrotel database. Subsequent data
      processing and archiving is undertaken in the WISKI (by Kisters) database.

      Page 14                                                                            Doc # 12332239
Table 2.4: Meteorological monitoring instrument details.
Airshed Windspeed Wind direction Air temperature Relative Height
humidity above
ground level
(m)
Tokoroa Vector A101M Vector W200P PT100 – 10
Taupo Young Young Ultrasonic Vaisala HMP45A Vaisala 6
Ultrasonic 85000 HMP45A
85000
Te Kuiti Young Young Ultrasonic Young Ultrasonic – 6
Ultrasonic 81000 81000
81000
Hamilton Young Young Ultrasonic Vaisala HMP60 Vaisala 6
Ultrasonic 85000 HMP60
85000
Matamata Vaisla WMT52 Vaisla WMT52 Vaisla WMT52 Vaisla WMT52 6
The frequency and extent of NES breaches from year to year depends largely on the prevalence
of meteorological conditions conducive to elevated pollution, in particular low wind speeds,
cooler temperatures and temperature inversions.
A graphical comparison of hourly average PM10 concentrations on days where the 24-hour
average is elevated or exceeds the standard relative to the hourly average wind direction, wind
speed and air temperature provides a means of identifying contributing meteorological
influences. This type of comparative assessment has been applied to PM10 and meteorological
data for Hamilton, Taupo, Te Kuiti and Tokoroa for 2017.
A wind rose is a diagram that shows the relative frequency and speed of winds from different
directions at a specific location. They provide a useful means of visually identifying prevailing
wind directions and windspeed frequencies. The application, WRPLOT View (Version 7.0.0) by
Lakes Environmental, has been used to generate wind roses for Hamilton, Tokoroa, Taupo and
Te Kuiti.
2.5 Trend analysis
Analysis of trends in PM10 concentrations requires an assessment of the variability from year to
year occurring because of meteorological conditions. For example, higher PM10 and more
exceedances might be expected if a winter has a greater number of days when the wind speed
is low and there is vertical stability in the lower atmosphere. Over the short term this inter-
annual variability will mask any genuine underlying trend toward better or worse air quality. A
reasonably long monitoring record is therefore needed to confirm or exclude the possibility of
any underlying trend.
Seasonal Mann-Kendall test for monotonic trends (consistently increasing or decreasing trends)
can be used for detecting underlying trends in variable environmental time-series data sets, and
may suggest presence of an underlying trend which is not evident from visual inspection of the
PM10 record or summary statistics. This method generates probability (p) values that are used
to assess the likelihood that the apparent relationship is real or a result of chance. The
conventional threshold for deciding whether a relationship is likely to be genuine is at a
probability value of p = 0.05 or lower, which corresponds to a 95% confidence level and greater.
A negative MK-Stat indicates a decreasing trend.
An updated Seasonal Mann-Kendall trend analysis was undertaken for Hamilton, Tokoroa,
Taupo, Te Kuiti and Putaruru for PM10 datasets up to and including 2017. This analysis was also
undertaken for NO2 datasets collected by NZTA for Cambridge, Hamilton, Taupo and Te
Awamutu.
Doc # 12332239 Page 153 Results
3.1 PM10 monitoring in Hamilton
The Hamilton airshed remains compliant with the NES with no exceedances of the PM10 standard
of 50 µg/m3 as a 24-hour average. The maximum 24-hour average PM10 concentration measured
was 40 µg/m3 at the Ohaupo Road (Bloodbank) site on 9 June 2017 and 30 µg/m3 at the
Claudelands site on 12 October 2017.
The 24-hour average PM10 concentrations measured at Hamilton during 2017 are shown in
Figures 3.1 and 3.2.
60
NES
concentration (g/m3)
50
24-hr average PM10
40
30
20
10
0
Figure 3.1: 24-hour average PM10 concentrations measured at Ohaupo Road during 2017.
60
NES
concentration (g/m3)
50
24-hr average PM10
40
30
20
10
0
Figure 3.2: 24-hour average PM10 concentrations measured at Claudelands during 2016.
Figure 3.3 shows year to year variability in 24-hour average PM10 concentrations relative to MfE
air quality indicator categories from 2014 to 2017 for the Claudelands site. The proportion of
24-hour average PM10 concentrations falling within the good air quality category (less than 33%
of the guideline) for 2017 at 89% indicates a small improvement compared with previous years.
Page 16 Doc # 12332239100%
80%
"Action" >Guideline
60% "Alert" 66-100% of
guideline
"Acceptable" 33-66%
40%
of guideline
"Good" 0-33% of
20% Guideline
0%
2014
2015
2016
2017
Figure 3.3: Comparison of 24-hour average PM10 concentrations measured at Claudelands in
Hamilton from 2014 to 2017 relative to air quality indicator categories.
A comparison of PM10 concentrations at the Ohaupo Rd site from 2012 to 2017 relative to the
MfE air quality indicator categories are shown in Figure 3.4. The comparison indicates that there
has been a gradual increase in the data falling within the good air quality category (less than
33% of the air quality guideline) with 84% of data falling within this category for 2017 compared
with only 74% of data in 2012 and 2014.
100%
80%
"Action" >Guideline
60%
"Alert" 66-100% of
guideline
40% "Acceptable" 33-66%
of guideline
"Good" 0-33% of
20% Guideline
0%
2017
2012
2013
2014
2015
2016
Figure 3.4: Comparison of 24-hour average PM10 concentrations measured at Ohaupo Road site in
Hamilton from 2012 to 2016 relative to air quality indicator categories.
A comparison of monthly average PM10 concentrations at Ohaupo Road and Claudelands for
2017 (Figure 3.5) indicates slightly higher overall concentrations at the Ohaupo Road site but
with a similar seasonal distribution. Interestingly, the seasonal distribution pattern indicates a
similar peak in January compared with June which suggests a summertime/ non-homeheating
impact on PM10 concentrations that needs further investigation. This summer and winter
seasonal pattern has been observed in previous years for Hamilton and is inconsistent with the
more pronounced wintertime peak observed for other airsheds in the Waikato region.
Doc # 12332239 Page 1720
18
Monthly average PM10
concentration (g/m3)
16
14
12
10
8
6
4
2
0
Claudelands Ohaupo
Figure 3.5 Comparison of monthly average PM10 concentrations measured at Claudelands and
Ohaupo Rd sites in Hamilton in 2017.
The annual average PM10 concentrations for Ohaupo Road and Claudelands for 2017 were 12.1
µg/m3 and 11.0 µg/m3 respectively which is well below the annual average guideline for PM10 of
20 µg/m3 (MfE, 2002). An annual average PM10 concentration is not specified in the NES. Refer
to Appendix 1 for a full summary of PM10 monitoring statistics for Hamilton for the period 2002
to 2017.
A windrose showing the relative frequency and speed of winds from different directions for
2017, as measured at the Claudelands station, is compared with the windrose for 2016 in Figure
3.6. The 2017 wind rose indicates a prevailing wind direction from the west and west-southwest
with a high frequency of low to moderate windspeeds which is very consistent with the windrose
pattern observed for 2016.
2016 2017
Figure 3.6: Windrose of wind direction and windspeed data as measured at Claudelands station in
Hamilton in 2016 and 2017.
A comparison of meteorological parameters with hourly average variations in PM10 on the three
days during 2017 which had the highest 24-hour average PM10 concentrations, all recorded at
the Ohaupo Road site, is provided in Figure 3.7. These days were 9 June, 27 June and 7
September (PM10 = 39.7 µg/m3, 33.4 µg/m3 and 33.1 µg/m3 respectively).
The variation in PM10 concentrations throughout the 27 June is more typical of the daily
concentration pattern (i.e. higher concentrations in the evening with a smaller peak in the
morning) observed in urban areas of New Zealand primarily because of solid fuel burning for
domestic heating (Trompetter et al., 2010). In comparison the PM10 concentration on 9 June
Page 18 Doc # 12332239peaked significantly in the morning compared with a much smaller peak in the evening. The air
temperatures and wind speeds were similar on both the 9 and 27 June with wind speeds of 2
m/s or less throughout the day and air temperatures significantly lower in the morning.
The variation in PM10 concentrations on 7 September indicates no morning peak but a large peak
in the evening and a smaller one in the afternoon. Wind speeds were much higher throughout
the day and air temperature did not drop significantly in the morning compared with the
evening.
Figure 3.7: Hourly average PM10 concentrations, wind speed, wind direction and temperature
on days when PM10 concentrations were elevated in Hamilton.
Seasonal Mann Kendall test results for monthly average PM10 concentrations for the Ohaupo
Road site for the period 2012 to 2017 indicate no statistically evident change (MK-Stat of -1.2
and p-value of 0.21). Test results for monthly average PM10 concentrations for the Claudelands
site for the period 2014 to 2017 also indicate no statistically evident change (MK-Stat of -1.1 and
p-value of 0.27).
Data suggests that Hamilton is likely to continue to meet the NES target of no more than one
exceedance per 12-month period of the 24-hour average PM10 concentration standard of 50
g/m3. However, it is possible that poor meteorological conditions i.e., a particularly cold and
calm winter could still result in more than one exceedance within a 12-month period. This would
result in Hamilton being classified as a polluted airshed.
3.2 BTEX monitoring in Hamilton
Benzene concentrations measured at all locations in Hamilton during 2017 were lower than the
Ministry for the Environment's annual average guideline of 3.6 µg/m 3 (refer to Figure 3.8). The
guideline prior to 2010 was 10 µg/m3 (annual average). The highest annual average benzene
concentration of 1.9 µg/m3 was measured at the Greenwood Street monitoring site. An
improving or “levelling” trend is evident for annual average concentrations of benzene at all
sites with the exception of Peachgrove Road which shows an increase for 2016 and 2017
compared with the previous 3 to 4 years. A new supermarket opening on this road, near to the
monitoring site location at the end of 2015 is the likely cause of the increase observed.
Doc # 12332239 Page 19Large decreases in benzene concentrations were observed over the period 2003 to 2007. These
earlier decreases were attributed to changes in fuel specifications and improved vehicle
technology (Smith, 2007).
Figure 3.8: Annual average benzene measured at Hamilton sites (2003 to 2017).
Ethyl-benzene, toluene and xylene were also measured at the BTEX monitoring sites for each
year. Results are shown in Table 3.1. An MfE document discussing amendments to the 1994
ambient air quality guidelines suggests an annual threshold of 190 μg/m3 and 950 μg/m3 for
toluene and total xylenes respectively (MfE, 2000). The United States EPA Reference
Concentration for ethyl-benzene is 1000 μg/m3 as an annual average. Concentrations of toluene,
total xylenes and ethyl-benzene measured in Hamilton at all sites were significantly lower than
the suggested MfE thresholds and USEPA Reference Concentration.
Table 3.1: Annual average concentrations of volatile organic compounds (VOCs) at Hamilton sites
for 2017.
Peachgrove Claudelands Peachgrove Tristram
Bridge St Greenwood St Guidelinea
VOC Rd Rd Intermediate St
µg/m3 µg/m3 µg/m3 µg/m3 µg/m3 µg/m3 µg/m3
Benzene 1.21 1.05 1.24 0.69 1.90 1.06 3.6
Ethyl-
0.95 0.91 1.07 0.76 2.18 0.91 1000a
benzene
Toluene 5.17 4.32 6.57 2.80 10.61 5.68 190a
Total
4.34 3.77 4.57 2.60 6.83 3.92 950a
Xylenes
a There are currently no guideline values for ethyl-benzene, toluene and xylenes. Threshold values for toluene and
total xylenes used here are from proposed amendments to the 1994 ambient air quality guidelines. For ethyl-benzene,
the US EPA Reference Concentration has been used.
3.3 NO2 monitoring in Hamilton
The results from NZTA’s passive NO2 monitoring programme for 2017 (Figure 3.9) indicate that
the Lorne Street/Ohaupo Road site and Greenwood Road/Killarney Road site in Hamilton have
some of the highest readings in New Zealand. Both sites have exceeded the World Health
Organisation (WHO) annual guideline of 40 g/m3 for NO2. Seasonal Mann Kendall test results
for monthly average NO2 concentrations for the Hamilton sites for the period 2011 to 2017
indicate no statistically evident change.
Page 20 Doc # 12332239Figure 3.9: Annual average NO2 measured at Hamilton sites (2007 to 2017).
3.4 PM10 and PM2.5 monitoring in Tokoroa
Concentrations of PM10 in Tokoroa exceeded the PM10 standard of 50 µg/m3 as a 24-hour average
on ten occasions during 2017 (Table 3.2). The maximum 24-hour average PM10 concentration
measured was 75 µg/m3 on 16 June 2017 and is higher than the maximum 24-hour average
concentration of 60 µg/m3 recorded in 2016.
Table 3.2: Dates and concentrations for exceedences of the PM10 standard of 50 µg/m3 as a 24-
hour average in Tokoroa during 2017.
Date PM10 µg/m3 Rank
26 June 51 µg/m3 1
16 July 51 µg/m3 2
7 June 52 µg/m3 3
11 July 54 µg/m3 4
31 July 56 µg/m3 5
30 July 57 µg/m3 6
27 June 58 µg/m3 7
8 June 59 µg/m3 8
9 June 63 µg/m3 9
16 June 75 µg/m3 10
During 2017 PM2.5 concentrations in Tokoroa exceeded the World Health Organisation (WHO)
guideline of 25 µg/m3 (24-hour average) on 53 occasions. The maximum 24 hour average PM2.5
concentration of 65 µg/m3 was measured on 30 July 2017 which is similar to the maximum of 66
µg/m3 recorded for PM2.5 in 2016.
Daily PM10 and PM2.5 concentrations measured at Tokoroa during 2017 are shown in Figures 3.10
and 3.11. Highest PM10 and PM2.5 concentrations were measured during the winter months when
emissions from solid fuel burning coincides with meteorological conditions conducive to elevated
concentrations.
Doc # 12332239 Page 21Figure 3.10: 24 hour average PM10 concentrations measured in Tokoroa during 2017.
Figure 3.11: 24 hour average PM2.5 concentrations measured in Tokoroa during 2017.
Figure 3.12 shows the relationship between PM10 and PM2.5 concentrations for Tokoroa for winter
2017. A good correlation between PM2.5 and PM10 is observed (r2=0.85) for 2017 as was observed
for 2015 and 2016. The slope is also less than one compared with that observed for 2016 indicating
that generally PM2.5 concentrations were less than PM10. This is more consistent with the
expectation that as PM2.5 is a subset of PM10 the PM2.5 concentration should typically be lower.
Despite this there were some days where PM2.5 was higher than PM10 which is likely due to small
discrepancies that can occur when different instruments are being used to monitor the different
particulate size fractions3.
3 A particulate monitoring instrument with a PM10 sampling head will collect particles 10 microns in size and smaller including
particles 2.5 microns in size and smaller whereas an instrument with a PM 2.5 sampling head will only collect particles 2.5 microns
in size and smaller. The BAM FH62 used for PM10 has relative humidity control on the sampler inlet compared to the BAM 5014i
used for PM2.5 at Tokoroa which has temperature control on the sampler inlet.
Page 22 Doc # 12332239Figure 3.12: Relationship between 24 hour average PM10 and PM2.5 concentrations measured in
Tokoroa for winter 2017.
Tokoroa PM10 concentrations from 2006 to 2017 are presented relative to air quality indicator
categories in Figure 3.13. The proportion of concentrations within the “action” category was
higher in 2017 at 3% compared to 2016 at 1.5% but is consistent with the typical range observed
for previous years of 3% to 6%.
Figure 3.13: Comparison of 24 hour average PM10 concentrations measured in Tokoroa from 2006 to
2017 to air quality indicator categories.
The proportion of 24 hour average PM2.5 concentrations within the “action” category for 2017
was 18% which is consistent with the 18% proportion of PM2.5 concentrations determined for
2016.
A comparison of monthly average PM10 concentrations for 2017 (Figure 3.14) shows a distinct
seasonal pattern with a wintertime peak indicative of home heating impacts consistent with
seasonal patterns observed for other airsheds in the Waikato region apart from Hamilton.
Doc # 12332239 Page 2335
30
concentration (mg/m3)
Monthly average PM10
25
20
15
10
5
0
Figure 3.14: Monthly average PM10 concentrations measured in Tokoroa in 2017.
The number of days when the PM10 standard of 50 µg/m3 as a 24 hour average was exceeded,
the maximum 24 hour average concentration and the 2nd highest 24 hour average concentration
over the period 2006 to 2017 is shown in Figure 3.15. The NES compliance targets for Tokoroa
are no more than three exceedances after 1 September 2016 and no more than one exceedance
after 1 September 2020. It is unlikely that either target would be met in the absence of additional
air quality management measures.
30 100
90
24 hour average PM10 (g/m3)
25
80
Number exceedances
70
20
60
15 50
40
10
30
20
5
10
0 0
Number exceedances Maximum concentration 2nd highest concentration
Figure 3.15: Number of days (left axis) when the PM10 standard of 50 µg/m3 as a 24 hour average was
exceeded compared with the maximum 24 hour average concentration and the 2 nd
highest 24 hour average concentration (right axis) measured from 2006 to 2017.
The annual average PM10 concentration for Tokoroa for 2017 was 15.4 µg/m3 which is towards
the lower end of the range of annual average concentrations recorded at the site since 2006
(range 14.5 to 18.8 µg/m3). The Ministry for the Environment specifies an annual average
guideline for PM10 of 20 µg/m3 (MfE, 2002). The annual average PM2.5 concentration for Tokoroa
for 2017 was 14.7 µg/m3. This is higher than the WHO guideline for annual average PM2.5 of 10
µg/m3. Refer to Appendix 2 for a full summary of PM10 monitoring statistics for Tokoroa for the
period 2006 to 2017 and PM2.5 monitoring statistics for the period 2015 to 2017.
A windrose showing the relative frequency and speed of winds from different directions for
2017, as measured at the Tokoroa station, is compared with the windrose for 2016 in Figure
3.16. The 2017 wind rose indicates two distinct prevailing wind directions, one from the west-
northwest and another from the southeast with a high frequency of low to moderate
Page 24 Doc # 12332239You can also read