Surveillance of influenza and other respiratory viruses in the UK Winter 2019 to 2020 - Gov.uk
←
→
Page content transcription
If your browser does not render page correctly, please read the page content below
Surveillance of influenza and other respiratory viruses in the UK Winter 2019 to 2020
Surveillance of influenza and other respiratory viruses in the UK: Winter 2019 to 2020

About Public Health England
Public Health England exists to protect and improve the nation’s health and wellbeing,
and reduce health inequalities. We do this through world-leading science, research,
knowledge and intelligence, advocacy, partnerships and the delivery of specialist public
health services. We are an executive agency of the Department of Health and Social
Care, and a distinct delivery organisation with operational autonomy. We provide
government, local government, the NHS, Parliament, industry and the public with
evidence-based professional, scientific and delivery expertise and support.

Public Health England
Wellington House
133-155 Waterloo Road
London SE1 8UG
Tel: 020 7654 8000
www.gov.uk/phe
Twitter: @PHE_uk
Facebook: www.facebook.com/PublicHealthEngland

Prepared by: Influenza Surveillance Section, Immunisation and Countermeasures
Division, National Infection Service, PHE
For queries relating to this document, please contact: respscidsc@phe.gov.uk

© Crown copyright 2020
You may re-use this information (excluding logos) free of charge in any format or
medium, under the terms of the Open Government Licence v3.0. To view this licence,
visit OGL. Where we have identified any third party copyright information you will need
to obtain permission from the copyright holders concerned.

Published June 2020
PHE publications                                         PHE supports the UN
gateway number: GW-1328                                  Sustainable Development Goals

                                                        15
Surveillance of influenza and other respiratory viruses in the UK: Winter 2019 to 2020
Contents
Glossary 4
Executive summary 5
Background 7
Community surveillance 9
Primary care consultations 22
Secondary care surveillance 28
Microbiological surveillance 39
Mortality Surveillance 51
Vaccination 55
Emerging respiratory viruses 64
Conclusions 67
Acknowledgments 69
3Surveillance of influenza and other respiratory viruses in the UK: Winter 2019 to 2020
Glossary
ARI Acute respiratory infections
COVID-19 Coronavirus Disease 2019
ECDC European Centre for Disease Control
ECMO ExtraCorporeal Membrane Oxygenation
ECOSS Electronic Communication of Surveillance in Scotland
ED Emergency department
EDSSS Emergency Department Syndromic Surveillance System
GP General Practitioner
GPIH GP in hours
GPOOH GP out-of-hours
HA Haemagglutinin
HDU High Dependency Unit
HI Haemagglutination inhibition
hMPV Human metopneumovirus
HPS Health Protection Scotland
ICU Intensive Care Unit
ILI Influenza-like illness
LA Local Authority
LAIV Live attenuated influenza Vaccine
MEM Moving Epidemic Method
MERS-CoV Middle East Syndrome coronavirus
MOSA Medical Officers of Schools Association
NI Neuraminidase inhibitor
NIS National Infection Service
ONS Office for National Statistics
PCR Polymerase chain reaction
PHA Public Health Agency of Northern Ireland
PHE Public Health England
POCT Point of care testing
QIVc Cell-based quadrivalent influenza vaccine
QIVe Egg-based quadrivalent influenza vaccine
RCGP Royal College of General Practitioners
RSV Respiratory Syncytial Virus
RVU Respiratory Virus Unit
SARS-CoV-2 Severe acute respiratory syndrome coronavirus 2
SMN Specialist Microbiology Network
SRF Severe Respiratory Failure
TIV-HD High-dose trivalent influenza vaccine
UCL University College London
USISS UK Severe Influenza Surveillance Systems
WHO World Health Organization
4Surveillance of influenza and other respiratory viruses in the UK: Winter 2019 to 2020
Executive summary
In the 2019 to 2020 season, low levels of influenza activity were observed in the
community with circulation of influenza A(H3N2) dominating the season. Activity started
to increase from week 47, 2019, with the length and peak of activity in general practice
varying across the UK, reaching low levels in England, and medium levels in Scotland,
Northern Ireland and Wales.
Influenza transmission resulted in medium impact through secondary care indicators
(hospitalisations and ICU/HDU admissions). Peak admission rates of influenza to
hospital and ICU/HDU were similar or lower than seen in the 2018 to 2019 and 2017 to
2018 seasons but higher than all other seasons since 2010 to 2011.
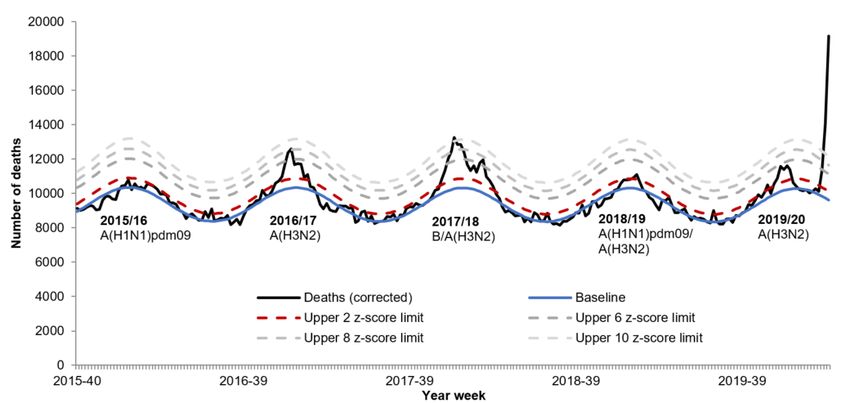
Excess all-cause mortality was seen during the influenza season in England, Scotland,
Wales and Northern Ireland before the circulation of Severe Acute Respiratory Syndrome
coronavirus- 2 (SARS-CoV-2) in the UK. From week 12, 2020 levels of excess all-cause
mortality were the highest seen in England since excess all-cause mortality began
reporting, which coincides with the Coronavirus Disease 2019 (COVID-19) pandemic.
The UK, as with many Northern Hemisphere countries, found that the majority of
circulating influenza A(H1N1)pdm09 and A(H3N2) strains that were characterised were
genetically and antigenically similar to the Northern Hemisphere 2019 to 2020
A(H1N1)pdm09 and A(H3N2) vaccine virus strains.
Vaccine uptake in England varied by cohort. For the following cohorts, the vaccine
uptake in England in the 2019 to 2020 season was higher than the 2018 to 2019 season:
• those aged 65+ (72.4% compared to 72.0% in 2018 to 2019)
• health care workers (74.3% compared to 70.3% in 2018 to 2019)
For the following cohorts, the vaccine uptake in England in the 2019 to 2020 season was lower
than the 2018 to 2019 season:
• those aged 6 months to under 65 years of age with 1 or more underlying clinical risk
factors (44.9% compared to 48.0% in 2018 to 2019)
• pregnant women (43.7% compared to 45.2% in 2018 to 2019)
In 2019 to 2020, the universal childhood influenza vaccine programme with live
attenuated influenza vaccine (LAIV) was again offered to pre-school children aged 2
and 3 years across the UK, plus 4 year olds in Scotland and Northern Ireland. LAIV
was offered to all primary school age children across the UK. This was the first year
that LAIV was offered to children in Year 6 in England. Vaccine uptake varied across
the UK.
5Surveillance of influenza and other respiratory viruses in the UK: Winter 2019 to 2020
In England:
• uptake in 2 and 3 year olds was 43.8%, compared to 44.9% in the previous season
• uptake in primary school age children uptake was 60.4% for all year groups
(Reception to Year 6) – this is compared to an uptake of 60.8% in the previous
season (Reception to Year 5)
• uptake in each school year group was the same or higher than in the previous
season
In Scotland:
• uptake in the 2 toSurveillance of influenza and other respiratory viruses in the UK: Winter 2019 to 2020
Background
Surveillance of influenza and other respiratory viruses in the United Kingdom (UK) is
undertaken throughout the year and collated on behalf of the countries of the UK by the
Influenza Surveillance Team at Public Health England’s National Infection Service
(PHE NIS). This is in collaboration with teams within PHE, Health Protection Scotland1,
Public Health Wales2 and the Northern Ireland Public Health Agency3, who are each
responsible for monitoring influenza surveillance for their respective countries. Weekly
outputs are normally published during the winter season between October (week 40)
and May (week 20) the period when influenza typically circulates4. In the 2019 to 2020
season, reports were published weekly between week 40, 2019 and week 9 2020 and
fortnightly thereafter. A variety of data sources are collated to provide information on
circulating influenza strains (including antigenic and genetic characterisation) and
antiviral resistance and the timing of influenza activity and to provide rapid estimates of
influenza-related burden within the community, on the health service and in excess all-
cause mortality. In addition, in-season and end-of-season monitoring of seasonal
influenza vaccine uptake and vaccine effectiveness is undertaken.
Background information on the data sources covered in this report has been previously
described5. The Moving Epidemic Method (MEM)6 is used by the European Centre for
Disease Prevention and Control (ECDC) to standardise reporting of influenza activity
across Europe. It has been adopted by the UK and is publicly presented for GP
influenza-like illness (ILI) consultation rates for each UK scheme, for the proportion of
samples positive for influenza through the respiratory DataMart scheme and for the
hospitalisation and intensive care unit (ICU) admissions rate in the UK Severe
Influenza Surveillance System (USISS) sentinel and mandatory schemes.
During the 2019 to 2020 season, the roll-out of the licensed live attenuated influenza
vaccine (LAIV) has continued and has been completed for children of primary school
age across the UK. In England, LAIV was offered to all 2 and 3 year olds through
primary care and to children of school age Reception, Year 1, Year 2, Year 3, Year 4,
Year 5 and Year 6 (4 to 10 rising to 11 year olds) through schools this year. This is the
first influenza season in England where Year 6 have been offered vaccination through
1 Health Protection Scotland. www.hps.scot.nhs.uk/a-to-z-of-topics/influenza/
2 Public Health Wales. www.wales.nhs.uk/sites3/page.cfm?orgid=457&pid=34338
3 Public Health Northern Ireland. www.publichealth.hscni.net/directorate-public-health/health-protection/influenza
4 Public Health England (PHE). www.gov.uk/government/collections/seasonal-influenza-guidance-data-and-analysis
5 Health Protection Agency. Surveillance of influenza and other respiratory viruses in the UK: 2011-2012 report. Available
from:
http://webarchive.nationalarchives.gov.uk/20140714084352/http://www.hpa.org.uk/webc/HPAwebFile/HPAweb_C/1317134705
939
6 Vega T, et al. Influenza surveillance in Europe: establishing epidemic thresholds by the Moving Epidemic Method. Influenza
and Other Respiratory Viruses 2012. doi: 10.1111/j.1750-2659.2012.00422.x.
7Surveillance of influenza and other respiratory viruses in the UK: Winter 2019 to 2020 the schools’ programme, meaning that from the 2019 to 2020 season all children of primary school age are eligible. Additional influenza vaccination activity for children was also carried out with strategies varying by country of the UK. In England and Wales, 2 and 3 year olds were offered in primary care and in Scotland and Northern Ireland, vaccination was offered to 2 to
Surveillance of influenza and other respiratory viruses in the UK: Winter 2019 to 2020

Community surveillance
Syndromic surveillance

In England, national PHE real-time syndromic surveillance systems, including GP in
hours (GPIH) consultations and out-of-hours (GPOOH) contacts, emergency
department attendances (Emergency Department Syndromic Surveillance System
(EDSSS)) and NHS 111 calls9, monitor a range of indicators sensitive to community
influenza activity, for example NHS 111 ‘cold’/flu calls and GP in-hours consultations for
influenza-like illness (ILI).

Trends observed after week 10, 2020 through syndromic surveillance systems should
be interpreted with caution due to the impact of the COVID-19 pandemic.

COVID-19 caused an increase in the use of ILI codes and other similar codes, particularly
in the early stages of circulation in England. This caused a rapid increase in activity in
many of the syndromic respiratory indicators, followed by a rapid decrease in rates in
some systems as COVID-19 specific codes were introduced into health care IT systems
and changes were made to the way potential COVID-19 patients were managed.

During winter 2019 to 2020, syndromic surveillance indicators for GPIH ILI
consultations peaked in week 1, 2020 at 16.8 per 100,000 population. Similarly,
GPOOH ILI contacts also peaked in week 1, 2020 at 0.82% of all consultations.
GPOOH ILI contacts rapidly increased from week 10, 2020, with this increase likely due
to potential COVID-19 consultations being coded as ILI.

Syndromic surveillance indicators for GPIH pneumonia consultation rates peaked at 3.1
per 100,000 in week 1, 2020, which was similar to a peak of 2.8 per 100,000 in week 1,
2019 in the previous season.

Syndromic indicators for GPOOH acute respiratory infections (ARI) contacts peaked in
week 52, 2019 at 24.5% of consultations, this was similar to the peaks noted in the
previous season of 21.9% of consultations in week 52 2018. GPOOH ARI contacts saw
a second peak in week 11, 2020 which is likely due to COVID-19 activity (Figure 1).

9   Real Time Syndromic Surveillance, PHE www.gov.uk/government/collections/syndromic-surveillance-systems-and-
analyses

                                                          9
Surveillance of influenza and other respiratory viruses in the UK: Winter 2019 to 2020
Figure 1. Weekly all age (a) GP in hours consultations for influenza-like illness (ILI) (b)
GP in hours consultations for pneumonia (c) GP out of hours (OOH) contacts for ILI (d)
GP out of hours contacts for acute respiratory infections (ARI) for winter 2016 to 2020,
England
45.0 2016/17
GP in hours ILI consultation rate per
40.0 2017/18
35.0 2018/19
2019/20
30.0
100,000
25.0
20.0
15.0
10.0
5.0
0.0
40 42 44 46 48 50 52 2 4 6 8 10 12 14
Week number
4.5 2016/17
4.0 2017/18
GP in hours pneumonia consultation rate
2018/19
3.5
2019/20
3.0
2.5
per 100,000
2.0
1.5
1.0
0.5
0.0
40 42 44 46 48 50 52 2 4 6 8 10 12 14
Week number
10Surveillance of influenza and other respiratory viruses in the UK: Winter 2019 to 2020
4.0
2016/17
3.5
GPOOH ILI contacts (% total contacts
2017/18
3.0
2018/19
2.5 2019/20
with a diagnosis)
2.0
1.5
1.0
0.5
0.0
40 42 44 46 48 50 52 2 4 6 8 10 12 14
Week number
35
2016/17
GPOOH ARI contacts (% total contacts
30 2017/18
2018/19
25
with a diagnosis)
2019/20
20
15
10
5
0
40 42 44 46 48 50 52 2 4 6 8 10 12 14
Week number
ARI emergency department (ED) attendances saw a peak during week 52, 2019 at 15.6% of
all ED attendances, which is similar to the peak seen in the previous season of 14.0% in
week 52 2018. ED attendances for pneumonia saw a peak in week 1, 2020 at 1.29% of total
ED attendances, which is similar to the peak of 1.21% in week 1 2018 in the 2018 to 2019
season. ARI and pneumonia as a percentage of total ED attendances both began to rise
again in week 11, 2020, however although there was a rise in the total number of ED
attendances for ARI there was not for the numbers of pneumonia attendances. This rise in
the percentage ARI and pneumonia attendances was largely due to fewer people attending
ED during the COVID-19 pandemic, and therefore the denominator used to calculate
ARI/pneumonia percentage was smaller resulting in an increase in percentage, rather than a
large increase in the number of people attending with ARI or pneumonia. (Figure 2).
11Surveillance of influenza and other respiratory viruses in the UK: Winter 2019 to 2020
Figure 2. Weekly all age (a) Emergency Department Syndromic Surveillance System
(EDSSS) acute respiratory infection (ARI) attendances (b) EDSSS pneumonia
attendances for winter 2018 to 2020
EDSSS ARI attendances (% of attendances with a
20000 20.00
EDSSS ARI attendances 2019/20
18000 18.00
% 2018/19
16000 % 2019/20 16.00
EDSSS ARI attendances
14000 14.00
12000 12.00
10000 10.00
8000 8.00
diagnosis code)
6000 6.00
4000 4.00
2000 2.00
0 0.00
40 42 44 46 48 50 52 2 4 6 8 10 12 14
Week number
1600 EDSSS pneumonia attendances 2019/20 2.00
1400 % 2018/19 1.80
EDSSS pneumonia attendances (% of
1.60
attendances with a diagnosis code)
% 2019/20
EDSSS pneumonia attendances
1200
1.40
1000 1.20
800 1.00
600 0.80
0.60
400
0.40
200 0.20
0 0.00
40 42 44 46 48 50 52 2 4 6 8 10 12 14
Week number
NHS 111 ‘cold/flu’ calls saw an early peak in week 52, 2019 accounting for 1.5% of
total calls. NHS 111 calls attributed to cold/flu began to increase again from week 3,
2020, peaking at 5.3% of calls in week 11, 2020, followed by a large decrease in week
12, 2020. This second peak is likely due to potential COVID-19 calls initially being
12Surveillance of influenza and other respiratory viruses in the UK: Winter 2019 to 2020
triaged using the pre-existing cold/flu clinical NHS 111 pathway, before new triaging
pathways for managing potential COVID-19 calls were introduced thereby reducing the
number of cold/flu calls received (Figure 3).
Figure 3. Weekly all age England NHS 111 cold/flu calls for winter 2016 to 2020
In Scotland, the weekly proportion of all calls to NHS 24 which mention cold/flu, was
low throughout the season and peaked during week 11, 2020 at 1.3%. This late peak is
likely to coincide with COVID-19 calls being recorded as cold/flu calls. The proportion of
cold/flu calls was lower than seen in the previous 2 seasons (Figure 4).
Figure 4. Proportion of calls for cold/flu (all ages) through NHS 24, Scotland, 2017 to
2020
13Surveillance of influenza and other respiratory viruses in the UK: Winter 2019 to 2020
In Wales, the weekly proportion of all cold/flu calls made to NHS Direct Wales saw an
early peak in week 50, 2019. The weekly proportion of cold/flu calls began to rise from
week 3, 2020, reaching a peak in week 10, 2020. This later peak is similar to that seen
in NHS 111 in England and NHS 24 in Scotland, and is likely caused by COVID-19
related calls (Figure 5).
Figure 5. Weekly proportions of calls for cold/flu (all ages) to NHS-Direct, Wales,
2016 to 2020
Outbreak reporting
Between week 40, 2019 and week 14, 2020, a total of 3,936 ARI outbreaks in closed
settings were reported in the UK. This is a large increase compared to outbreaks
occurring in the previous 3 seasons, where the highest had been 2,149 in 2017 to 2018
(Table 1).
Of all outbreaks, 2,751 (69.9%) occurred in care homes, 257 (6.5%) in hospitals, 656
(16.7%) in schools, 126 (3.2%) in prisons and 146 (3.7%) in other settings. This
increase is largely attributed to SARS-CoV-2 outbreaks.
An early peak in the number of outbreaks was seen in week 48 2019 with 193 outbreaks.
School outbreaks accounted for the majority of outbreaks between weeks 47 and 52
2019 (58.9%). The number of reported outbreaks began to rise again in week 11, 2020,
reaching 1,057 outbreaks reported in week 14, 2020. This rise in reported outbreaks late
in the season coincides with an increase of SARS-CoV-2 related outbreaks.
Table 1. Number and percentage of UK outbreaks by institution type, 2016 to 2020
14Surveillance of influenza and other respiratory viruses in the UK: Winter 2019 to 2020
Outbreaks
2019/2020 2018/2019 2017/2018 2016/2017
Total 3,936 1,432 2,149 1,114
Institution type
Care homes 2,751 1,013 1,700 875
Hospitals 257 206 230 162
Schools 656 162 160 61
Prisons 126 - - -
Other 146 51 59 16
* Date for 2018 to 2019, 2017 to 2018 and 2016 to 2017 is basec on week 40 to week 20
* Outbreaks in prisons were counted in other setting for 2018 to 2019, 2017 to 2018 and 2016 to 2017
Where information on virological testing were available, the majority of outbreaks were
confirmed as SARS-CoV-2 (1490/2134; 69.8%). There were 19 outbreaks confirmed
to be associated with influenza A(H1N1)pdm09 and 25 outbreaks with influenza
A(H3N2). 388 outbreaks were confirmed to be associated with influenza A(not
subtyped). Twelve outbreaks were associated with influenza B. There were 192
outbreaks confirmed to be associated with a range of other non-influenza viruses
including respiratory syncytial virus (RSV), rhinovirus, human metapneumovirus
(hMPV), seasonal coronavirus and parainfluenza. Eight outbreaks were associated
with multiple respiratory viruses (Figure 6).
15Surveillance of influenza and other respiratory viruses in the UK: Winter 2019 to 2020
Figure 6. Weekly number of outbreaks by (a) institution type and (b) virological test
results where available by week of reporting, 2019 to 2020 UK
a)
1200
Care home
Hospital
1000
School
Number of outbreaks
Prison
800
Other
600
400
200
0
40 42 44 46 48 50 52 02 04 06 08 10 12 14
Week number
b)
800
Flu A(H1N1)pdm09 Flu A(H3N2)
700 Flu A(not subtyped) Flu B
SARS-CoV-2 Other
600 Multiple pathogens
Number of outbreaks
500
400
300
200
100
0
40 42 44 46 48 50 52 02 04 06 08 10 12 14
Week number
16Surveillance of influenza and other respiratory viruses in the UK: Winter 2019 to 2020
In England, a total number of 3,524 ARI outbreaks were reported to PHE between week
40, 2019 and week 14, 2020 compared to 1,300 in the 2018 to 2019 season (week 40 to
week 20). The majority of outbreaks were from care home settings (68.5%). School
outbreaks accounted for 17.9% of all outbreaks. Hospital outbreaks accounted for 6.6%
of outbreaks. Prison outbreaks accounted for 3.3% of outbreaks. Outbreaks in other
settings accounted for 3.7% of outbreaks. Regionally, the highest number of outbreaks
occurred in the South East region (17.2%) followed by the North West region (15.6%).
In Scotland, the number of ARI outbreaks reported to Health Protection Scotland (HPS)
between week 40, 2019 and week 14, 2020 was 192, which is higher than previous seasons
(48 in 2018 to 2019, 132 in 2017 to 2018 and 78 in 2016 to 2017). The majority of these
outbreaks were reported from care homes (78.6%), followed by schools (9.4%), hospitals
(8.9%), prisons (2.1%) and other setting (1.0%). Of the 192 outbreaks reported, 28 were
confirmed to be associated with influenza. From those 21 were influenza A(not subtyped), 4
were influenza A(H3N2), 2 were influenza B and 1 was influenza A(H1N1)pdm09. 10 of the
outbreak were associated with other seasonal respiratory viruses or tested positive for mixed
respiratory pathogens. 50 outbreaks tested positive for SARS-CoV-2, with a further 76
reported as suspected SARS-CoV-2 without a virological test result.
In Wales, there were 167 outbreaks of ARI reported to the Public Health Wales Health
Protection teams between week 40, 2019 and week 14, 2020, compared to 62 between
week 40 and week 15 during the 2018 to 2019 season. The majority were reported
from care homes (83.8%), followed by other setting (6.6%), school and nursery settings
(4.2%), prisons (3.0%) and hospitals (2.4%). Virological results were available for 110
confirmed respiratory outbreaks, of which 8 were influenza A(H3N2), 1 was influenza
A(H1N1)pdm09, 1 was influenza A(not subtyped) and 100 were SARS-CoV-2.
In Northern Ireland, there were a total of 53 ARI outbreaks reported to the Public Health
Agency between week 40, 2019 and week 14, 2020, compared to a total of 19 ARI
outbreaks in the 2018 to 19 season and 58 ARI outbreaks in the 2017 to 2018 season. 47
(88.7%) outbreaks were reported from care homes, 4 (7.5%) from hospitals, and 2 (3.8%)
from other setting. Virological results were available for 19 confirmed respiratory outbreaks
of which 9 were influenza A(not subtyped), 1 was influenza B and 9 were SARS-CoV-2.
Medical Officers of Schools Association (MOSA) and PHE scheme
The Medical Officers of Schools Association (MOSA) was founded in 1884 and involves
a network of more than 200 predominantly private and boarding schools around the
United Kingdom10,11.
10 MOSA-PHE scheme. www.gov.uk/guidance/sources-of-uk-flu-data-influenza-surveillance-in-the-uk#clinical-surveillance-
through-primary-care
11 MOSA website. www.mosa.org.uk/
17Surveillance of influenza and other respiratory viruses in the UK: Winter 2019 to 2020
Following the re-introduction of influenza A(H1N1) in 1978, which spread widely
amongst children and younger people, PHE and the Medical Officers of Schools
Association (MOSA) developed a surveillance scheme to monitor respiratory illness in
children attending MOSA schools in England. Since September 1983, the scheme has
formed part of the routine surveillance activities of PHE.
Participating MOSA schools complete a general annual online survey, including
questions on influenza vaccine policies for students; weekly surveys reporting how
many boarders developed ILI as well as other respiratory related illnesses and a
vaccine uptake survey by school year.
In 2019 to 2020, 17 MOSA schools agreed to participate in the scheme. Participating
schools included a total of 3,182 boarders, with 97.7% of boarders from secondary
schools. Figure 7 represents the weekly ILI rates observed through the scheme this
season. ILI rates peaked in week 50, 2019 at 3.5 per 1,000 boarders.
Data for this scheme is only reported up to week 11, 2020, due to the government
recommendations of school closures12 due to the COVID-19 pandemic.
Figure 7. Weekly ILI rates per 1,000 boarders observed through participating
MOSA schools in England, 2019 to 2020
12 https://www.gov.uk/government/publications/covid-19-school-closures/guidance-for-schools-about-temporarily-
closing
18Surveillance of influenza and other respiratory viruses in the UK: Winter 2019 to 2020
Flusurvey (internet based surveillance)
Flusurvey is part of a European wide initiative (including 10 European countries) run by
Public Health England, providing internet-based surveillance of ILI in the UK population.
On registration, individuals aged 18+ complete a baseline questionnaire which collects
information on demographic, geographic, socioeconomic (household size and
composition, occupation, education, and transportation), and health (vaccination, diet,
pregnancy, smoking, and underlying medical conditions) data. Subsequently,
participants are sent weekly reminders via email to report any symptoms relating to flu
that they may have experienced and their health-seeking behaviour as a result of their
symptoms. This creates a fast, reliable and flexible real-time monitoring surveillance
system. Participants were recruited during the first 6 weeks of the survey period initiated
once influenza activity has been established in the community (week 46 to week 52).
A total of 1,927 participants were recruited of which an average of 1,791 (92.9%)
completed at least 1 survey contributing over 41,200 real-time flu related symptoms data.
Characteristics of registered participants varied by age and gender. There were more
participants in the 45 to 64 years age group (40.2%) compared to other age groups. There
was a higher proportion of female participants compared to male participants (64.8% vs
35.2%). The majority (1,714; 89.4%) of participants were resident in England; 122 participants
were from Scotland; 13 participants were from Northern Ireland and 67 from Wales.
Based only on participants who completed 3 or more weekly symptom surveys and
using the European Centre for Disease Control (ECDC) ILI case definition of sudden
onset of symptoms and at least 1 of; fever, malaise, headache or muscle pain and at
least 1 of; cough, sore throat, shortness of breath, the overall number of self-reported
ILI cases was 1,049 (2.5%). Self-reported ILI trends showed 3 peaks at week 52, week
1 and week 12 (Figure 8). Further analysis and report of the 2019 to 2020 flu survey will
be available on the website in the summer (www.flusurvey.net).
Figure 8. Weekly ILI incidence per 1,000 by age group reported through
Flusurvey, 2019 to 2020 UK
19Surveillance of influenza and other respiratory viruses in the UK: Winter 2019 to 2020
Google influenza like illness (ILI) searches (internet-based surveillance)
PHE have been collaborating with University College London (UCL) to assess the use
of internet based search queries as a surveillance method for ILI, throughout England.
This is part of work on early-warning surveillance systems for influenza, through the
Engineering and Physical Sciences Research Council (EPSRC) Interdisciplinary
Research Collaboration (IRC) project i-sense13.
Combining natural language processing and machine learning techniques, a non-linear
Gaussian process model was developed by UCL14,15 to produce real time estimates of
ILI. The supervised model, trained on historical data from the Royal College of General
Practitioners (RCGP) scheme16 (2005 to 2006 to 2016 to 2017 seasons at national
level), produces daily ILI estimates based on the proportion of ILI related search
queries within a 10% to 15% sample of all queries issued, which was extracted daily
from Google’s Health Trends Application Programming Interface.
Estimated rates of ILI started to increase in week 47, 2019, before peaking during week
52, 2019, which was a week after than that seen through the RCGP ILI consultation
data which peaked in week 51, 2019. The ILI rate also increased later in the season
with peaks seen in weeks 06 and 11 2020. These peaks are likely due to COVID-19,
and associated media interest, rather than influenza. ILI rates did not reach the peak
seen in the 2010 to 2011 season when the influenza A(H1N1)pdm09 pandemic was
taking place (Figure 9).
Due to the nature of daily data and its fluctuations in estimating rates based on
searches, a 3-day moving average was applied to visualise the underlying trend.
13 i.sense website. www.i-sense.org.uk/
14 Lampos V et al. Enhancing feature selection using word embeddings: the case of flu surveillance. Proceedings of the 26 th
International Conference on the World Wide Web, April 03-07, 2017, Perth Australia.
15 Lampos V et al. Advances in nowcasting influenza-like illness rates using search query logs. Scientific Reports. 2015 3;5.
doi:10.1038/srep12760
16 Royal College of General Practitioners Research and Surveillance Centre: www.rcgp.org.uk/clinical-and-research/our-
programmes/research-and-surveillance-centre.aspx
20Surveillance of influenza and other respiratory viruses in the UK: Winter 2019 to 2020
Figure 9. Daily estimated ILI Google search query rates (and 3-day moving average) per
100,000 population, 2019 to 2020
21Surveillance of influenza and other respiratory viruses in the UK: Winter 2019 to 2020 Primary care consultations England Weekly rates of General Practitioner (GP) consultations for influenza-like illness (ILI) through the Royal College of General Practitioners (RCGP) scheme17 increased above the Moving Epidemic Method (MEM) baseline threshold for the 2019 to 2020 season of 12.7 per 100,000 in week 49, 2019 and then peaked in week 51, 2019 at 19.4 per 100,000. Rates remained at or above the threshold for 6 weeks until week 2, 2020 in England. Rates also increased above the MEM baseline threshold in week 11, 2020 before decreasing below the baseline threshold in week 12, 2020 (Figure 10). The number of weeks where the ILI rate was above baseline threshold in 2019 to 2020 was fewer than that observed in the 2018 to 2019 season (6 weeks vs 8 weeks). The peak activity in 2019 to 2020 was lower and earlier compared to the previous season in 2018 to 2019 (23.1 per 100,000 in week 06 2019). In comparison to the last influenza A(H3N2) dominated season in 2017 to 2018, the peak activity was lower and occurred earlier in the season (19.4 per 100,000 in week 51 in 2019 to 2020 compared to 54.1 per 100,000 in week 3 in 2017 to 2018). By age group, activity peaked at the highest levels in the
Surveillance of influenza and other respiratory viruses in the UK: Winter 2019 to 2020

Figure 10. Weekly all age GP influenza-like illness rates for 2019 to 2020 and past
seasons, and peak rates by age group in 2019 to 2020, England (RCGP)

                                  140
                                  130
                                  120
                                  110
                                  100
   ILI rate per 100,000

                                                          90
                                                          80
                                                          70
                                                          60
                                                          50
                                                          40
                                                          30
                                                          20
                                                          10
                                                                    0
                                                                        40 42 44 46 48 50 52 2 4 6 8 10 12 14 16 18 20 22 24 26 28 30 32 34 36 38
                                                                                                     Week number

                                                                               2010-11         2016-17      2017-18     2018-19     2019-20

                                                                        40
                          Maximum ILI rate per 100,000 population

                                                                        35

                                                                        30

                                                                        25

                                                                        20

                                                                        15

                                                                        10

                                                                         5

                                                                         0
Surveillance of influenza and other respiratory viruses in the UK: Winter 2019 to 2020
Scotland
Weekly GP consultations for ILI increased above the baseline MEM threshold of 26.7
per 100,000 in week 11, 2020 and peaked in week 12, 2020 at 38.1 per 100,000, which
is also above the low MEM threshold of 37.2 per 100,000. Rates dropped below the
baseline threshold in week 13, 2020. The COVID-19 lockdown in week 13, 2020
contributed to a reduction in the number of consultations in GP practices (Figure 11).
Overall seasonal ILI activity had lower intensity compared to the last influenza A(H3N2)
dominated season in 2017 to 2018 (peak of 113.9 per 100,000 in 2017 to 2018
compared to 38.1 per 100,000 in 2019 to 2020), and ILI activity peaked later in the
season (week 12, 2020 compared to week 2 2018). It is unclear what impact the
COVID-19 pandemic had on ILI activity in the latter part of the season.
By age group, the highest levels of activity were seen in 15 to 44 year olds (51.1 per
100,000 in week 12, 2020), 45 to 64 year olds (40.6 per 100,000 in week 12, 2020) and
under 1 year olds (36.1 per 100,00 in week 12, 2020).
Figure 11. Weekly all age GP influenza-like illness rates for 2019 to 2020 and past
seasons, and peak rates by age group in 2019 to 2020, Scotland
400
350
300
ILI rate per 100,000
250
200
150
100
50
0
40 42 44 46 48 50 52 2 4 6 8 10 12 14 16 18 20 22 24 26 28 30 32 34 36 38
Week number
2010-11 2016-17 2017-18 2018-19 2019-20
24Surveillance of influenza and other respiratory viruses in the UK: Winter 2019 to 2020
60
Maximum ILI rate per 100,000
50
40
population
30
20
10
0Surveillance of influenza and other respiratory viruses in the UK: Winter 2019 to 2020
Figure 12. Weekly all age GP influenza-like illness rates for 2019 to 2020 and past
seasons, Wales
100
90
80
ILI rate per 100,000
70
60
50
40
30
20
10
0
40 42 44 46 48 50 52 2 4 6 8 10 12 14 16 18 20 22 24 26 28 30 32 34 36 38
Week number
2010-11 2016-17 2017-18 2018-19 2019-20
Northern Ireland
Weekly GP consultations for ILI in Northern Ireland increased above the baseline MEM
threshold of 14.7 per 100,000 in week 48 2019, peaking at 29.2 per 100,000 in week 49,
2019. Rates reached medium intensity levels. Rates dropped below the baseline MEM
threshold of 14.7 per 100,000 in week 52, 2019. Rates increased above the baseline
threshold in weeks 01 and 11 2020. This compared to a peak of 65.2 per 100,000 in
week 2 in 2017 to 2018, the last influenza A(H3N2) dominated season (Figure 13).
By age group, the highest levels of activity were seen in the 5 to 14 year olds (62.4 per
100,000) and 1 to 4 year olds (42.9 per 100,000) both in week 48 2019 (Figure 13).
26Surveillance of influenza and other respiratory viruses in the UK: Winter 2019 to 2020
Figure 13. Weekly all age GP influenza-like illness rates for 2019 to 2020 and past
seasons, and peak rates by age group in 2019 to 2020, Northern Ireland
140
120
100
ILI rate per 100,000
80
60
40
20
0
40 42 44 46 48 50 52 2 4 6 8 10 12 14 16 18 20 22 24 26 28 30 32 34 36 38
Week number
2010-11 2016-17 2017-18 2018-19 2019-20
70
Maximum ILI rate per 100,000 population
60
50
40
30
20
10
0Surveillance of influenza and other respiratory viruses in the UK: Winter 2019 to 2020
Secondary care surveillance
Influenza surveillance in secondary care is carried out through the UK Severe Influenza
Surveillance Systems (USISS), which were established after the 2009 influenza
pandemic. There are 2 established schemes:
• the USISS sentinel hospital scheme, which is a sentinel network of acute trusts in
England who report weekly aggregate numbers on laboratory confirmed influenza
hospital admissions at all levels of care
• the USISS mandatory ICU scheme – a national mandatory collection which collects
the weekly number of laboratory confirmed influenza cases admitted to Intensive
Care Units (ICU) and High Dependency Units (HDU) and number of confirmed
influenza deaths in ICU/HDU across the UK
For the 2019 to 2020 season, the MEM method has been applied to the USISS
schemes (using the previous 5 seasons’ rates of admission) to calculate thresholds to
show the impact of influenza activity throughout the season18.
USISS Sentinel
Through the USISS sentinel scheme, a total of 4,918 hospitalised confirmed influenza
cases (mean weekly incidence of 1.99 per 100,000 trust catchment population) were
reported from 22 participating sentinel NHS acute trusts across England from week 40,
2019 to week 14, 2020. This compares to a total of 5,667 cases (mean weekly
incidence 1.82 per 100,000 trust catchment population) from 24 participating trusts in
2018 to 2019, 10,107 cases (mean weekly incidence of 3.14 per 100,000 trust
catchment population) from 25 participating trusts in 2017 to 2018 and a total of 1,575
cases (mean weekly incidence of 0.77 per 100,000 trust catchment population) from 25
participating trusts in 2016 to 2017 (Figure 14).
The rate of hospital admissions peaked in week 51, 2019 in the medium impact
threshold (7.50 per 100,000 trust catchment population). The peak was at a similar
level to the previous season (Figure 17).
Amongst cases reported, influenza A(not subtyped) was the dominant subtype reported
up to week 14, 2020 (2,825, 57.4%). High number of influenza A(not subtyped) are
seen due to testing being completed by rapid point of care testing (POCT) rather than
the traditional polymerase chain reaction (PCR) testing, with the proportion of influenza
18UK Severe Influenza Surveillance Schemes. www.gov.uk/guidance/sources-of-uk-flu-data-influenza-
surveillance-in-the-uk#disease-severity-and-mortality-data
28Surveillance of influenza and other respiratory viruses in the UK: Winter 2019 to 2020
A(not subtyped) among hospital influenza cases rising in the last number of years
(57.4% of cases in 2019/20 compared to 27.4% in 2016 to 2017) as POCT has
increased in clinical setting. The highest number of cases was observed in the 65+ year
olds (1,796, 36.5%) (Figure 15). The majority of cases aged under 1 year admitted to
hospital were under 6 months old (60.3%).
The cumulative rate of influenza admission was highest in the under 5 year olds and in
the over 65s for influenza A(not subtyped). For influenza A(H3N2) the age groups with
the highest rates were the under 5 year olds (41.2 per 100,000) and the over 65s (27.2
per 100,000) (Figure 16).
Figure 14. Weekly number of influenza confirmed admissions to hospital through the UK
Severe Influenza Surveillance Systems (USISS) sentinel scheme in England, with crude
hospitalisation rate, week 40, 2019 to week 14, 2020
29Surveillance of influenza and other respiratory viruses in the UK: Winter 2019 to 2020
Figure 15. Cumulative influenza confirmed hospital admissions by age group and
influenza type, through the UK Severe Influenza Surveillance Systems (USISS) sentinel
scheme, week 40, 2019 to week 14, 2020
2000
Influenza A(H3N2)
1800
Number of admissions by
Influenza A(H1N1)pdm09
1600
influenza subtype
Influenza A (not subtyped)
1400
1200 Influenza B
1000
800
600
400
200
0Surveillance of influenza and other respiratory viruses in the UK: Winter 2019 to 2020
Figure 17. Weekly number of influenza confirmed hospital admissions to hospital
through the UK Severe Influenza Surveillance Systems (USISS) sentinel scheme with
crude hospitalisation rate for all ages, 2010 to 2020
USISS Mandatory
Through the USISS mandatory scheme, a total of 1,802 ICU/HDU admissions of
confirmed influenza were reported across the UK from week 40, 2019 to week 14,
2020, including 103 deaths, based on combined data from England, Scotland and
Northern Ireland.
In England, through the USISS mandatory scheme, the total number of influenza
confirmed admissions to ICU/HDU was 1,660 from 141 NHS acute trusts (mean weekly
incidence of 0.12 per 100,000 trust population) with 78 influenza deaths in ICU during
the same period (Figure 18).
The cumulative number of cases (1,660 cases) was slightly lower compared to the
2018 to 2019 season (3,017 cases) and 2017 to 2018 season (3,245 case) but higher
than the 2016 to 2017 season (992 cases) in England (Figure 18). The case fatality
rate (proportion of ICU/HDU influenza cases which have died due to influenza) was
4.7% in the 2019 to 2020 season, compared with a case-fatality rate of 9.3% in the
2018 to 2019 season and 10.2% in the 2017 to 2018 season.
ICU/HDU case numbers and admission rates in England peaked in week 51, 2019 with
232 cases observed for that week and a rate of 0.45 per 100,000 in the medium impact
threshold (Figure 18). Of the 1,660 ICU/HDU admissions in England, the majority were
due to influenza A (1,549; 93.3%), with the remainder due to influenza B (111; 6.7%).
Of the influenza A admissions, 1,135 (73.3%) were due to influenza A (not subtyped),
282 (18.2%) were influenza A(H3N2) and 132 (8.5%) were reported to be influenza
A(H1N1)pdm09 (Figure 19).
31Surveillance of influenza and other respiratory viruses in the UK: Winter 2019 to 2020
ICU/HDU admissions occurred in all age groups. Those aged 45 to 64 years made
up 27.2% of all cases and 19.6% of all cases were seen in the 15 to 44 year olds
(Figure 19).
The cumulative rate of influenza admission was highest in all age groups for
admissions with influenza A(not subtyped). High number of influenza A(not subtyped)
are seen due to testing being completed by rapid POCT rather than the traditional PCR
testing. By subtype, the highest rate for influenza A(H1N1)pdm09 was in 65 to 74 year
olds (0.57/100,000) and for influenza A(H3N2) was in 75+ year olds (1.70/100,000)
(Figure 20). In previous seasons influenza A(H3N2) circulation has coincided with high
admissions to secondary care in older age groups.
Figure 18. Weekly number of influenza confirmed admissions to ICU/HDU through the
UK Severe Influenza Surveillance Systems (USISS) mandatory scheme in England, with
crude ICU/HDU admission rate, week 40, 2019 to week 14, 2020
32Surveillance of influenza and other respiratory viruses in the UK: Winter 2019 to 2020
Figure 19. Cumulative ICU/HDU influenza confirmed admissions by age group and
influenza type in England, through the UK Severe Influenza Surveillance Systems
(USISS) mandatory scheme, week 40, 2019 to week 14, 2020
Figure 20. Cumulative rate of influenza confirmed admission to ICU/HDU per 100,000
trust catchment population by age group and influenza type in England, through the UK
Severe Influenza Surveillance Systems (USISS) mandatory scheme, week 40, 2019 to
week 14, 2020
ICU/HDU admission rates peaked at a lower level than seen in the previous 2 seasons
(Figure 21).
33Surveillance of influenza and other respiratory viruses in the UK: Winter 2019 to 2020
Figure 21. Weekly number of influenza confirmed ICU/HDU admissions to hospital in
England through the UK Severe Influenza Surveillance Systems (USISS) mandatory
scheme with crude hospitalisation rate for all ages, 2011 to 2020 (up to week 14)
In Scotland, there were less laboratory confirmed cases requiring intensive care
management (ICU admissions) reported from week 40, 2019 to week 14, 2020 (76
admissions, cumulative rate of 1.39 per 100,000 population) compared to a similar period
in 2017 to 2018 (162 admissions, cumulative rate of 3.00 per 100,000 population), the
last season influenza A(H3N2) was the dominant virus circulating. In comparison to the
2018 to 2019 season (166 admissions, cumulative rate of 3.06 per 100,000 population)
the number of laboratory confirmed cases and rate of ICU admissions was lower in the
2019 to 2020 season. The peak activity was in weeks 52, 2019 and 1, 2020 (12
admission each week). Similar levels of influenza A(H3N2), influenza A(H1N1)pdm09
and influenza A(not subtyped) were seen in ICU, each accounting for between 30% to
33% of admissions. Influenza B accounted for 5.2% of admissions (Figure 22).
The largest number of cases was observed in the 45 to 64 year olds (47.4%) followed
by the 65+ year olds (23.7%) and the 15 to 44 year olds (22.4%). No cases were seen
in those aged less than 1 year (Figure 22).
The case fatality rate (that is, proportion of ICU influenza cases which have died due to
influenza) of 18.4% (14/76) in the 2019 to 2020 season is similar to that seen in the
previous season (19.9%, 33/166).
34Surveillance of influenza and other respiratory viruses in the UK: Winter 2019 to 2020
Figure 22. Weekly number of laboratory confirmed influenza ICU cases with crude rate
of ICU admissions in Scotland, with crude ICU admission rate up to week 14, 2020 and
the cumulative number of ICU admissions by age group and influenza type up to week
14, 2020, Scotland
30 A(H1N1)pdm09 0.70
0.65
Rate of ICU admission per 100,000
25 A(H3N2) 0.60
0.55
A(not subtyped) 0.50
Number of ICU admissions
20 0.45
B 0.40
15 0.35
Rate of ICU admission per 0.30
10 100,000 population 0.25
0.20
0.15
5 0.10
0.05
0 0.00
40 41 42 43 44 45 46 47 48 49 50 51 52 1 2 3 4 5 6 7 8 9 10 11 12 13 14
Week number
A(H1N1)pdm09 A(H3N2) A(not subtyped) B
40
Number of admissions by influenza subtype
35
30
25
20
15
10
5
0Surveillance of influenza and other respiratory viruses in the UK: Winter 2019 to 2020
Figure 23. Weekly number of laboratory confirmed influenza ICU cases with crude rate
of ICU admissions in Wales and the cumulative proportion of ICU admissions by age
group up to week 14, 2019, Wales
20 B 0.70
Rate of ICU admission per 100,000
A(not subtyped) 0.60
Number of ICU admissions
15 A(H3N2) 0.50
A(H1N1)pdm09
0.40
10 Rate of ICU admission per
100,000 population 0.30
0.20
5
0.10
0 0.00
40 42 44 46 48 50 52 2 4 6 8 10 12 14
Week number
25
A(not subtyped) A(H1N1)pdm09 A(H3N2) B
20
Number of admissions by influenza
15
subtype
10
5
0Surveillance of influenza and other respiratory viruses in the UK: Winter 2019 to 2020
Figure 24. Weekly number of laboratory confirmed influenza ICU cases in Northern
Ireland and the cumulative number of ICU admissions by age group and influenza type
up to week 14, 2020, Northern Ireland
20 A(unsubtyped) & B 1.00
Rate of UCU admission per 100,000
18 B
0.90
Number of ICU admissions
16 0.80
A(not subtyped)
14 0.70
A(H3N2)
12 0.60
A(H1N1)pdm09
10 0.50
Rate of ICU admission per
8 100,000 population 0.40
6 0.30
4 0.20
2 0.10
0 0.00
40 41 42 43 44 45 46 47 48 49 50 51 52 1 2 3 4 5 6 7 8 9 10 11 12 13 14
Week number
30
A(H1N1)pdm09 A(H3N2)
A(not subtyped) B
Number of admissions by influenza subtype
25 A(not subtyped) & B
20
15
10
5
0Surveillance of influenza and other respiratory viruses in the UK: Winter 2019 to 2020
USISS Severe Respiratory Failure Centre (SRF)
This surveillance system collects data on every patient admitted to a Severe
Respiratory Failure (SRF) Centre, for ExtraCorporeal Membrane Oxygenation (ECMO)
or other advanced respiratory support, and whether or not the primary cause is known
to be infection-related. There are 6 SRFs in the UK (5 in England and 1 in Scotland).
For the 2019 to 2020 season, of 205 SRF admissions reported by 6 SRFs between
week 40, 2019 and week 14, 2020, 37 (18%) were laboratory confirmed influenza
admissions, including 13 influenza A(H1N1)pdm09, 7 influenza A(H3N2) and 14
influenza A(not subtyped) and 3 influenza B. This compares with a total of 96 influenza
admissions to SRF centres in 2018 to 2019, where influenza A(H1N1)pdm09
predominated SRF centre admissions throughout early part of the season, followed by
influenza A(H3N2) in the latter part. In the previous season (2017 to 2018) where
influenza B and A(H3N2) co-circulated in SRF centres, there were 60 influenza
admissions to SRF centres. The 2019 to 2020 figure for influenza admissions to SRF
centres was also lower compared to the total of 73 influenza confirmed admissions to
SRF centres in 2015 to 2016, another recent season where influenza A(H1N1)pdm09
predominated in SRF centres.
38Surveillance of influenza and other respiratory viruses in the UK: Winter 2019 to 2020
Microbiological surveillance
Respiratory DataMart, England
Influenza A and B positivity were monitored through the respiratory DataMart
surveillance scheme in England for the season of 2019 to 2020, with the overall
influenza positivity increasing above the Moving Epidemic Method (MEM) baseline
threshold of 9.7% in week 47, 2019 (Figure 25). Influenza A(H3N2) was the dominant
circulating virus in the early part of the 2019 to 2020 season. In the latter part of the
season influenza A(H3N2), influenza A(H1N1)pdm09 and influenza B, all circulated at
low levels.
Overall influenza positivity peaked at 25.3% in week 52, 2019, with the majority of
positive samples associated with influenza A. Influenza A positivity peaked in the same
week at 24.6%. Influenza A(H3N2) positivity also peaked in week 52, 2019 at 18.0%,
and was higher than the peak seen in the 2017 to 2018 season when influenza
A(H3N2) peaked 8.7% positivity in week 52 2017. The highest age-specific positivity of
A(H3N2) was in the 5 to 14 year olds at 32.3% in week 49, 2019. The number of
influenza B detections remained at very low levels throughout the season with overall
positivity peaking in weeks 9 and 10, 2019 at 1.9%. The number of influenza
A(H1N1)pdm09 detections also remained low throughout the season with overall
positivity peaking in week 2, 2020 at 1.9% (Figure 26).
Figure 25. Weekly number of influenza A and B detections through Respiratory
Datamart in England, with overall % positivity, 2019 to 2020
39Surveillance of influenza and other respiratory viruses in the UK: Winter 2019 to 2020
Figure 26. Weekly number of influenza detections by subtype through Respiratory Datamart in England, with overall % positivity,
2010 to 2020
40Surveillance of influenza and other respiratory viruses in the UK: Winter 2019 to 2020
ECOSS, Scotland
In Scotland, overall influenza positivity reported through non-sentinel sources reported
via Electronic Communication of Surveillance in Scotland (ECOSS) rose above the
MEM baseline threshold of 7.4% in week 47, 2019, and reached a peak of 36.6% in
week 52, 2019. As seen elsewhere in the UK, influenza A(H3N2) was the dominant
circulating virus in Scotland, peaking in week 51, 2019 (Figure 27).
Figure 27. Weekly ECOSS influenza positivity (number and percentage positive) by
influenza subtype from week 40, 2019 to week 14, 2020, Scotland
Sentinel GP-based swabbing scheme
GP-based sentinel swabbing schemes in the UK were dominated by influenza A(H3N2)
in line with observations from other influenza surveillance schemes (Figure 28).
In England, influenza activity through the RCGP/Specialist Microbiology Network (SMN)
schemes increased from week 47, 2019 and remained above 20.0% positivity until
week 3, 2020. Overall influenza positivity peaked at 44.0% in week 51, 2020 (Figure
28).
Influenza activity monitored through the GP Sentinel Scheme in Scotland peaked at
65.6% positivity in week 52, 2019 with influenza A(H3N2) accounting for the majority of
positive specimens (Figure 28).
41Surveillance of influenza and other respiratory viruses in the UK: Winter 2019 to 2020
In Wales, the majority of influenza positive specimens were influenza A(H3N2) with the
peak number of positive specimens seen in week 50, 2019 (Figure 28).
In Northern Ireland, the peak number of influenza positive specimens was seen in week
50, 2019 and was mainly due to influenza A(H3N2) (Figure 28).
Figure 28. Weekly number of influenza positive sentinel virology samples by influenza
type, % positive and ILI rate, 2019 to 2020, UK
140 England (RCGP/SMN) 100.0
Number of samples/ILI consultation rate
B 90.0
120
A (not subtyped) 80.0
100 A(H3N2) 70.0
A(H1N1)pdm09 60.0
80
50.0
ILI rate
% positivity
60 40.0
% positive
40 30.0
per 100,000
20.0
20
10.0
0 0.0
40 42 44 46 48 50 52 2 4 6 8 10 12 14
Week number
100
Scotland 100.0
B
90 A(not subtyped) 90.0
Number of samples/ILI consultation rate
80 A(H3N2) 80.0
70 A(H1N1)pdm09 70.0
60 ILI rate 60.0
50 % positive 50.0
% positivity
40 40.0
30 30.0
per 100,000
20 20.0
10 10.0
0 0.0
40 42 44 46 48 50 52 2 4 6 8 10 12 14
Week number
42Surveillance of influenza and other respiratory viruses in the UK: Winter 2019 to 2020
40
Wales
B
Number of samples/ILI consultation rate
35
A(not
30 subtyped)
A(H3N2)
25
A(H1N1)pdm0
20 9
ILI rate
15
10
per 100,000
5
0
40 42 44 46 48 50 52 2 4 6 8 10 12 14
Week number
40
Northern Ireland B
35
Number of samples/ILI consultation rate
A(not
subtyped)
30
A(H3N2)
25
A(H1N1)pdm09
20
ILI rate
15
per 100,000
10
5
0
40 42 44 46 48 50 52 2 4 6 8 10 12 14
Week number
*NB: Positivity supressed for Wales and Northern Ireland due to small weekly sample numbers.
Virus characterisation
PHE characterises the properties of influenza viruses through 1 or more tests, including
genome sequencing (genetic analysis) and hemagglutination inhibition (HI) assays
(antigenic analysis). These data are used to compare how similar the currently
43Surveillance of influenza and other respiratory viruses in the UK: Winter 2019 to 2020
circulating influenza viruses are to the strains included in seasonal influenza vaccines,
and to monitor for changes in circulating influenza viruses. The interpretation of genetic
and antigenic data sources is complex due to several factors, for example, not all
viruses can be cultivated in sufficient quantity for antigenic characterisation, so that
viruses with sequence information may not be able to be antigenically characterised as
well. Occasionally, this can lead to a biased view of the properties of circulating viruses,
as the viruses which can be recovered and analysed antigenically, may not be fully
representative of majority variants, and genetic characterisation data does not always
predict the antigenic characterisation.
The PHE Respiratory Virus Unit (RVU) has characterised 1,008 influenza A(H3N2)
viruses detected from week 40, 2019 to week 14, 2020. Genetic characterisation of 951
of these shows that 755 belong to the genetic clade 3C.3a, and 196 fall into a cluster
within the 3C.2a1 subclade, designated 3C.2a1b. The Northern Hemisphere 2019/20
influenza A(H3N2) vaccine strain belongs in genetic subclade 3C.3a. A total of 568
A(H3N2) viruses have been antigenically characterised and are similar to the
A/Kansas/14/2017-like Northern Hemisphere 2019/20 (H3N2) vaccine strain. Difficulties
remain with detection and typing of A(H3N2) viruses by HI assays due to observed
receptor binding changes, particularly with viruses from the 3C.2a1 subclade and these
are under-represented in the antigenic characterisation data.
A total of 81 A(H1N1)pdm09 viruses have been genetically characterised to date and all
fall in clade 6B.1A, as does the A(H1N1)pdm09 N. Hemisphere 2019/20 vaccine strain.
Eighty-two A(H1N1)pdm09 viruses have been antigenically characterised and are similar
to the A/Brisbane/02/2018-like N. Hemisphere 2019/20 A(H1N1)pdm09 vaccine strain.
50 influenza B viruses have been characterised to date, where sequencing of the
haemagglutinin (HA) gene shows these viruses belong in genetic clade 1A of the
B/Victoria lineage, clustering in a subgroup within this clade characterised by deletion of
3 amino acids in the HA. One influenza B virus has been characterised genetically as
belonging to genetic clade 3 of the B/Yamagata lineage. The N. Hemisphere 2019/20
B/Victoria-lineage quadrivalent and trivalent vaccine component virus (a
B/Colorado/06/2017-like virus) belongs in genetic clade 1A, clustering in a subgroup
with 2 deletions in the HA. Forty-two influenza B viruses have been antigenically
characterised. Thirty-five (83%) are antigenically similar to B/Colorado/06/2017-like N.
Hemisphere 2019/20 B/Victoria vaccine strain, and all 42 (100%) are closely related
antigenically to the recommended 2020/21 season B/Victoria vaccine strain
(B/Washington/02/2019).
44Surveillance of influenza and other respiratory viruses in the UK: Winter 2019 to 2020
Table 2. Viruses characterised by the PHE Reference Laboratory, from week 40, 2019
to week 14, 2020
No. viruses characterised
Virus Genetic and
Genetic only Antigenic only Total
antigenic
A(H1N1)pdm09 39 42 43 124
A(H3N2) 3C.2a1 0 196 0 196
A(H3N2) 3C.3a 511 244 57 812
A(H3N2) Total 511 440 57 1008
B/Yamagata-lineage 0 1 0 1
B/Victoria-lineage 21 29 21 71
Antiviral resistance
Neuraminidase inhibitor (NI) susceptibility (oseltamivir and zanamivir) is determined by
phenotypic testing of virus isolates and genotypic testing of clinical samples positive for
influenza A(H1N1)pdm09, A(H3N2), and influenza B viruses at the PHE RVU. Two
other laboratories also perform screening for the H275Y amino acid substitution in
influenza A(H1N1)pdm09 positive clinical samples. The data summarized below
combine the results of both RVU and these other laboratories, with resistant cases
reported if confirmed by RVU. The samples tested are routinely obtained for
surveillance purposes, but diagnostic testing of patients not responding to NI treatment
is also performed.
Between week 40, 2019 and week 14, 2020, oseltamivir susceptibility had been
determined for 917 influenza A(H3N2) viruses. All but 6 were susceptible. 906 also
tested for zanamivir susceptibility, all but 2 were susceptible.
106 influenza A(H1N1)pdm09 viruses have been tested for oseltamivir susceptibility and
all were fully susceptible. Of the 106 influenza A(H1N1)pdm09 viruses, 81 have also
been tested for zanamivir susceptibility and all were susceptible.
All of the 43 influenza B viruses tested for both oseltamivir and zanamivir susceptibility
were fully susceptible.
Respiratory syncytial virus (RSV)
Respiratory syncytial virus (RSV) reported through DataMart Surveillance system
peaked in week 49, 2019 at 13.4% positivity, with circulation above 10.0% between
week 47, 2019 and week 1, 2020 (Figure 29). This peak was observed around the same
45You can also read