Surveillance of influenza and other
respiratory viruses in the UK
Winter 2018 to 2019
←
→
Page content transcription
If your browser does not render page correctly, please read the page content below
Surveillance of influenza and other respiratory viruses in the UK Winter 2018 to 2019
Surveillance of influenza and other respiratory viruses in the UK: Winter 2018 to 2019

About Public Health England
Public Health England exists to protect and improve the nation’s health and wellbeing,
and reduce health inequalities. We do this through world-leading science, knowledge
and intelligence, advocacy, partnerships and the delivery of specialist public health
services. We are an executive agency of the Department of Health and Social Care,
and a distinct delivery organisation with operational autonomy. We provide
government, local government, the NHS, Parliament, industry and the public with
evidence-based professional, scientific and delivery expertise and support.

Public Health England
Wellington House
133-155 Waterloo Road
London SE1 8UG
Tel: 020 7654 8000
www.gov.uk/phe
Twitter: @PHE_uk
Facebook: www.facebook.com/PublicHealthEngland

Prepared by: Influenza Surveillance Team, Immunisation and Countermeasures
Division, National Infection Service, PHE
For queries relating to this document, please contact: respscidsc@phe.gov.uk

© Crown copyright 2019
You may re-use this information (excluding logos) free of charge in any format or
medium, under the terms of the Open Government Licence v3.0. To view this licence,
visit OGL. Where we have identified any third party copyright information you will need
to obtain permission from the copyright holders concerned.

Published May 2019
PHE publications                                         PHE supports the UN
gateway number: GW-444                                   Sustainable Development Goals

                                                        2
Surveillance of influenza and other respiratory viruses in the UK: Winter 2018 to 2019
Contents
About Public Health England 2
Executive summary 4
Background 6
Observations 8
Community surveillance 8
Outbreak reporting 12
Medical Officers of Schools Association (MOSA) and PHE scheme 14
Google influenza like illness (ILI) searches (internet-based surveillance) 16
Primary care consultations 17
Secondary care surveillance 21
USISS Mandatory 24
USISS Severe Respiratory Failures Centre (SRF) 30
Microbiological surveillance 31
Vaccination 37
Seasonal influenza vaccine uptake in adults 37
Influenza vaccine (LAIV) programme for children 40
Vaccine effectiveness 44
Other respiratory viruses 45
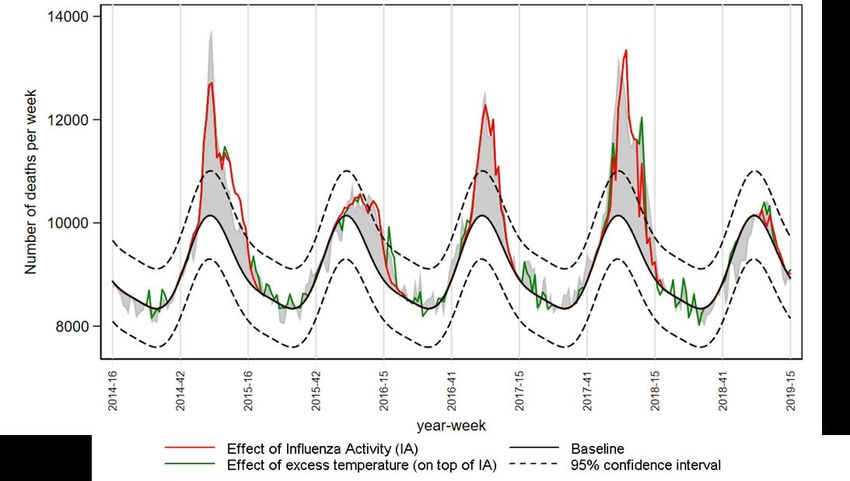
Excess all-cause mortality surveillance 49
Paediatric mortality 50
Influenza-attributable deaths 50
Emerging respiratory viruses 52
Human MERS-CoV infections 52
Human influenza A(H7N9) infections 53
Human influenza A(H5N1) and influenza A(H5N6) infections 53
Conclusions 54
Acknowledgments 56
Appendix A 57
3Surveillance of influenza and other respiratory viruses in the UK: Winter 2018 to 2019 Executive summary In the 2018 to 2019 season, low to moderate levels of influenza activity were observed in the community with circulation of influenza A(H1N1)pdm09 followed by influenza A(H3N2) in the latter part of the season. Activity started in week 01, with the length and peak of activity in general practice varying across the UK, reaching low levels in England, Scotland and Northern Ireland and medium levels in Wales. Influenza transmission resulted in high impact on secondary care in terms of hospitalisations and ICU admissions. The impact of A(H1N1)pdm09 was predominantly seen in the younger age groups (15-44 and 45-64 years) in both GP consultations and hospital and ICU/HDU influenza admissions. Peak admission rates of influenza to hospital and ICU were similar or slightly lower than seen in 2017 to 2018 but higher than all other seasons since 2010 to 2011. Levels of excess all-cause mortality were the lowest seen since 2013 to 2014 in England, although both Scotland and Northern Ireland observed weeks with significant excess mortality for all ages (3 weeks and 2 weeks respectively) including in the 65+ year olds (2 weeks for both). The UK, as with many Northern Hemisphere countries found that the majority of circulating influenza A(H1N1)pdm09 and A(H3N2) strains that were characterised were genetically and antigenically similar to the Northern Hemisphere 2018 to 2019 A(H1N1)pdm09 and A(H3N2) vaccine virus strains. Influenza vaccine uptake in 2018 to 2019 in England for the 65+ year olds was slightly lower than that seen in 2017 to 2018. The vaccine uptake in 2018 to 2019 was also lower than the 2017 to 2018 season for those aged 6 months to under 65 years of age with 1 or more underlying clinical risk factors (48.0%) and pregnant women (45.2%). Vaccine uptake for health care workers in 2018 to 2019 increased to 70.3% compared to 68.7% in 2017 to 2018. In 2018 to 2019, the universal childhood influenza vaccine programme with live attenuated influenza vaccine (LAIV) was again offered to all 2 and 3 year olds across the UK, plus to all children of school age Reception, Year 1, 2, 3, 4 and 5 in England. Uptake in 2 and 3 year olds was 44.9% and in school age children reception to school year 5 was 60.8%. In Scotland and Northern Ireland, where vaccination was offered to all primary school children, the uptake in the 2 to
Surveillance of influenza and other respiratory viruses in the UK: Winter 2018 to 2019

Activity from other circulating seasonal respiratory viruses was similar overall compared
to levels reported in recent years. Two novel respiratory viruses which emerged in 2012
to 2013, Middle East Respiratory Syndrome coronavirus (MERS-CoV) in the Middle
East and avian-origin influenza A(H7N9) in Eastern China, have continued to result in
human cases in affected countries. One imported human case of MERS-CoV infection
was detected in the UK in August 2018. No onward transmission to close contacts
occurred. Surveillance and public health measures established in the UK for travellers
returning with severe respiratory disease from affected countries are on-going.

                                                        5
Surveillance of influenza and other respiratory viruses in the UK: Winter 2018 to 2019
Background
Surveillance of influenza and other respiratory viruses in the United Kingdom (UK) is
undertaken throughout the year and collated by the Influenza Surveillance Team at
Public Health England’s National Infection Service (PHE NIS) on behalf of the countries
of the UK, with weekly outputs published during the winter season between October
(week 40) and May (week 20) the period when influenza typically circulates1. This is in
collaboration with teams within PHE, Health Protection Scotland2, Public Health Wales3
and the Northern Ireland Public Health Agency4, who are each responsible for
producing reports for their countries. A variety of data sources are collated to provide
information on circulating influenza strains (including antigenic and genetic
characterisation) and antiviral resistance monitoring, timing of influenza activity and to
provide rapid estimates of influenza-related burden within the community, on the health
service and in relation to excess all-cause mortality. In addition, in-season and end-of-
season monitoring of seasonal influenza vaccine uptake is undertaken.
Background information on the data sources covered in this report has been previously
described5. The Moving Epidemic Method (MEM)6 is used by the European Centre for
Disease Prevention and Control to standardise reporting of influenza activity across
Europe. It has been adopted by the UK and is publicly presented for GP influenza-like
illness (ILI) consultation rates for each UK scheme and for the proportion of samples
positive for influenza through the respiratory DataMart scheme.
During the 2018 to 2019 season, the roll-out of the licensed live attenuated influenza
vaccine (LAIV) has continued across the UK. In England, LAIV was offered to all 2 and
3 year olds through primary care and to children of school age Reception, Year 1, Year
2, Year 3, Year 4 & Year 5 (4 to 10 year olds) through schools this year.
Additional influenza vaccination activity for children was also carried out with strategies
varying by country of the UK. In England, there were geographically discrete pilots
targeting children of school age Year 6. In England and Wales, all 4 year olds were
offered LAIV in school, whereas in Scotland and Northern Ireland, all 2 to 5 year old
(not yet in school) and all primary school age children were offered LAIV vaccination.
1 Public Health England (PHE). www.gov.uk/government/collections/seasonal-influenza-guidance-data-and-analysis
2 Health Protection Scotland. www.hps.scot.nhs.uk/a-to-z-of-topics/influenza/
3 Public Health Wales. www.wales.nhs.uk/sites3/page.cfm?orgid=457&pid=34338
4 Public Health Northern Ireland. www.publichealth.hscni.net/directorate-public-health/health-protection/influenza
5 Health Protection Agency. Surveillance of influenza and other respiratory viruses in the UK: 2011-2012 report. Available
from:
http://webarchive.nationalarchives.gov.uk/20140714084352/http://www.hpa.org.uk/webc/HPAwebFile/HPAweb_C/1317134705
939
6 Vega T, et al. Influenza surveillance in Europe: establishing epidemic thresholds by the Moving Epidemic Method. Influenza
and Other Respiratory Viruses 2012. doi: 10.1111/j.1750-2659.2012.00422.x.
6Surveillance of influenza and other respiratory viruses in the UK: Winter 2018 to 2019
The 2018 to 2019 season also saw the roll-out of a newly licensed adjuvanted trivalent
influenza vaccine (aTIV) for all those aged 65 years and over.
PHE also carries out surveillance for novel respiratory viruses, including Middle East
Respiratory Syndrome Coronavirus (MERS-CoV) which was first recognised in
September 2012, and human infection with avian influenza such as influenza A(H7N9)
which emerged in Eastern China in 2013; influenza A(H5N1) which emerged in China
in 2003 and influenza A(H5N6) which has been seen in China since 2013.
This report describes influenza activity experienced in the UK in the period from week
40 2018 (week ending 07/10/2018) to week 15 2019 (week ending 14/04/2019). This
includes observations and commentary from the childhood vaccination programme and
activity of other seasonal and novel respiratory viruses.
7Surveillance of influenza and other respiratory viruses in the UK: Winter 2018 to 2019
Observations
Community surveillance
Syndromic surveillance
In England, national PHE real-time syndromic surveillance systems, including GP in
hours and out-of-hours consultations, emergency department attendances (EDSSS)
and NHS 111 calls monitor a range of indicators sensitive to community influenza
activity, for example NHS 111 cold/flu calls and GP consultations for influenza-like
illness (ILI)1.
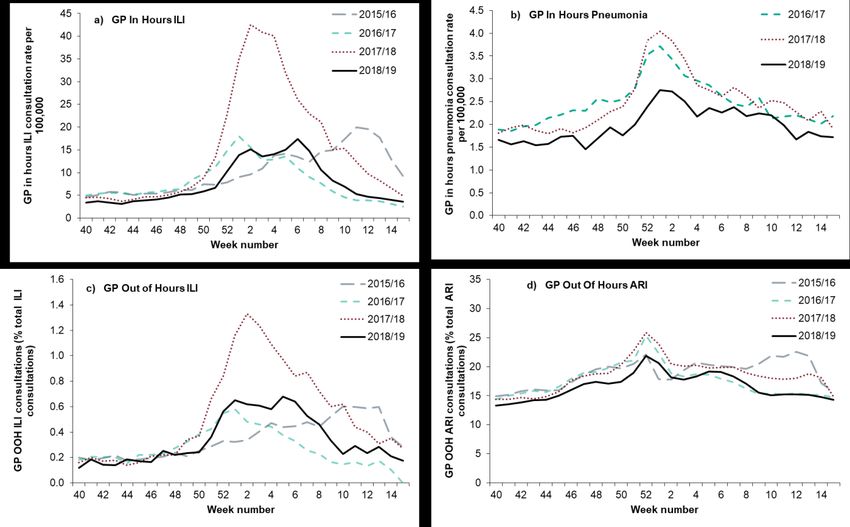
Syndromic surveillance indicators peaked around a similar time for GP in hours ILI
consultations (week 06 2019) and GP out-of-hours ILI consultations (week 05 2019) at
17.4 per 100,000 population and 0.68% of consultations respectively.
The trends and peaks for these systems do not resemble those observed in the last
notable influenza A(H1N1)pdm09 season in 2015 to 2016, with indicators peaking
much earlier and at higher levels during the 2018 to 2019 season. Syndromic indicators
for GP out-of-hours acute respiratory infections (ARI) consultations peaked in week 52
2018 at 21.8% of consultations, though slightly lower, this was similar to the peaks
noted in the previous seasons (2017 to 2018 and 2016 to 2017) (Figure 1).
____________________
1Real Time Syndromic Surveillance, PHE. www.gov.uk/government/collections/syndromic-surveillance-systems-and-analyses
8Surveillance of influenza and other respiratory viruses in the UK: Winter 2018 to 2019
Figure 1. Weekly all age (a) GP in hours consultations for influenza like illness (ILI) (b)
GP in hours consultations for pneumonia (c) GP out of hours consultations for ILI (d)
GP out of hours consultations for acute respiratory infections (ARI) for winter 2015 to
2019, England
NHS 111 calls attributed to cold and flu peaked in week 01 2019 accounting for 1.5% of
calls, a further similar peak was recorded in week 06. Syndromic indicators for
emergency department attendances peaked during week 52 2018 for ARI. During 2018
a new data source was used for the EDSSS, originating from the Emergency Care
Data Set2 , therefore comparisons between 2018 to 2019 and previous seasons should
be interpreted with some caution (Figure 2).
____________________
2NHS Digital Emergency Care Data Set.https://digital.nhs.uk/data-and-information/data-collections-and-data-sets/data-
sets/emergency-care-data-set-ecds
9Surveillance of influenza and other respiratory viruses in the UK: Winter 2018 to 2019
Figure 2. Weekly all age (a) EDSSS acute respiratory infection consultations* (b)
England NHS 111 cold/flu calls for winter 2015 to 2019
* In April 2018, EDSSS changed over from a sentinel data collection system to a centrally coordinated
data collection system using the Emergency Care Data Set. Comparison and interpretation of differences
in levels between 2018/19 and previous seasons should therefore be made with caution
In Scotland, the weekly proportion of all calls to NHS 24 which mention cold/flu, was
low and peaked during week 01 2019 at 0.8%, similar to that of NHS 111 in England.
The proportion of cold/flu calls, peaked at the same time as observed in 2017 to 2018
season, however the proportion was lower throughout (Figure 3).
Figure 3. Proportion of calls for cold/flu (all ages) through NHS 24, Scotland, 2017 to
2019
In Wales, the weekly proportion of all cold/flu calls made to NHS Direct Wales peaked
in week 01 2018, similar to that of NHS 111 in England and NHS 24 in Scotland. For
much of the 2018 to 2019 season in Wales, the proportion of cold/flu calls was lower
10Surveillance of influenza and other respiratory viruses in the UK: Winter 2018 to 2019
than those observed in both the previous season (2017 to 2018) and in 2015 to 2016
when influenza A(H1N1)pdm09 was predominantly circulating (Figure 4).
Figure 4. Weekly proportions of calls for cold/flu (all ages) to NHS-Direct, Wales, 2015 to
2019
11Surveillance of influenza and other respiratory viruses in the UK: Winter 2018 to 2019
Outbreak reporting
Between week 40 2018 and week 15 2019, a total of 1,340 acute respiratory illness
(ARI) outbreaks in closed settings were reported in the UK compared to 2,146 in 2017
to 2018; 1,114 in 2016 to 2017 and 656 in 2015 to 2016 (Table 1).
Of all outbreaks, 932 (69.6%) occurred in care homes, 199 (14.9%) in hospitals, 158
(11.8%) in schools and 51 (3.8%) in other settings. This is a decrease compared to
outbreaks occurring in care homes in the last season (1,697 in 2017 to 2018), but an
increase since the last influenza A(H1N1)pdm09 dominated season (231 in 2015 to
2016).
The peak number of outbreaks was observed in week 03 (107 outbreaks) and week 06
2019 (108 outbreaks) with the majority of outbreaks reported in care homes (62.6%
and 57.4%, respectively).
Table 1. Number and percentage of UK outbreaks by institution type, 2015 to 2019
Outbreaks
2018/19 2017/18 2016/17 2015/16
Total 1,340 2,149 1,114 656
Instituition type
Care homes 932 1,700 875 231
Hospitals 199 230 162 108
Schools 158 160 61 275
Other 51 59 16 42
*Data for 2017/18, 2016/17 & 2017/18 is b ased on week 40 to week 20
Where information on virological testing were available, the majority of outbreaks were
caused by influenza A(not subtyped) (394/765; 51.5%), with a further 22 outbreaks
confirmed to be associated with influenza A(not subtyped) in combination with a non-
influenza virus. There were 78 outbreaks confirmed to be associated with influenza
A(H1N1)pdm09 and 50 outbreaks with influenza A(H3). An additional 5 outbreaks were
in combination with a non-influenza virus (3 influenza A(H1N1)pdm09 and 2 influenza
A(H3)) and 1 outbreak was confirmed to be associated with both subtypes. Very few
outbreaks were associated with influenza B. A large proportion of outbreaks (211/765;
27.6%) were confirmed to be associated with a range of other non-influenza viruses
including respiratory syncytial virus (RSV), rhinovirus, human metapneumovirus
(hMPV), seasonal coronavirus and parainfluenza (Figure 5).
12Surveillance of influenza and other respiratory viruses in the UK: Winter 2018 to 2019
Figure 5. Weekly number of outbreaks by (a) institution type and (b) virological test
results where available by week of reporting, 2018 to 2019 UK
a) b)
120 120 Flu A(H1N1)pdm09 Flu A(H3)
Care home Hospital School Other Flu A Flu A(H1N1)pdm09/Flu A(H3)
110
Flu B Flu A/Other*
100 100 Flu A(H3)/Other Flu A(H1N1)pdm09/Other
Number of outbreaks
Number of outbreaks
90 Flu B/Other Other
80 80
70
60 60
50
40 40
30
20 20
10
0 0
40 42 44 46 48 50 52 02 04 06 08 10 12 14 40 42 44 46 48 50 52 02 04 06 08 10 12 14
Reporting week Week number
*includes 2 outbreaks where Flu A (not subtyped), A(H1N1)pdm09 and other respiratory viruses were identified
In England a total number of 1,214 ARI outbreaks were reported to Public Health
England between week 40 2018 and week 15 2019 compared to 1,871 in the 2017 to
2018 season (week 40 to week 20). The majority of outbreaks were from care home
settings (73.3%) similar to the previous season. School outbreaks accounted for 12.1%
of all outbreaks compared to 8.2% in the 2017 to 2018 season. Hospital outbreaks
accounted for 10.5% of outbreaks; slightly higher than in 2017 to 2018 (9.0%). An
increase in the Other settings category of 4.0% of all outbreaks compared to 2.9% in
2017 to 2018 was also noted. Regionally, the majority of outbreaks occurred in the
South West region (16.4%) followed by the South East and North West regions (15.2%
and 14.6% respectively).
In Scotland, the number of ARI outbreaks reported to Health Protection Scotland (HPS)
between week 40 2018 and week 15 2019 was 48, which is lower than previous
seasons (132 in 2017 to 2018 and 78 in 2016 to 2017). The majority of these outbreaks
were reported from hospital settings (52.1%), unlike previous seasons in which the
majority of outbreaks were observed in care home settings. For the 2018 to 2019
season, care home outbreaks made up 39.6% of the total reported outbreaks for
Scotland. Of the 48 outbreaks reported, 21 were confirmed to be associated with
influenza of which all were influenza A. From those 15 were not subtyped, 4 were
influenza A(H1N1)pdm09 and 2 were influenza A(H3).
In Wales, there were 62 outbreaks of ARI reported to the Public Health Wales Health
Protection teams between week 40 2018 and week 15 2019, compared to 88 during
the 2017 to 2018 season. The majority were reported from hospital settings (69.4%),
followed by care home (16.1%), school and nursery settings (12.9%) and community or
other settings (1.6%). There was at least 1 case with confirmed influenza in 45 (72.6%)
of the outbreaks reported this season, of which 33 were confirmed influenza A, with no
outbreaks confirmed as influenza B. From the outbreaks with confirmed influenza A
13Surveillance of influenza and other respiratory viruses in the UK: Winter 2018 to 2019
cases, 36.4% were not subtyped, 30.3% were influenza A(H1N1)pdm09 and 33.3%
were influenza A(H3).
In Northern Ireland, there were a total of 16 ARI outbreaks reported to the Public Health
Agency between week 40 2018 and week 15 2019; compared to a total of 58 ARI
outbreaks in the 2017 to 2018 season and 15 in the 2016 to 2017 season. Thirteen
(86.7%) outbreaks were reported from care homes and 3 (18.8%) from hospitals.
Virological results were available for 12 confirmed repiratory outbreaks of which 8 were
influenza A not subtyped, 1 was influenza B and 3 were RSV.
Medical Officers of Schools Association (MOSA) and PHE scheme
The Medical Officers of Schools Association (MOSA) was founded in 1884 and involves
a network of more than 200 predominantly private and boarding schools around the
United Kingdom3,4.
Following the re-introduction of influenza A(H1N1) in 1978, which spread widely
amongst children and younger people, Public Health England (PHE) and the Medical
Officers of Schools Association (MOSA) developed a surveillance scheme to monitor
respiratory illness in children attending MOSA (a network of private and boarding
schools) schools in England. Since September 1983, the scheme has formed part of
the routine surveillance activities of PHE.
Participating MOSA schools complete a general annual online survey, including
questions on influenza vaccine policies for students, weekly surveys reporting how
many boarders developed influenza-like-illness (ILI) as well as other respiratory related
illnesses and a vaccine uptake survey by school year.
In 2018 to 2019, 22 MOSA schools agreed to participate in the scheme. Participating
schools included a total of 6,661 boarders, with 97.2% of boarders from secondary
schools. Figure 6 represents the weekly ILI rates observed through the scheme this
season. ILI rates peaked in week 06 2019 at 1.5 per 1,000 boarders.
14Surveillance of influenza and other respiratory viruses in the UK: Winter 2018 to 2019
Figure 6. Weekly ILI rates per 1,000 boarders observed through participating MOSA
schools in England, 2018 to 2019
School holiday periods ILI rate
14.0
12.0
Rates per 1000 boarders
10.0
8.0
6.0
4.0
2.0
0.0
40 42 44 46 48 50 52 2 4 6 8 10 12 14 16 18 20
Week number
____________________
3 MOSA-PHE scheme. www.gov.uk/guidance/sources-of-uk-flu-data-influenza-surveillance-in-the-uk#clinical-surveillance-
through-primary-care
4 MOSA website. www.mosa.org.uk/
Flusurvey (internet based surveillance)
Flusurvey is part of a European wide initiative (including 11 European countries) run by
Public Health England, providing internet-based surveillance of ILI in the UK
population. On registration, individuals aged 18+ complete a baseline questionnaire
which includes demographic, geographic, socioeconomic (household size and
composition, occupation, education, and transportation), and health (vaccination, diet,
pregnancy, smoking, and underlying medical conditions) data. Subsequently,
participants are sent weekly reminders to report any symptoms relating to flu that they
may have experienced and their health-seeking behaviour as a result of their
symptoms. During the 2018 to 2019 season, participants were recruited in the first 6
weeks of the survey period (week 44 to week 50).
A total of 4,065 participants were recruited of which 3,717 (91.4%) completed at least 1
survey contributing over 53,399 real-time flu related symptoms data, with an average
weekly response rate of 59.6%. Data on age was available for 4,010 participants; 95%
(3,807) were 18+ year olds. The majority (3,531; 88.3%) of participants were resident in
England; 244 participants were from Scotland; 27 participants were from Northern
Ireland and 152 from Wales.
15Surveillance of influenza and other respiratory viruses in the UK: Winter 2018 to 2019 Based only on participants who completed 3 or more weekly symptom surveys and using the ECDC ILI case definition of sudden onset of symptoms and at least 1 of; fever, malaise, headache or muscle pain and at least 1 of; cough, sore throat, shortness of breath, the overall number of self-reported ILI cases was 1,651 (3.1%). Self-reported ILI trends showed 2 peaks at week 52 and week 6 with the highest ILI incidence observed in participants in the
Surveillance of influenza and other respiratory viruses in the UK: Winter 2018 to 2019

Due to the nature of daily data and its fluctuations in estimating rates based on
searches, a 3-day moving average was applied to visualise the underlying trend.

Figure 8. Daily estimated ILI Google search query rates (and 3-day moving average)
and RCGP ILI consultation rates per 100,000 population, 2018 to 2019

                                     50                                                                      RCGP Weekly Rate
                                                                                                             Estimated Daily Rate
                                     45
                                                                                                             3-Day Moving Avg.
                                     40                                                                      2017/18 Estimated Daily Rate
    ILI estimated rate per 100,000

                                     35

                                     30

                                     25

                                     20

                                     15

                                     10

                                     5

                                     0
                                          40 41 42 43 44 45 46 47 48 49 50 51 52 1 2 3 4     5   6   7   8    9 10 11 12 13 14 15
                                                                               Week Number

*The RCGP weekly ILI rate is plotted on the Sunday of each week.
___________________
5 i.sense website. www.i-sense.org.uk/
6 Lampos V et al. Enhancing feature selection using word embeddings: the case of flu surveillance. Proceedings of the 26th
International Conference on the World Wide Web, April 03-07, 2017, Perth Australia.
7 Lampos V et al. Advances in nowcasting influenza-like illness rates using search query logs. Scientific Reports. 2015 3;5.

doi:10.1038/srep12760
8
  Royal College of General Practitioners Research and Surveillance Centre: www.rcgp.org.uk/clinical-and-research/our-
programmes/research-and-surveillance-centre.aspx

Primary care consultations

England

Weekly rates of General Practitioner (GP) consultations for influenza-like illness (ILI)
through the Royal College of General Practitioners (RCGP) scheme9 increased above
the Moving Epidemic Method (MEM) baseline threshold for the 2018 to 2019 season of
13.1 per 100,000 in week 01 2019 and then peaked in week 06 2019 at 23.1 per
100,000. Rates remained at or above the threshold for 8 weeks until week 08 2019 in
England (Figure 9).

                                                                                   17
Surveillance of influenza and other respiratory viruses in the UK: Winter 2018 to 2019
In comparison to the last influenza A(H1N1)pdm09 dominated season in 2015 to 2016,
the peak activity was lower and occurred earlier in the season (23.1 per 100,000 in
week 06 in 2018 to 2019 compared to 28.7 per 100,000 in week 11 in 2015 to 2016).
The number of weeks where the ILI rate was above baseline threshold in 2018 to 2019
was also fewer than that observed in the 2015 to 2016 season (8 weeks vs 15 weeks).
The peak activity in 2018 to 2019 was much lower compared to the previous season in
2017 to 2018 (54.1 per 100,000 in week 03 2018).
By age group, activity peaked at the highest levels in the 45-64 year olds (30.3 per
100,000 in week 06 2019), 1-4 year olds (24.9 per 100,000 in week 05 2019) and 15-44
year olds (24.5 per 100,000 in week 06 2019).
Figure 9. Weekly all age GP influenza-like illness rates for 2018 to 2019 and past
seasons, and peak rates by age group in 2018 to 2019, England (RCGP)
140 35
Maximum ILI rate per 100,000 population
130
120 30
110
25
ILI rate per 100,000
100
90
80 20
70
60 15
50
40 10
30
20 5
10
0 0
40 42 44 46 48 50 52 2 4 6 8 10 12 14 16 18 20 22 24 26 28 30 32 34 36 38Surveillance of influenza and other respiratory viruses in the UK: Winter 2018 to 2019
2017 to 2018, the peak activity was much lower (peak of 113.9 per 100,000 in 2017 to
2018).
By age group, the highest levels of activity were seen in 45-64 year olds (47.2 per
100,000) and 15-44 year olds (38.8 per 100,000). Overall throughout the current
season the lowest rates of influenza activity were seen in age groups 1-4, 5-14, 65-74
and 75+, where rates ranged from 18.8 per 100,000 to 22.8 per 100,000.
Figure 10. Weekly all age GP influenza-like illness rates for 2018 to 2019 and past
seasons, and peak rates by age group in 2018 to 2019, Scotland
400
50
Maximum ILI rate per 100,000 population
350 45
300 40
ILI rate per 100,000
35
250
30
200 25
150 20
15
100
10
50
5
0 0
40 42 44 46 48 50 52 2 4 6 8 10 12 14 16 18 20 22 24 26 28 30 32 34 36 38Surveillance of influenza and other respiratory viruses in the UK: Winter 2018 to 2019
Figure 11. Weekly all age GP influenza-like illness rates for 2018 to 2019 and past
seasons, and peak rates by age group in 2018 to 2019, Wales
100
50
90 45
Maximum ILI rate per 100,000
80 40
ILI rate per 100,000
70 35
population
60 30
50 25
40 20
30 15
10
20
5
10
0
0Surveillance of influenza and other respiratory viruses in the UK: Winter 2018 to 2019
Figure 12. Weekly all age GP influenza-like illness rates for 2018 to 2019 and past
seasons, and peak rates by age group in 2018 to 2019, Northern Ireland
30
140
Maximum ILI rate per 100,000
25
120
ILI rate per 100,000
100 20
population
80
15
60
10
40
5
20
0 0
40 42 44 46 48 50 52 2 4 6 8 10 12 14 16 18 20 22 24 26 28 30 32 34 36 38Surveillance of influenza and other respiratory viruses in the UK: Winter 2018 to 2019
incidence of 3.14 per 100,000 trust catchment population) from 25 participating trusts in
2017 to 2018 and a total of 1,575 cases (mean weekly incidence of 0.77 per 100,000
trust catchment population) from 25 participating trusts in 2016 to 2017 and a total of
2,781 cases (mean weekly incidence of 0.90 per 100,000 trust catchment population)
from 26 participating trusts in 2015 to 2016 (Figure 13).
The number and rate of hospital admissions peaked in week 06 2019 at high impact
(692 admissions, 6.87 per 100,000 trust catchment population). Amongst cases
reported, influenza A unknown was the dominant subtype reported up to week 15 2019
(2,836, 51.5%), with the highest number of cases observed in the 65+ year olds (1,674,
30.4%) (Figure 14). The cumulative rate of influenza admission was highest in the
under 5 year olds for influenza A(H3N2) and influenza A(not subtyped) and in the over
65s for influenza A(not subtyped) and A(H1N1)pdm09. For influenza A(H1N1)pdm09
the age groups with the highest rates were the over 65s (17.7 per 100,000) closely
followed by under 5 year olds (16.4 per 100,000) (Figure 15).
This peak was lower than the 2017 to 2018 season, where the peak was in week 02
2018 with 1,009 admissions and a rate of 9.20 per 100,000 trust catchment population
but higher than the peaks in the previous 2 seasons (Figure 16).
Figure 13. Weekly number of influenza confirmed admissions to hospital through the
USISS sentinel scheme in England, with crude hospitalisation rate, week 40 2018 to
week 15 2019
22Surveillance of influenza and other respiratory viruses in the UK: Winter 2018 to 2019
Figure 14. Cumulative influenza confirmed hospital admissions by age group and
influenza type, through the USISS sentinel scheme, week 40 2018 to week 15 2019
Figure 15. Cumulative rate of influenza confirmed hospital admissions per
100,000 trust catchment population by age group and influenza type in England,
through the USISS sentinel scheme, week 40 2018 to week 15 2019
Figure 16 represents the weekly total number of influenza confirmed hospital
admissions and rate of admissions reported through the USISS sentinel scheme in
England for the period from 2010 to 2019.
23Surveillance of influenza and other respiratory viruses in the UK: Winter 2018 to 2019
Figure 16. Weekly number of influenza confirmed hospital admissions to hospital
through the USISS sentinel scheme with crude hospitalisation rate for all ages, 2010 to
2019
USISS Mandatory
Through the USISS mandatory scheme, a total of 3,157 ICU/HDU admissions of
confirmed influenza were reported across the UK from week 40 2018 to week 15 2019,
including 312 deaths, based on combined data from England, Scotland and Northern
Ireland. In England, the total number of influenza confirmed admissions to ICU/HDU
was 2,924 from 140 NHS acute trusts (mean weekly incidence of 0.21 per 100,000
trust population) with 273 influenza deaths in ICU during the same period (Figure 17).
The cumulative number of cases and deaths were slightly lower compared to the 2017
to 2018 season (3,245 cases (mean weekly incidence of 0.20 per 100,000) and 330
deaths) but higher than the 2016 to 2017 season (992 cases (mean weekly incidence
of 0.06 per 100, 000) and 112 deaths) in England (Figure 17). The case fatality rate
(proportion of ICU/HDU influenza cases which have died due to influenza) was 9.3%
(273/2,924) based on data from week 40 2018 to week 15 2019. This compares with a
case-fatality rate of 10.2% (330/3,245) in the previous 2017 to 2018 season.
ICU/HDU case numbers and admission rates in England peaked in week 05 2018 with
287 cases observed for that week and a rate of 0.57 per 100,000 above the high
impact threshold (Figure 17). Of the 2,924 ICU/HDU admissions in England, the
majority were due to influenza A (2,898; 99.1%), with the remainder due to influenza B
(26; 0.9%). Of the influenza A admissions, 1,860 (64.2%) were due to A(not subtyped),
834 (28.8%) were influenza A(H1N1)pdm09 and 204 (7.0%) were reported to be
influenza A(H3N2) (Figure 18).
24Surveillance of influenza and other respiratory viruses in the UK: Winter 2018 to 2019
ICU/HDU admissions occurred in all age groups. Those aged 45-64 years made up
39.8% of all cases and 19.8% of all cases were seen in the 15-44 year olds (Figure 17).
In the previous season in which there was co-circulation of influenza B and influenza
A(H3N2), the largest proportion of admissions occurred in those in the 65+ and 45-64
year olds. The cumulative rate of influenza admission was highest in all age groups for
admissions with influenza A(not subtyped); by subtype this was highest for
A(H1N1)pdm09 in 45-64 year olds (2.7/100,000) and in 75+ year olds for A(H3N2)
(1.0/100,000) (Figure 19).
Within England, regional variation in the rate of confirmed influenza admissions to
ICU/HDU was assessed using NHS England Local Team boundaries. The rate of
ICU/HDU influenza admissions ranged from 2.4 per 100,000 per trust catchment
population in Lancashire to 14.1 per 100,000 in Central Midlands in 2018 to 2019
(Figure 20).
Figure 17. Weekly number of influenza confirmed admissions to ICU/HDU through the
USISS mandatory scheme in England, with crude ICU/HDU admission rate, week 40 2018
to week 15 2019
25Surveillance of influenza and other respiratory viruses in the UK: Winter 2018 to 2019
Figure 18. Cumulative ICU/HDU influenza confirmed admissions by age group and
influenza type in England, through the USISS mandatory scheme, week 40 2018 to week
15 2019
Figure 19. Cumulative rate of influenza confirmed admission to ICU/HDU per 100,000
trust catchment population by age group and influenza type in England, through the
USISS mandatory scheme, week 40 2018 to week 15 2019
26Surveillance of influenza and other respiratory viruses in the UK: Winter 2018 to 2019
Figure 20. Overall rate of confirmed influenza ICU/HDU admissions through the USISS
mandatory scheme by NHS England Local Teams, England, week 40 2018 to week 15
2019
Figure 21 represents the weekly total number of influenza confirmed ICU/HDU
admissions and influenza confirmed rate reported through the USISS mandatory
scheme in England for the period from 2011 to 2019.
Figure 21. Weekly number of influenza confirmed ICU/HDU admissions to hospital in
England through the USISS mandatory scheme with crude hospitalisation rate for all
ages, 2011 to 2019 (up to week 15)
27Surveillance of influenza and other respiratory viruses in the UK: Winter 2018 to 2019
In Scotland there were slightly fewer laboratory confirmed cases requiring intensive
care management (ICU admissions) reported from week 40 2018 to week 15 2019 (166
admissions, cumulative rate of 3.06 per 100,000 population) compared to similar period
in 2015 to 2016 (174 admissions, cumulative rate of 3.21 per 100,000 population), the
last season influenza A(H1N1)pdm09 was the dominant virus circulating. Compared to
the 2017 to 2018 season the number of laboratory confirmed cases and rate of ICU
admissions was similar (162 admissions, cumulative rate of 3.00 per 100,000
population). The peak activity was in week 01 2019 and the majority of cases were due
to influenza A(H1N1)pdm09 (56.5%) followed by influenza A(not subtyped) (39.1%).
The largest number of cases was observed in the 45-64 year olds (48.8%) followed by
the 15-44 year olds (23.5%) and the 65+ year olds (21.1%). No cases were seen in
those aged less than 1 year (Figure 22).
The case fatality rate (ie proportion of ICU influenza cases which have died due to
influenza) of 19.9% (33/166) is slightly lower than seen in previous seasons 2017 to
2018 (24.4%, 40/164), 2016 to 2017 (26.9%, 23/89) and 2015 to 2016 (26.5%, 50/189).
Figure 22. Weekly number of laboratory confirmed influenza ICU cases with crude rate
of ICU admissions in Scotland, with crude ICU admission rate up to week 15 2019 and
the cumulative number of ICU admissions by age group and influenza type up to week
15 2019, Scotland
In Wales, 120 patients (cumulative rate of 3.8 per 100,000 resident population) in ICU
were confirmed with influenza between week 40 2018 and week 15 2019 with peak
activity in week 07 2019 (Figure 23). Influenza A(H1N1)pdm09 accounted for 48.3% of
these confirmed cases and 30.0% were due to influenza A(H3N2). Of the patients
confirmed with influenza in ICU, 42.5% were aged 45-64 and 40.8% were aged 65+
years.
28Surveillance of influenza and other respiratory viruses in the UK: Winter 2018 to 2019
Figure 23. Weekly number of laboratory confirmed influenza ICU cases with crude rate
of ICU admissions in Wales and the cumulative proportion of ICU admissions by age
group up to week 15 2018, Wales
In Northern Ireland, there were 67 patients (cumulative rate of 3.58 per 100,000
resident population) in ICU with laboratory confirmed influenza between week 40 2018
and week 15 2019, with peak activity in week 07 2019. Influenza A(H1N1)pdm09
accounted for the majority (68.7%) of these confirmed cases followed by influenza
A(unknown subtype) (9.0%), there were no influenza B cases seen. By age group, the
majority of cases (58.2%) were in those aged 45-64 years old, no cases were seen in
those aged 5-14 years old. Seven deaths (10.4% of ICU cases) were also reported in
the ICU/HDU patients with laboratory confirmed influenza (Figure 24).
Figure 24. Weekly number of laboratory confirmed influenza ICU cases in Northern
Ireland and the cumulative number of ICU admissions by age group and influenza type
up to week 15 2019, Northern Ireland
29Surveillance of influenza and other respiratory viruses in the UK: Winter 2018 to 2019
USISS Severe Respiratory Failures Centre (SRF)
This surveillance system collects data on every patient accepted by a SRF Centre,
whether for ExtraCorporeal Membrane Oxygenation (ECMO) or other advanced
respiratory support, and whether or not the primary cause is known to be infection-
related. There are 6 SRFs in the UK (5 in England and 1 in Scotland).
For the 2018 to 2019 season, of the 206 SRF admissions reported by 5 SRFs between
week 40 2018 and week 15 2019, 96 were laboratory confirmed influenza admissions,
including 79 influenza A(H1N1)pdm09, 6 influenza A(H3N2) and 11 influenza
A(unknown subtype). This compares to a total of 73 influenza confirmed admissions in
2015 to 2016, the last influenza A(H1N1)pdm09 dominated season and a total of 60
influenza confirmed admissions in 2017 to 2018, when influenza A(H3N2) dominated.
30Surveillance of influenza and other respiratory viruses in the UK: Winter 2018 to 2019
Microbiological surveillance
Respiratory DataMart, England
Influenza A and B positivity were monitored through the respiratory DataMart
surveillance scheme in England for the season of 2018 to 2019, with the overall
influenza positivity increasing above the MEM baseline threshold of 9.2% in week 51
2018. Influenza A(H1N1)pdm09 was the dominant circulating virus in the 2018 to 2019
season followed by influenza A(H3); with influenza A(H1N1)pdm09 circulating in the
early part of the season and influenza A(H3) circulating toward the latter part of the
season.
Overall influenza positivity peaked at 28.6% in week 06 2019, with the majority of
positive samples associated with influenza A which peaked in the same week at 28.4%.
Influenza A(H1N1)pdm09 positivity peaked at 11.1% in week 06 2019, this peak was
later and lower than seen in 2015 to 2016 season in which A(H1N1)pdm09 peaked at
17.7% in week 04 2016. The highest age-specific positivity of A(H1N1)pdm09 was in
the 15-44 year olds at 16.9% in week 06 2019. Influenza A(H3) positivity peaked at
8.6% in week 07 2019. This peak was later and lower than that seen in the 2017 to
2018 season where a peak of 9.9% was seen in week 52 2017. The number of
influenza B detections remained at very low levels throughout the season with overall
positivity peaking in week 45 2018 at 0.5% (Figure 25).
Figure 25. Weekly number of influenza A and B detections through Respiratory
Datamart in England, with overall % positivity, 2018 to 2019
Number of influenza A detections Number of influenza B detections
% Overall positivity (2018/19) % Overall positivity (2017/18)
100.0% 1500
Number of positive samples
90.0% 1350
% overall positivity
80.0% 1200
70.0% 1050
60.0% 900
50.0% 750
40.0% 600
30.0% 450
20.0% 300
Baseline threshold: 9.2%
10.0% 150
0.0% 0
40 42 44 46 48 50 52 2 4 6 8 10 12 14 16 18 20
Week number
31Surveillance of influenza and other respiratory viruses in the UK: Winter 2018 to 2019
Figure 26. Weekly number of influenza detections by subtype through Respiratory Datamart in England, with overall % positivity,
2010 to 2019
32Surveillance of influenza and other respiratory viruses in the UK: Winter 2018 to 2019
ECOSS, Scotland
In Scotland, overall influenza positivity reported through non-sentinel sources (ECOSS)
rose above the MEM baseline threshold of 6.3% in week 51 2018, and reached a peak
of 36.2% in week 06 2019. As seen elsewhere in the UK, influenza A(H1N1)pdm09 was
the dominant circulating virus in Scotland, peaking in week 06 2019 (Figure 27).
Figure 27. Weekly ECOSS influenza positivity (number and percentage positive) by
influenza subtype from week 40 2017 to week 15 2018, Scotland
Sentinel GP-based swabbing scheme
GP-based sentinel swabbing schemes in the UK were dominated by influenza
A(H1N1)pdm09 followed by influenza A(H3N2) in line with observations from other
influenza surveillance schemes (Figure 28).
In England, influenza activity through the RCGP/SMN schemes increased from week 51
2018 and remained above 20.0% positivity until week 11 2019. Overall influenza
positivity peaked at 60.7% in week 06 2019 (Figure 28).
Influenza activity monitored through the GP Sentinel Scheme in Scotland peaked at
58.8% positivity in week 05 2019 with predominance of influenza A(H1N1)pdm09 in
weeks 48 2018 to 08 2019 with the peak number of positive specimens seen in week 06
2019 (Figure 28).
33Surveillance of influenza and other respiratory viruses in the UK: Winter 2018 to 2019
Figure 28. Weekly number of influenza positive sentinel virology samples by influenza
type,% positive and ILI rate, 2018 to 2019, UK
*NB: Positivity supressed for Wales and Northern Ireland due to small weekly sample numbers.
In Wales, the majority of influenza positive specimens were influenza A(H1N1)pdm09
with the peak number of positive specimens seen in week 03 2019.
In Northern Ireland the peak number of influenza positive specimens was seen in week
07 2019 and was mainly due to influenza A(H1N1)pdm09.
34Surveillance of influenza and other respiratory viruses in the UK: Winter 2018 to 2019
Virus characterisation
PHE characterises the properties of influenza viruses through 1 or more tests,
including genome sequencing 12 (genetic analysis) and haemagglutination inhibition 13
(HI) assays (antigenic analysis). These data are used to compare how similar the
currently circulating influenza viruses are to the strains included in seasonal influenza
vaccines, and to monitor for changes in circulating influenza viruses. The interpretation
of genetic and antigenic data sources is complex due to a number of factors, for
example, not all viruses can be cultivated in sufficient quantity for antigenic
characterisation, so that viruses with sequence information may not be able to be
antigenically characterised as well. Occasionally, this can lead to a biased view of the
properties of circulating viruses, as the viruses which can be recovered and analysed
antigenically, may not be fully representative of majority variants, and genetic
characterisation data does not always predict the antigenic characterisation
Since week 40 2018, the PHE Respiratory Virus Unit (RVU) has characterised 959
influenza A(H1N1)pdm09 viruses (Table 2). Genetic characterisation of 922 influenza
A(H1N1)pdm09 viruses detected since week 40 shows that they all belong in the
genetic subgroup 6B.1, which was the predominant genetic subgroup in the 2017/18
season. Two-hundred and eighty-three A(H1N1)pdm09 viruses have been antigenically
characterised and are similar to the A/Michigan/45/2015-like Northern Hemisphere
2018/19 (H1N1)pdm09 vaccine strain.
Genetic characterisation of 226 A(H3N2) influenza viruses detected, showed that they
all belonged to genetic subclade 3C.2a, with 218 belonging to a cluster within this
genetic subclade designated as 3C.2a1. Eleven viruses belonging to the genetic
subclade 3C.3a have been identified. The Northern Hemisphere 2018/19 influenza
A(H3N2) vaccine strain A/Singapore/INFIMH-16-0019/2016 belongs in genetic subclade
3C.2a1.
Of 3 influenza B viruses characterised, 2 influenza B viruses have been characterised
where sequencing of the haemagglutinin (HA) gene shows they belong within genetic
clade 1A of the B/Victoria lineage. One of them clusters in a subgroup characterised by
deletion of 2 amino acids in the HA. The N.Hemisphere 2018/19 B/Victoria-lineage
quadrivalent and trivalent vaccine component virus (a B/Colorado/06/2017-like virus), is
a double deletion subgroup virus. The other influenza B virus has been characterised
genetically as belonging to genetic clade 3 of the B/Yamagata lineage and antigenically
as similar to the B/Phuket/3073/2013 B/Yamagata lineage vaccine component in the
N.Hemisphere 2018/19 quadrivalent vaccine.
_________________
12 CDC genome sequencing. www.cdc.gov/flu/professionals/laboratory/genetic-characterization.htm
13 CDC Antigenic information. www.cdc.gov/flu/professionals/laboratory/antigenic.htm
35Surveillance of influenza and other respiratory viruses in the UK: Winter 2018 to 2019
Table 2. Viruses characterised by the PHE Reference Laboratory, from week 40 2018 to
week 15 2019
No. viruses characterised
Virus
Genetic and antigenic Genetic only Antigenic only Total
A(H1N1)pdm09 246 676 37 959
A(H3N2) 0 237 0 237
B/Yamagata-lineage 1 0 0 1
B/Victoria-lineage 0 2 0 2
Antiviral resistance
Neuraminidase inhibitor (NI) susceptibility (oseltamivir and zanamivir) is determined by
phenotypic testing of virus isolates and genotypic testing of clinical samples positive for
influenza A(H1N1)pdm09, A(H3N2), and influenza B viruses at the PHE RVU. Three
other laboratories also perform screening for the H275Y amino acid substitution in
influenza A(H1N1)pdm09 positive clinical samples. The data summarized below
combine the results of both RVU and these other laboratories, with resistant cases
reported if confirmed by RVU. The samples tested are routinely obtained for
surveillance purposes, but diagnostic testing of patients not responding to NI treatment
is also performed.
Since week 40 2018, 901 influenza A(H1N1)pdm09 viruses have been tested for
oseltamivir susceptibility, 880 were fully susceptible and 21 were resistant confirmed by
PHE-RVU. All 21 oseltamivir resistant cases had the H275Y amino acid substitution.
Available information on 8 of the 21 cases shows that 7 had received oseltamivir
treatment and 1 case had no known history of prior exposure to oseltamivir. Of the 901
influenza A(H1N1)pdm09 viruses, 713 have also been tested for zanamivir susceptibility
and all were susceptible.
Oseltamivir susceptibility has been determined for 171 influenza A(H3N2) viruses, with
158 also tested for zanamivir susceptibility, all of which were fully susceptible.
All of the 3 influenza B viruses tested for both oseltamivir and zanamivir susceptibility
were fully susceptible.
36Surveillance of influenza and other respiratory viruses in the UK: Winter 2018 to 2019
Vaccination
Seasonal influenza vaccine uptake in adults
Although, all countries of the UK use standardised specifications to extract uptake data
from IT information systems in primary care, there are some differences in extraction
specifications, so comparisons should be made cautiously.
In England, the uptake of seasonal influenza vaccine is monitored by PHE throughout
the season based upon weekly and monthly extracts from GP information systems.
Cumulative uptake on influenza vaccinations administered up to 28 February 2019 was
reported from 96.7% (6,680/6,910) of GP practices in England in 2018 to 2019.
Comparative data are up to 28 February 2018 where uptake was reported from 97.5%
(6,982/7,159) of GP practices in England in 2017 to 2018. This season saw a vaccine
uptake of 72.0% in 65+ year olds (compared to 72.9% in 2017 to 2018) and 48.0% for
those aged 6 months to under 65 years of age with 1 or more underlying clinical risk
factors (excluding pregnant women without other risk factors and carers), compared to
49.7% in 2017 to 2018 (Table 3). Uptake in pregnant women was 45.2%, compared to
47.0% in 2017 to 2018.The more detailed final uptake reports are now publicly
available14.
In Scotland, the uptake of seasonal influenza vaccine is estimated by Health Protection
Scotland (HPS) throughout the season, also based on automated 4-weekly extracts
from >95% of all Scottish GP practices. As such, vaccine uptake reported here should
be regarded as provisional. Cumulative uptake in 2018 to 2019 to week 15 showed
vaccine uptake of 73.7% in 65+ year olds (compared to 73.7% in 2017 to 2018). Uptake
amongst those aged 6 months to under 65 year olds in 1 or more clinical at-risk groups
was 42.4% (compared to 44.8% in 2017 to 2018). Overall uptake in pregnant women
(including those with and without other risk factors) up to week 15 2019 was 45.7%,
compared to 49.4% in 2017 to 2018. The uptake in pregnant women (without other risk
factors) was 44.5%, compared with 48.1% in 2017 to 2018. The uptake in pregnant
women (with other risk factors) was 57.4%, compared with 61.8% in 2017 to 2018.
_________________
14 VaccineUptake – Influenza vaccine uptake reports. www.gov.uk/government/collections/vaccine-uptake#seasonal-flu-
vaccine-uptake:-figures
37Surveillance of influenza and other respiratory viruses in the UK: Winter 2018 to 2019
In Wales, the uptake of seasonal influenza vaccine is monitored on a weekly basis by
Public Health Wales throughout the season based on automated weekly extracts of
Read coded data using software installed in all General Practices in Wales collected
through the Audit+ Data Quality System. Cumulative uptake data on influenza
vaccinations administered were received from 100% of GP practices in Wales in 2018
to 2019. This showed a vaccine uptake of 68.3% in 65+ year olds (compared to 68.8%
in 2017 to 2018) and 47.1% for those aged 6 months to under 65 years of age with 1 or
more underlying clinical risk factor (excluding morbidly obese patients without other risk
factors), compared to 48.5% in 2017 to 2018. Overall uptake in pregnant women was
74.2% compared to 72.7% in 2017 to 2018. In Wales, vaccine coverage in pregnant
women is measured differently using a survey of pregnant women giving birth each year
during January. In addition, as elsewhere in the UK, data are also automatically
collected from general practices for women with pregnancy related Read-codes, these
data report uptakes of 59.1% in pregnant women at risk and 45.0% in healthy pregnant
women.
In Northern Ireland, the uptake of seasonal influenza vaccine is monitored by the Public
Health Agency (PHA) of Northern Ireland. Cumulative uptake of influenza vaccination
administered up to 31 March 2019 was reported from 99.1% of GP practices in Northern
Ireland in 2018 to 2019. In the population aged 65+ years uptake was 70.0% (compared
to 71.8% in 2017 to 2018) and in the population of under 65 years at risk the uptake
was 52.4% (compared to 56.0% in 2017 to 2018). Uptake in pregnant women was
44.3% compared to 47.1% in 2018 to 2019.
Uptake by frontline healthcare workers in England was 70.3% from 98.8% of
organisations, an increase from 68.7% in 2017 to 2018. In Scotland, uptake figures in
healthcare workers across all territorial health boards was 51.2%; this compares with
45.7% in 2017 to 2018. In Wales, uptake reached 55.5% compared to 56.9% in 2017 to
2018. In Northern Ireland, uptake in frontline healthcare workers including social care
was 35.4% compared to 33.4% in 2017 to 2018. Uptake for healthcare workers
excluding social care was 39.5% in 2018 to 2019.
Table 3 summarises uptake in adults in the UK.
38Surveillance of influenza and other respiratory viruses in the UK: Winter 2018 to 2019
Table 3. Influenza vaccine uptake in 65+ year olds, 6 months to under 65 years at risk, pregnant women and healthcare
workers, 2018 to 2019, UK
England Scotland Northern Ireland Wales
Target Group Number Number Number Number
Denominator % uptake Denominator % uptake Denominator % uptake Denominator % uptake
vaccinated vaccinated vaccinated vaccinated
65+ years 7,260,596 10,087,978 72.0 769,184 1,043,401 73.7 221,393 316,480 70.0 457,200 669,472 68.3Influenza vaccine (LAIV) programme for children
England
The Immform survey was used to monitor influenza vaccine uptake in 2 and 3 olds in
primary care in England. The cumulative uptake for all GP-registered 2 year olds up to
28 February 2019 was 43.8% (compared to 43.3% in 2017 to 2018) and was 45.9% in
3 year olds (compared to 44.7% in 2017 to 2018) in England. This was reported from
96.2% of GP practices in England. The combined uptake for 2 and 3 year olds was
44.9% compared to 44.0% in 2017 to 2018.
The seasonal influenza vaccine programme for children school year reception, 1,2, 3, 4
and 5 (4 years rising to 10 years of age) was mainly delivered via a school-based
programme, although 1 area delivered vaccinations through general practice. Vaccine
uptake was monitored through manual returns by local teams for their responsible
population.
An estimated 2,461,563 children in school years’ reception, 1, 2, 3, 4 and 5 (4 years
rising to 10 years of age) in England received at least 1 dose of influenza vaccine
during the period 1 September 2018 to 31 January 2019. With an estimated total target
population of 4,051,698; the overall uptake was 60.8%. Total uptake in children in
reception and school years 1, 2, 3, 4 and 5 was 64.3%, 63.6%, 61.5%, 60.4%, 58.3%
and 56.5%, respectively. Uptake by local NHS England Team ranged from 49.4% to
68.9% in London and the Hampshire, Isle of Wight and Thames Valley team,
respectively (Table 4). Overall uptake for children in school years’ reception, 1, 2, 3, 4
and 5 age combined by LA (not shown here) ranged from 30.1% (6,138/20,399) in
Tower Hamlets to 80.6% (17,174/21,309) in East Riding. Uptake by year group by LA
ranged from 32.2% to 89.1% in reception, 34.2% to 82.3% in year 1, 31.4% to 80.3% in
year 2, 31.3% to 80.7% in year 3, 26.3% to 78.3% in year 4 and 24.9% to 77.3% in
year 5.
A more detailed PHE report on influenza vaccine uptake in England in primary school
age children is publicly available 15.
_________________
15 VaccineUptake – Influenza vaccine uptake reports. www.gov.uk/government/collections/vaccine-uptake#seasonal-flu-
vaccine-uptake:-figures
40Table 4. Estimated number and proportion of children of school years reception, 1, 2, 3,
4 and 5 age who were vaccinated with influenza vaccine by local NHS England team
from 1 September 2018 to 31 January 2019
* Data for Bassetlaw, an LA district of Nottinghamshire UA, was collected independently. Bassetlaw uptake figures are reported
under Yorkshire and Humber NHS England team.
The 2018 to 2019 season also saw the continuation of the primary school-age
vaccination programme in 5 pilot areas (11 Local Authorities) that have been piloting
the programme since the 2013 to 2014 season (for pilot areas see Appendix A).
Influenza vaccine was offered to all primary school age children aged 4-11 years
(school years’ reception to year 6) through a school based delivery model. The
extension to the pilot programme to include reception aged children (aged 4 rising to 5)
was made in September 2017.
An estimated 214,977 primary school children aged 4-11 years in 5 pilot areas received
at least 1 dose of influenza vaccine during the period 1 September 2018 to 31 January
2019. With an estimated total target population of 343,280, this results in an overall
uptake of 62.6% (ranging by pilot site from 44.6% in Leicester to 80.6% in Rutland)
(Figure 29).
41Figure 29. Estimated proportion of primary school age children (aged 4-11 years) who
were vaccinated with influenza vaccine by pilot area, England, 1 September 2018 to 31
January 2019
Vaccine uptake for the period 1 September 2018 to 31 January 2019 in pilot areas by
year group ranged from 57.2% in school year 6 (aged 10 rising to 11 years) to 69.1% in
reception (aged 4 rising to 5 years), with an overall pattern of decreasing uptake with
increasing age (Figure 30). In the pilot areas, the cumulative LAIV vaccine uptake in
the 2018 to 2019 season was 62.6% which was similar to the uptake in the 2017 to
2018 season (62.4%), both years based on combined data for reception to year 6.
Figure 30. Estimated proportion of primary school age children (aged 4-11 years) who
were vaccinated with influenza vaccine by year group in pilot areas, England, 2016 to
2019
*Children in ages 4-5 years old were vaccinated in GP practices during the 2016/17 season.
42Scotland
The estimated uptake in preschool children (2 to under 5 year olds, not yet in school)
vaccinated in the GP setting was 55.6% in 2018 to 2019 (compared to 56.9% in 2017
to 2018).
In 2018 to 2019, the offer of influenza vaccine was made to all primary school aged
children in Scotland with an estimated 301,943 children aged 4-11 years who received
at least 1 dose of influenza vaccine. With an estimated total target population for the
school based programme of 414,086, this resulted in an uptake of 72.9% at the end of
the season. This is similar to the vaccine uptake achieved during the primary school
programme in 2017 to 2018 (301,160 children vaccinated out of a target population of
412,721, resulting in an 73.0% uptake). These uptake figures are based on aggregate
school level data collated in season and are likely to be an underestimate, as the
estimated uptake from some NHS boards does not include data from additional
children vaccinated in general practice.
Reported uptake of the primary school programme varied by NHS board (Figure 31).
Figure 31. Mean influenza vaccine uptake (%) by NHS board, with confidence intervals
[CI] for the primary schools in 2017 to 2018 to week 15 2018, compared to the previous
season
* *For the majority of NHS health board, the uptake includes data obtained from general practices on the number of children
vaccinated in schools.
**NHS Health boards include: Ayrshire & Arran (AA), Borders (BR), Dumfries & Galloway (DG), Fife (FF), Forth Valley (FV),
Greater Glasgow & Clyde (GGC), Grampian (GR), Highland (HG), Lanarkshire (LN), Lothian (LO), Orkney (OR), Shetland
(SH), Tayside (TY), Western Isles (WI).
43You can also read