Microstructural Evaluation and Corrosion Resistance of Semisolid Cast A356 Alloy Processed by Equal Channel Angular Pressing - MDPI

Page created by Gladys Dawson
 
CONTINUE READING
Microstructural Evaluation and Corrosion Resistance of Semisolid Cast A356 Alloy Processed by Equal Channel Angular Pressing - MDPI
metals
Article
Microstructural Evaluation and Corrosion Resistance
of Semisolid Cast A356 Alloy Processed by Equal
Channel Angular Pressing
Mohamed Abdelgawad Gebril 1,2 , Mohd Zaidi Omar 1, * , Intan Fadhlina Mohamed 1,3 and
Norinsan Kamil Othman 4
 1   Centre for Materials Engineering and Smart Manufacturing, Universiti Kebangsaan Malaysia,
     43600 UKM Bangi, Malaysia; gebril.ukm@gmail.com (M.A.G.); intanfadhlina@ukm.edu.my (I.F.M.)
 2   Department of Mechanical Engineering, Faculty of Engineering, Benghazi University, 16063 Benghazi, Libya
 3   Fuel Cell Institute, Universiti Kebangsaan Malaysia, 43600 UKM Bangi, Malaysia
 4   Department of Applied Physics, Faculty of Science and Technology, Universiti Kebangsaan Malaysia,
     43600 UKM Bangi, Malaysia; insan@ukm.edu.my
 *   Correspondence: zaidiomar@ukm.edu.my; Tel.: +603-8921-4831
                                                                                                     
 Received: 21 December 2018; Accepted: 4 February 2019; Published: 8 March 2019                      

 Abstract: As-cast and semisolid casting using a cooling slope A356 alloy were processed by
 equal channel angular pressing (ECAP) for Si and grain refinement. The ECAP was conducted
 at room temperature in a mold, with a channel angle of 120◦ , and this resulted in a significant
 size reduction of grain and Si particles from 170.5 and 4.22 to 23.12 and 0.71 µm, respectively,
 after six passes of heat-treated cooling slope casting, using the ECAP process. The hardness
 increased with ECAP processing, from 61 HV, for the as-cast alloy, to 134 Hv, after six passes
 of heat-treated cooling slope casting. The corrosion resistance of the alloy improved, from 0.042 to
 0.0012 mmy−1 , after the ECAP process. In this work both the strength and corrosion resistance of the
 ECAPed A356 alloys were improved with the application of the cooling slope process than without
 (i.e., from the as-cast condition).

 Keywords: A356 alloy; cooling slope; ECAP; hardness; pitting corrosion

1. Introduction
     A356 alloy is an Al–Si casting alloy that contains ~7 wt.% Si, mostly developed for automotive
powertrain components such as the engine block and automotive transmission cases. However,
the solubility limitation of silicon (Si) in aluminum (Al) contributes to the precipitation of flake-shaped
Si particles with sharp edges, which significantly affects the mechanical and electrochemical properties.
     The coarse flake Si particles can cause the initiation of premature cracks during deformation.
Consequently, this shape weakens the workability of the alloy at room temperature, thus reducing
the ductility of the alloy [1]. The morphology of Si particles and its distribution play essential roles in
the electrochemical properties of Al–Si alloy. The cathodic behavior of Si within the Al-rich matrix
contributes to the occurrence of localized corrosion, with the formation of microgalvanic couples [2,3],
which also leads to poor mechanical behavior, such as in stent applications [4]. The reduction in the
area ratio of noble Si particles (cathode) to less-noble eutectic Al phase (anode) around Si particles
largely improves pitting corrosion resistance. In other words, the reduction in the area ratio of cathode
to anode (Ac/Aa) reduces the corrosion current density. In the Al–Si alloy, the size reduction of Si
particles which as cathode, facilitates the re-passivation of protective film with improved stability [5–7].
     Since the corrosion resistance and strength of alloys are mostly influenced by their
microstructure [8–10], there are various methods to refine the microstructure of unmodified A356 alloy

Metals 2019, 9, 303; doi:10.3390/met9030303                                     www.mdpi.com/journal/metals
Microstructural Evaluation and Corrosion Resistance of Semisolid Cast A356 Alloy Processed by Equal Channel Angular Pressing - MDPI
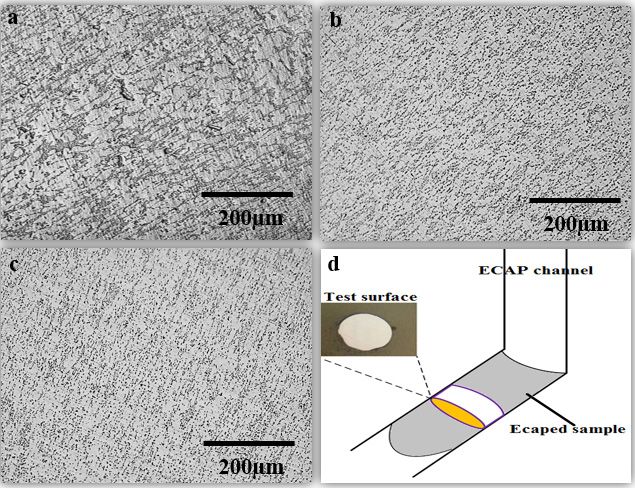
Metals 2019, 9, 303                                                                                  2 of 15

in order to improve the corrosion resistance and mechanical properties, such as heat treatment [11–13]
and semisolid state processing to obtain a spherical microstructure using mechanical stirring,
electromagnetic stirring, and controlled nucleation methods [14–16]. The cooling slope casting process
is also considered as another simple method of the semisolid metal casting process to produce feedstock
material, with a spheroid microstructure, which bears minimal equipment and operational costs [17–19].
The severe plastic deformation (SPD) technique effectively accommodates the combination of major
grain refinement and Hall-Petch strengthening in bulk billets, where the working piece is subjected to
extensive strains of cold or warm processing. Fundamentally, the SPD technique is eminently capable
of effectively refining the structure of grain down to an ultrafine micrometer-scale or nano-scale
due to the agglomeration of dislocation, which leads to the formation of subgrains. In particular,
this technique enables various metals and metallic alloys that are brittle and ductile to achieve the
structure of refined grain [20–22].
      The equal channel angular pressing (ECAP) of SPD the technique is considered the most effective
technique in fabricating bulk ultrafine-grained materials [23]. Some researchers have applied several
methods of SPD to Al–Si alloy to improve the corrosion resistance of the alloy through microstructural
refinement. In one study, [24,25] it was concluded that the improvement of the corrosion resistance
and mechanical properties of pure aluminum and A356 alloy was due to microstructure refinement.
In another study, the effect of ECAP processing on the corrosion resistance of Al—11wt.% Si [26], it was
reported that the great refinement of both the matrix microstructure and the Si particles after severe
plastic deformation leads to an improvement of the corrosion resistance.
      In another research [27] on the Anticorrosion behavior of ultrafine-grained Al—26 wt.% Si alloy
fabricated by ECAP, it was reported that the improvement of ECAPed Al—26 wt.% Si alloy corrosion
resistance results from the homogeneous ultrafine structure, with the breakage of brittle large primary
silicon crystals. SPD processing improves the corrosion resistance and mechanical properties of Al–Si
alloy [28].
      However, the reduction of both grain size and eutectic Si particles through the deformation
process may alter the corrosion property of the alloy [10,29,30]. Addressing these issues, the present
study aimed to refine Si particles and to produce material with a uniform microstructure through the
combination of the cooling slope casting process and ECAP processing at room temperature. The effect
of T6 heat treatment was studied to determine the microstructure changes after ECAP processing.
This study further examined the effects of microstructure changes and its effect on strength as well as
corrosion resistance for both ECAPed as-cast and ECAPed cooling slope-cast A356 alloy.

2. Materials and Methods
     This study used cast commercial A356 (Si—7 wt.%, Mg—0.149 wt.%, Fe—0.126 wt.%,
Cu—0.01 wt.%, Mn—0.002 wt.%, Zn—0.006 wt.%, Cr—0.001 wt.%, Ti—0.178 wt.%) alloy casted
in ingot, with initial dimensions of 80 mm × 40 mm × 140 mm (width × thickness × length).
Using a graphite crucible, the as-cast was melted at a temperature of 750 ◦ C. For the cooling slope
casting process, the cooling slope of stainless steel, with a slope length of 250 mm as well as a tilt angle
of 60◦ , was used. The reason for selecting these conditions was based on our work [31]. The apparatus
used for this process is shown in Figure 1a. This study specifically selected 620 ◦ C as the pouring
temperature to limit the superheating of the melt [31]. The molten metal was poured downward,
on a stainless steel slope, into a mold with a vertical surface, before quenching in water. In line
with the T6 procedure, this study performed a heat treatment process to the as-cast and cooling
slope-cast samples, which involved the following processes in this order: (1) an eight-hour sequence of
solution treatment at 540 ◦ C, (2) water quenching, and (3) three-hour aging process at a temperature
of 180 ◦ C [32]. Following that, as illustrated in Figure 1b, as-cast and cooling slope-cast samples
were machined into a rod shape, with a diameter of 9.8 mm. The samples were ECAPed in a die
with a channel angle of 120◦ , following route A (where the sample is not rotated between each pass).
It should be noted that molybdenum disulfide (MoS2 ) grease was used as a lubricant in this study.
Microstructural Evaluation and Corrosion Resistance of Semisolid Cast A356 Alloy Processed by Equal Channel Angular Pressing - MDPI
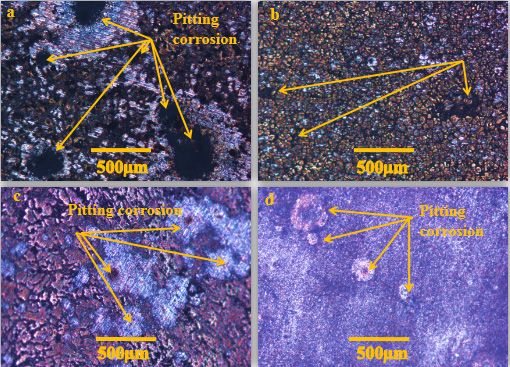
Metals 2018, 8, x FOR PEER REVIEW                                                                                      3 of 16

   that, as illustrated in Figure 1b, as-cast and cooling slope-cast samples were machined into a rod
  shape,
Metals 2019,with
            9, 303a diameter of 9.8 mm. The samples were ECAPed in a die with a channel angle of 120°,
                                                                                                   3 of 15
  following route A (where the sample is not rotated between each pass). It should be noted that
  molybdenum disulfide (MoS2) grease was used as a lubricant in this study. The pressing of as-cast
The pressing
  and  cooling of  as-cast and
                slope-cast A356cooling  slope-cast
                                 alloy samples wasA356     alloy
                                                     carried  out samples  was carried
                                                                  using a 50-ton       outpress.
                                                                                 hydraulic  usingAs-cast
                                                                                                  a 50-ton
hydraulic  press.  As-cast  samples  were pressed   up to  four passes, without  any cracks on the
  samples were pressed up to four passes, without any cracks on the surface while the cooling slopesurface
while the samples
  casting cooling slope   casting samples
                    were successfully      were
                                      pressed to successfully
                                                 six passes. pressed to six passes.

                           Figure1.1.Schematic
                          Figure      Schematic of
                                                of (a)
                                                   (a) cooling
                                                       cooling slope
                                                               slope casting
                                                                     castingand
                                                                             and(b)
                                                                                 (b)ECAP
                                                                                     ECAPmold.
                                                                                          mold.

        Both
      Both     ECAPedsamples
             ECAPed        sampleswere  weresubsequently
                                               subsequently examined
                                                                examinedunder underaafield fieldemission
                                                                                                  emissionscanning
                                                                                                               scanning    electron
                                                                                                                             electron
   microscope      (FESEM,       Zeiss,    Oberkochen,       Germany)      and    optical     microscope
microscope (FESEM, Zeiss, Oberkochen, Germany) and optical microscope (OM, Olympus corporation,                (OM,      Olympus
   corporation,
Tokyo,   Japan). Tokyo,      Japan). an
                    Additionally,        Additionally,    an energy
                                            energy dispersive          dispersive
                                                                    x-ray   (EDX) x-ray
                                                                                      (equipped(EDX)to(equipped
                                                                                                         FESEM) was    to FESEM)
                                                                                                                             used for
   was  used   for  elemental     analysis.   A   Vickers   hardness    tester  (micro     Vickers
elemental analysis. A Vickers hardness tester (micro Vickers hardness tester, Zwick, Germany; ZHVµ)  hardness      tester,  Zwick,
wasGermany;
      used to ZHVµ)
                measure   wastheused    to measure
                                    hardness          theaverage
                                                 of the    hardnessofofthree
                                                                         the average
                                                                                samples   of per
                                                                                              threecase.
                                                                                                     samples
                                                                                                           These persamples
                                                                                                                      case. Thesewere
   samples were also prepared for microstructure analysis using silicon carbide (SiC) papers of grit
also prepared for microstructure analysis using silicon carbide (SiC) papers of grit between 180 and
   between 180 and 2000, followed by a polishing process using 3 µm and 1 µm of diamond paste
2000, followed by a polishing process using 3 µm and 1 µm of diamond paste (Al2 O3 ). Meanwhile,
   (Al2O3). Meanwhile, an etching process was performed using Keller’s reagent (1% HF, 1.5% HCl, 2.5%
an etching process was performed using Keller’s reagent (1% HF, 1.5% HCl, 2.5% HNO3 , H2 O solution)
   HNO3, H2O solution) as an etchant. This study performed quantitative metallography analysis to
as an etchant. This study performed quantitative metallography analysis to measure the grain size,
   measure the grain size, according to the ASTM E112 standard. The size of Si particles (the width and
according
   length oftoparticles)
                the ASTM   was  E112   standard.
                                  measured     using The
                                                       thesize of SiTiffv2
                                                            Smart     particles   (the width
                                                                            software,             and length
                                                                                          considering     at leastof200
                                                                                                                     particles)   was
                                                                                                                          particles
measured     using    the Smart      Tiffv2  software,    considering     at least   200   particles
   in each case. Following that, an electrochemical experiment was performed in naturally aerated 3.5% in  each   case.    Following
that, an electrochemical
   NaCl   solution at room experiment
                                 temperature,was  with performed
                                                          pH 6.5. Ain   naturally aerated
                                                                      potentiostat     GAMRY3.5%        NaCl
                                                                                                   3.2 was       solution
                                                                                                              used            at room
                                                                                                                      to measure
temperature,      with   pH    6.5.   A   potentiostat     GAMRY      3.2  was    used    to  measure      the
   the rate of corrosion (characterized by icorr) of these samples. For this, a three-electrode cell was used,   rate   of  corrosion
(characterized
   which comprised by icorr
                         of )(1)
                               of test
                                   these   samples.
                                        material   (as For   this, a electrode),
                                                        a working    three-electrode        cell was
                                                                                    (2) graphite    (asused,    which
                                                                                                        a counter         comprised
                                                                                                                        electrode),
of and
   (1) test
        (3) material
             a silver or(as   a working
                           silver    chlorideelectrode),
                                                (Ag or AgCl)(2) graphite
                                                                  electrode(as(asa acounter
                                                                                      reference electrode),
                                                                                                   electrode). and The(3)potential
                                                                                                                           a silver or
silver chloride    (Ag   or  AgCl)     electrode    (as a  reference   electrode).    The    potential
   dynamic polarization tests were performed at a scanning rate of 1 mV s 1 with a range from −250 mV
                                                                                              -           dynamic       polarization
tests wereopen
   versus    performed       at a scanning
                  circuit potential     (OCP) rate
                                                to theoffinal
                                                         1 mV   s−1 with
                                                              potential     a range
                                                                         of 250         from −
                                                                                 mV versus        250 mV
                                                                                                 OCP.   The versus       open circuit
                                                                                                              potentiodynamic
   tests were
potential  (OCP)started   after
                     to the      about
                              final       15 minofof250
                                      potential        immersion
                                                           mV versus in 3.5%
                                                                         OCP.NaCl.       Immersion tests were
                                                                                The potentiodynamic             tests performed
                                                                                                                        were started
   during
after about14 15
               days
                  min in 3.5 wt.% NaCl naturally
                         of immersion                    aeratedImmersion
                                             in 3.5% NaCl.        solution to tests
                                                                                studywerethe surface   appearance.
                                                                                                performed      duringBasically,
                                                                                                                           14 days in
   each  sample     was    mounted       in epoxy     that  was   aired   for  24   hours.
3.5 wt.% NaCl naturally aerated solution to study the surface appearance. Basically, each     Finally,   these    samples     were
                                                                                                                         sample   was
   smoothened
mounted            usingthat
            in epoxy      up to was1200-grit
                                      aired forSiC24before
                                                      hours. each  corrosion
                                                               Finally,  thesetest.
                                                                                 samples were smoothened using up to
1200-grit SiC before each corrosion test.
Microstructural Evaluation and Corrosion Resistance of Semisolid Cast A356 Alloy Processed by Equal Channel Angular Pressing - MDPI
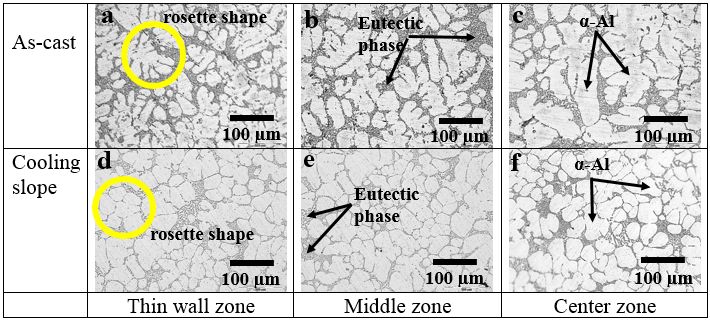
Metals 2019, 9, 303                                                                                               4 of 15
Metals 2018, 8, x FOR PEER REVIEW                                                                                4 of 16

3. Results and Discussion

3.1. The Effect of Cooling Slope
     Figure 2 shows the microstructure of the as-cast A356 alloy sample, before and after the cooling
slope casting process. Typically,
                       Typically, the primary α-Al phase (bright phase), which is surrounded by
eutectic phase (dark phase), is formed during the initial solidification
                                                          solidification phase.
                                                                         phase.

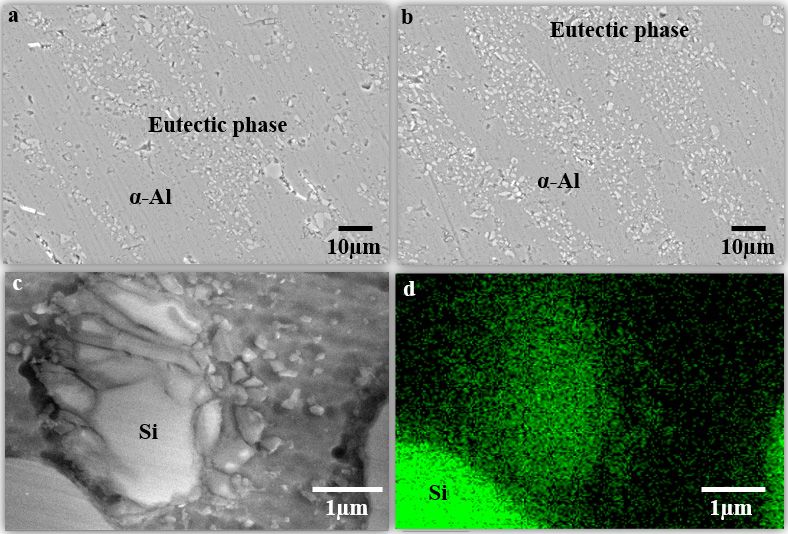
     Figure 2. Microstructure  of as-cast (a–c) and
                     Figure 2. Microstructure       cooling
                                                of as-cast   slope
                                                           and      casting
                                                                cooling     samples
                                                                        slope casting(d–f). (a) coarse dendritic
                                                                                      samples.
     and rosette shape of α-Al phase at thin wall zone; (b) and (c) dendritic shape in the middle and center
     The morphology
     zone                of primary
          in as-cast samples;         α-Al
                              (d) rosette    phase
                                           shape     in three
                                                 of α-Al  phasezones  was
                                                                 at thin    found
                                                                         wall zone;to
                                                                                    (e)be mostly
                                                                                        and        dendritic
                                                                                             (f) nearly       for the
                                                                                                        globular
     shape
as-cast    at the before
        sample,   middle the
                          and cooling
                              in the center
                                        slopezone of cooling
                                               casting        slopeas
                                                         process,   samples.
                                                                       displayed in Figure 2a–c. However, the
evolution of the coarsen dendritic to finer dendritic could be observed from the center zones
      The morphology of primary α-Al phase in three zones was found to be mostly dendritic for
approaching the thin wall zone. The variation in cooling rate depends on the location in the mold
the as-cast sample, before the cooling slope casting process, as displayed in Figure 2a–c. However,
and affects the morphology of the primary α-Al phase. Considering that the mold itself has a
the evolution of the coarsen dendritic to finer dendritic could be observed from the center zones
relatively low initial temperature, the cooling rate is more rapid near the wall of the mold, thus
approaching the thin wall zone. The variation in cooling rate depends on the location in the mold and
leading to the nucleation of numerous grains of random orientations in the thin wall zone area [33].
affects the morphology of the primary α-Al phase. Considering that the mold itself has a relatively
During the pouring of molten alloy, the presence of forced convection detaches the dendritic arms
low initial temperature, the cooling rate is more rapid near the wall of the mold, thus leading to the
that developed in the thin wall zone area. However, the dendrites start to form in the middle zone
nucleation    of numerous
due to the lower     cooling grains
                                rates inofthis
                                            random     orientations
                                               zone. They             in the
                                                             later grew   andthin  wall ripened
                                                                               become    zone area as [33].
                                                                                                      coarse During   the
                                                                                                               dendrites
pouring    of molten   alloy,  the  presence   of forced  convection
as a result of the lowest cooling rate in this center zone [34].        detaches  the dendritic   arms  that  developed
in theThe
        thinnon-dendritic
              wall zone area.      However, the of
                               microstructures      dendrites   startA356
                                                      the as-cast     to form  in theafter
                                                                           sample,    middle
                                                                                           the zone   dueslope
                                                                                                 cooling    to thecasting
                                                                                                                   lower
cooling
process,rates   in thisinzone.
           are shown       Figure They  later
                                     2d–f.     grew and
                                           However,        become ripened
                                                        in particular,         as coarse dendrites
                                                                        the morphology                as a result
                                                                                           of the primary          of the
                                                                                                             α-Al phase
lowest   cooling   rate in this   center zone   [34].
in the thin wall zone appeared rosette-like Figure 2d and almost globular-like in the middle zone and
centerThe   non-dendritic
         zone  Figure 2e–f. microstructures
                               In the center zone, of the
                                                       the primary
                                                           as-cast A356    sample,
                                                                     α-Al phase   wasafter the to
                                                                                       found     cooling  slopethan
                                                                                                   be coarser     casting
                                                                                                                     that
process,  are  shown    in Figure    2d–f. However,     in particular,  the morphology     of the
in the middle zone. This may be because the temperature gradient across these three sections duringprimary   α-Al  phase
in the thin wall
solidification      zone appeared
                 contributes     to therosette-like
                                         variation inFigure   2d and almost
                                                        the morphology      andglobular-like
                                                                                 size of the in   the middle
                                                                                               primary   α-Al zone
                                                                                                                phaseand
                                                                                                                       in
center  zone zones.
these three    FigureThe2e–f.slowest
                               In the center
                                       coolingzone,
                                                 rate the  primary
                                                      in the          zonephase
                                                              centerα-Al    allowswas
                                                                                    thefound    to be coarser
                                                                                        α-Al phase    to growthan    that
                                                                                                                 courser,
in
as the
   the middle
        cooling zone.
                  time isThis   may be because the temperature gradient across these three sections during
                           prolonged.
solidification contributes to the variation in the morphology and size of the primary α-Al phase in
these  three
3.2. The  Heatzones.   The slowest
                Treatment    Solution cooling rate in the center zone allows the α-Al phase to grow courser,
as the cooling time is prolonged.
      Alloy A356 is a heat-treatable hypoeutectic Al–Si alloy. Figure 3a–b shows optical micrographs
of the
3.2. Theboth
          Heatthe  primarySolution
                Treatment     α-Al phase and the eutectic Si particles in both alloy samples, before the heat
treatment process. As for the primary α-Al phase (bright phase), grains with a globular structure
      Alloy A356 is a heat-treatable hypoeutectic Al–Si alloy. Figure 3a–b shows optical micrographs of
could be observed in the cooling slope-cast alloy sample, while large grain, surrounded by coarse
the both the primary α-Al phase and the eutectic Si particles in both alloy samples, before the heat
eutectic constituents (dark phase), appeared in the as-cast alloy sample. The flake and acicular
treatment process. As for the primary α-Al phase (bright phase), grains with a globular structure could
morphology of Si particles in as-cast and in cooling slope samples were transformed into a
spheroidized shape after T6 heat treatment, as shown in Figure 3c–d. In a solution heat treatment
sample, the eutectic Si particles were fragmented and spheroidized during the coarsening processes
Microstructural Evaluation and Corrosion Resistance of Semisolid Cast A356 Alloy Processed by Equal Channel Angular Pressing - MDPI
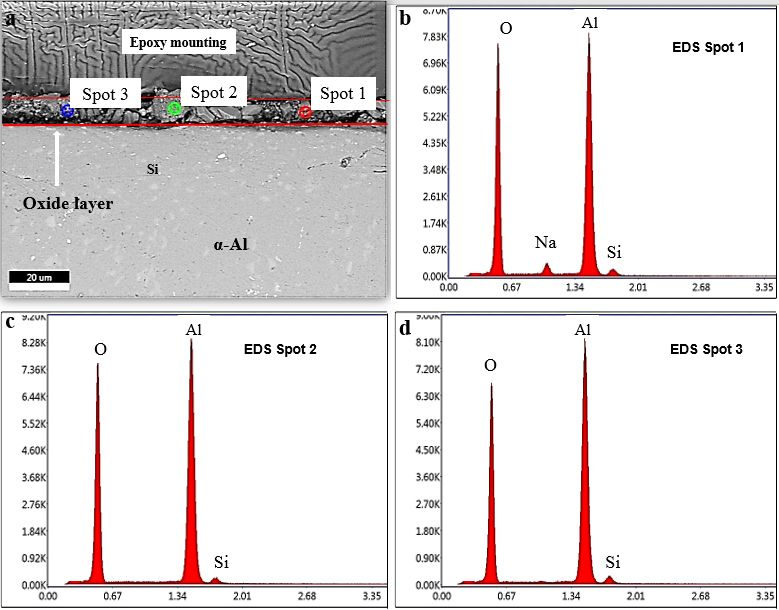
Metals 2019, 9, 303                                                                                                   5 of 15

be observed in the cooling slope-cast alloy sample, while large grain, surrounded by coarse eutectic
constituents (dark phase), appeared in the as-cast alloy sample. The flake and acicular morphology
of Si particles in as-cast and in cooling slope samples were transformed into a spheroidized shape
after T6 heat treatment, as shown in Figure 3c–d. In a solution heat treatment sample, the eutectic
Metals 2018, 8, x FOR PEER REVIEW
                                                                                                                  Si
                                                                                                             5 of 16
particles were fragmented and spheroidized during the coarsening processes [35,36]. It was observed
that theIteutectic
[35,36].              Si particles
             was observed          were
                              that the    refinedSiand
                                        eutectic        had fewer
                                                    particles        sharp angles
                                                              were refined          edges,
                                                                              and had  fewerassharp
                                                                                               in theangles
                                                                                                      as-castedges,
                                                                                                              alloy
before   heat   treatment.  The  same   behavior  was   reported  by  previous  studies, which   found
as in the as-cast alloy before heat treatment. The same behavior was reported by previous studies,      that the T6
heat treatment
which    found that process initiated
                       the T6          the spheroidization
                               heat treatment                 of Si particles
                                                 process initiated            [37,38], but aof
                                                                     the spheroidization     considerable
                                                                                               Si particles amount
                                                                                                            [37,38],
of acicular   shapes   remained    after the T6  heat treatment   process.
but a considerable amount of acicular shapes remained after the T6 heat treatment process.

      Figure
      Figure 3.3.Microstructure of eutectic
                   Microstructure           phase:
                                    of eutectic    (a) as-cast,
                                                phase:          (b) cooling
                                                          (a) as-cast,  (b) slope,
                                                                            cooling(c) slope,
                                                                                       as-cast-T6
                                                                                              (c) and (d) cooling
                                                                                                  as-cast-T6 and
      slope-T6.
      (d) cooling slope-T6.

3.3. Process
3.3. Process of
             of ECAP
                ECAP

      The microstructures of the as-cast-T6 and cooling slope-cast-T6 alloy samples, subjected to four
passes of route A, were displayed in Figure 4a–b. Meanwhile, following route A, the microstructure
    coolingslope-cast-T6
of cooling     slope-cast-T6alloy
                                alloy  samples,
                                     samples,      which
                                                which  waswas     subjected
                                                             subjected    to sixtopasses
                                                                                    six passes   of ECAP,
                                                                                           of ECAP,          is shown
                                                                                                      is shown   in Figurein
Figure
4c.  The 4c.   The primary
          primary    α-Al phaseα-Al  phase
                                   and       andconstituents
                                        eutectic   eutectic constituents     were elongated
                                                                 were elongated                   into shapes
                                                                                      into plate-like   plate-like
                                                                                                                for shapes
                                                                                                                    the as-
for the
cast      as-cast
      alloy        alloy
              sample      sample
                        [39],      [39], but fibrous-like
                              but fibrous-like              shapes,
                                                  shapes, for          for the
                                                                the latter       latter samples.
                                                                             samples.     As shown As in
                                                                                                       shown
                                                                                                          Tablein1,Table
                                                                                                                     the Si1,
the Si particles
particles           and eutectic
            and eutectic            phase appeared
                           phase appeared               to be
                                               to be finer     finer as-cast
                                                           in both    in bothand as-cast  andslope-cast
                                                                                     cooling    cooling slope-cast    alloy
                                                                                                           alloy samples,
samples,     after ECAP    processing.   Due   to ECAP    processing,    the  distribution    was
after ECAP processing. Due to ECAP processing, the distribution was observed to be more uniform     observed   to be  more
uniform
in          in theslope-cast
    the cooling     cooling slope-cast    alloy sample.
                                alloy sample.    The resultThe   result determined
                                                              determined      agrees withagreesourwith  our study,
                                                                                                   earlier  earlier which
                                                                                                                     study,
which
reported reported    that refine
             that refine          Si particles
                           Si particles   werewere    observed
                                                  observed         through
                                                              through     thethe    cooling
                                                                                cooling      slope
                                                                                          slope     castingofofalloy
                                                                                                  casting        alloy [40].
                                                                                                                        [40].
Nonetheless,     the  spheroidization    and  fragmentation    of  Si particles   in this study
Nonetheless, the spheroidization and fragmentation of Si particles in this study were acquired   were   acquired   through
the T6 heat
through    thetreatment     process, coupled
                T6 heat treatment     process, with   the ECAP
                                                 coupled   with the process.
                                                                      ECAP process.
Microstructural Evaluation and Corrosion Resistance of Semisolid Cast A356 Alloy Processed by Equal Channel Angular Pressing - MDPI
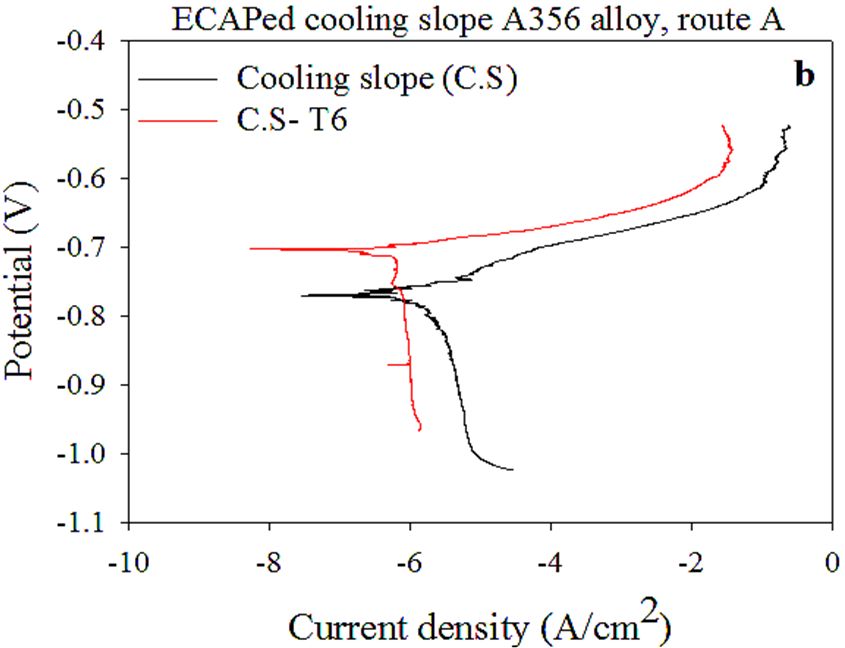
Metals 2019, 9, 303                                                                                                           6 of 15
Metals 2018, 8, x FOR PEER REVIEW                                                                                             6 of 16

       Figure 4. Microstructure
                    Microstructure of  of ECAPed-T6
                                           ECAPed-T6A356 A356alloy
                                                                 alloy(a)
                                                                       (a)as-cast
                                                                           as-castafter
                                                                                   after4 4passes,
                                                                                            passes,(b)
                                                                                                    (b)cooling
                                                                                                        coolingslope
                                                                                                                 slopeafter 4
                                                                                                                        after
      4passes,
         passes,(c)(c)cooling
                        coolingslope
                                 slopeafter
                                        after6 6passes
                                                 passesand
                                                        and(d)
                                                             (d)surface
                                                                  surfaceofofmicroscopic
                                                                              microscopicECAPed
                                                                                            ECAPedsample.
                                                                                                      sample.

      Based on onthe
                   themicrostructures
                         microstructures   of both   samples,
                                                of both         following
                                                           samples,          route A,route
                                                                         following         the refining
                                                                                                   A, theand      the distribution
                                                                                                               refining     and the
of both primary
distribution        the primary
               of both    α-Al phasethe and
                                         α-Aleutectic    constituents
                                                 phase and                 in the ECAPed
                                                              eutectic constituents               cooling
                                                                                             in the  ECAPed   slope-cast
                                                                                                                    coolingsample
                                                                                                                               slope-
became    more  homogeneous.        Thus,   the  microstructure     changes     may     lead
cast sample became more homogeneous. Thus, the microstructure changes may lead to changes in   to changes      in  the   mechanical
and  electrochemical
the mechanical     and properties     of the properties
                          electrochemical      alloy [28,41–43].
                                                             of theThis
                                                                     alloyis [28,41–43].
                                                                              due to the reduction
                                                                                               This is due   and todistribution
                                                                                                                     the reduction of
cathodic   to anodicofphases.
and distribution        cathodic Thetostraining    led to the
                                        anodic phases.      Theformation
                                                                  strainingofled dislocated       cell structures,
                                                                                      to the formation                   with a high
                                                                                                               of dislocated      cell
dislocation
structures, density.
             with a highThe dislocation
                             dislocation remains
                                            density. within    the cell structures,
                                                       The dislocation      remains which withindo thenot
                                                                                                        cellaffect   the remaining
                                                                                                               structures,    which
cell boundaries
do not   affect theorremaining
                      develop walls cell that  separateor
                                          boundaries      these   cells into
                                                             develop     wallssmaller      cells. However,
                                                                                 that separate       these cells  persistent    shear
                                                                                                                       into smaller
straining  processes
cells. However,        may leadshear
                    persistent     to a saturated
                                           strainingdislocation
                                                       processesdensity
                                                                     may lead within to these    cell structures,
                                                                                          a saturated      dislocation which    could
                                                                                                                             density
be significantly
within   these cellreduced    through
                      structures,    which(i) enhanced
                                              could be dynamic         recovery
                                                           significantly    reduced (which      would
                                                                                          through      (i)stabilize
                                                                                                           enhanced     thedynamic
                                                                                                                            creation
and   annihilation
recovery            of dislocations)
           (which would                  andcreation
                             stabilize the     (ii) the conversion      of cellsoftodislocations)
                                                         and annihilation              well-definedand   grains     (which
                                                                                                              (ii) the        would
                                                                                                                         conversion
cause   severe  movement       of cell interior    dislocations    to cell  boundaries).
of cells to well-defined grains (which would cause severe movement of cell interior dislocations In fact,   this   suggested     that
                                                                                                                                   to
the
cell process  of grain
     boundaries).        refinement
                     In fact,          dependsthat
                               this suggested       on the
                                                        thelevel   of straining
                                                             process    of grain or      in other words,
                                                                                    refinement       depends    theongeneration
                                                                                                                         the level of
dislocations
straining or in[44–46].
                  other words, the generation of dislocations [44–46].

3.4. Scanning Electron
3.4. Scanning Electron Microscope
                       Microscope (FESEM)
                                  (FESEM)
     Table
     Table 11shows
              showsthe the  grain
                         grain     refinement
                                refinement    andand   Si particles
                                                  Si particles        fragmentation
                                                                fragmentation          after processing.
                                                                                after ECAP    ECAP processing.
                                                                                                          Figure
Figure  5a–b  shows   the  scanning    electron  microscope      (SEM)   micrographs
5a–b shows the scanning electron microscope (SEM) micrographs of the ECAPed as-cast     of the ECAPed     as-cast
                                                                                                     and cooling
and cooling
slope-cast   slope-cast
           samples.  Thesamples.    Theappeared
                           Si particles   Si particles appeared
                                                    finer          finer in the
                                                           in the ECAPed        ECAPed
                                                                            cooling slopecooling
                                                                                            than inslope than in
                                                                                                    the ECAPed
the ECAPed    as-cast.  With  the continuous    passes,   the  Si particles and eutectic  mixture
as-cast. With the continuous passes, the Si particles and eutectic mixture were broken down and    were  broken
down   and fragmented
fragmented               into finerasparticles,
             into finer particles,    shown in  asFigure
                                                   shown5c–d.
                                                            in Figure 5c–d.
Metals 2019, 9, 303                                                                                       7 of 15
Metals 2018, 8, x FOR PEER REVIEW                                                                        7 of 16

                  Table
                  Table 1.
                        1. Average
                           Average size of grain
                                   size of grain size
                                                 size and
                                                      and Si
                                                          Si particles
                                                             particles before
                                                                       before and
                                                                              and after
                                                                                  after ECAP.
                                                                                        ECAP.

                              Samples                     Si Size (µm)      Grain Size (µm)
                              Samples                  Si Size (µm)        Grain Size (µm)
                               As-cast                         4.22              170.51
                             As-cast                       4.22                 170.51
                   ECAPedas-cast-T6,
                   ECAPed    as-cast-T6,  4 passes
                                       4 passes               0.761
                                                           0.761                  40.40
                                                                                 40.40
                          Cooling
                         Cooling     slope
                                  slope                    3.013.01               53.55
                                                                                 53.55
                 ECAPed cooling
                 ECAPed  coolingslope-T6, 4 passes
                                   slope-T6,  4 passes     0.740.74             29.34
                                                                                  29.34
                 ECAPed cooling slope-T6, 6 passes         0.71                 23.12
                 ECAPed cooling slope-T6, 6 passes             0.71               23.12

     Figure 5.
     Figure 5. FESEM
               FESEM images:
                     images: Si
                             Si particles
                                particles morphology
                                          morphology after
                                                     after ECAP
                                                           ECAP (a)
                                                                (a) as-cast,
                                                                    as-cast, (b)
                                                                             (b) cooling
                                                                                 cooling slope,
                                                                                         slope, (c)
                                                                                                (c) and
                                                                                                    and (d)
                                                                                                        (d)
     SEM and mapping of Si fragmentation of ECAPed sample.
                                                      sample.

3.5. Hardness
3.5. Hardness
      Figure  6ashows
      Figure 6a  showsthetheVickers
                              Vickersmicrohardness
                                       microhardness of of  as-cast
                                                         as-cast andand   cooling
                                                                      cooling      slope
                                                                               slope       samples,
                                                                                     samples,         measured
                                                                                                measured   after
after
a combination of heat treatment and ECAP processing via route A. It shows that the hardness
      a combination   of heat  treatment  and   ECAP   processing   via route  A. It shows    that the hardness
increased   from 61
increased from    61 HV
                     HV toto 125
                              125 and
                                   and 129
                                       129 Hv,
                                            Hv, after
                                                 after four
                                                       four passes
                                                             passes of
                                                                     of ECAPed
                                                                         ECAPed as-cast
                                                                                   as-cast and
                                                                                             and cooling
                                                                                                  cooling slope
                                                                                                          slope
samples,  respectively.  After  six passes, the as-cast sample   failed to reach  six passes,   without
samples, respectively. After six passes, the as-cast sample failed to reach six passes, without surface surface
cracks, while the
cracks, while  the cooling
                   cooling slope
                            slope sample
                                   sample successfully
                                           successfully reached
                                                         reached six
                                                                  six passes,
                                                                       passes, with
                                                                               with aa 134
                                                                                       134 HV
                                                                                            HVmicrohardness.
                                                                                                 microhardness.
After
After heat treatment, the microhardness was enhanced for the as-cast and cooling slope samples
       heat treatment,  the microhardness     was enhanced    for the  as-cast and  cooling   slope          by
                                                                                                     samples by
26%   and 36%,  respectively.
26% and 36%, respectively.
Metals 2019, 9, 303                                                                                                           8 of 15
   Metals 2018, 8, x FOR PEER REVIEW                                                                                      8 of 16

         Figure
      Figure   6. 6.
                  (a)(a)Effect
                         EffectofofT6
                                    T6heat
                                       heattreatment
                                            treatment and
                                                      and ECAP process
                                                                processon
                                                                       onhardness
                                                                          hardnessofofA356
                                                                                       A356alloy and
                                                                                             alloy   (b)(b)
                                                                                                   and   Mapping
                                                                                                            Mapping
         of silicon  particles   distribution  in ECAPed
      of silicon particles distribution in ECAPed samples.samples.

      TheThe  spheroidizationofofeutectic
            spheroidization             eutecticSiSiafter
                                                     after T6T6 heat treatment
                                                                       treatmentwas  wasfound
                                                                                           foundtotoincrease
                                                                                                        increase the
                                                                                                                   thehardness
                                                                                                                        hardness of of
   samples.   Essentially,     the  spheroidization      of  Si particles  after  T6  heat  treatment,
samples. Essentially, the spheroidization of Si particles after T6 heat treatment, and the precipitation ofand the  precipitation
   of magnesium
magnesium             silicide
                silicide   (Mg(Mg     2Si) particles during the aging process, tend to increase the ultimate tensile
                                 2 Si) particles during the aging process, tend to increase the ultimate tensile
   strength   as  well  as  hardness
strength as well as hardness [47,48].    [47,48].
         Since   shear    force   could
      Since shear force could break        break down
                                                   down the the dendrite
                                                                  dendrite arms
                                                                              arms of of the
                                                                                          theα-Al
                                                                                                α-Alphase,
                                                                                                       phase,leading
                                                                                                                 leading  to to
                                                                                                                              grain
                                                                                                                                grain
   refinement, its microstructure in the rheocasting condition became smaller and denser, where the
refinement, its microstructure in the rheocasting condition became smaller and denser, where the
   rheocast sample recorded the highest microhardness, compared to the as-cast sample [12], as well as
rheocast sample recorded the highest microhardness, compared to the as-cast sample [12], as well as
   a change in the morphology of Si particles, from a flake shape in the as-cast to acicular shapes in the
a change in the morphology of Si particles, from a flake shape in the as-cast to acicular shapes in the
   cooling slope, which contributed to the microhardness of A356 alloy, as mentioned in Section 3.2.
cooling slope, which contributed to the microhardness of A356 alloy, as mentioned in Section 3.2.
         Four passes of ECAPed-T6 for the as-cast and cooling slope casting samples increased the
      Four passes of ECAPed-T6 for the as-cast and cooling slope casting samples increased the hardness
   hardness of both samples due to the fragmentation of globular heat-treated eutectic Si particles, the
of both  samples
   reduction         due to
               in grain        theand
                           size,    fragmentation
                                        increase in theof globular
                                                            density ofheat-treated
                                                                          dislocations.eutectic     Si particles,
                                                                                          High strain,     induced thethrough
                                                                                                                        reduction
                                                                                                                                six in
grain  size,within
   passes    and increase
                     the coolingin the   density
                                     slope         of dislocations.
                                              sample   during the process High strain,
                                                                                 of ECAP, induced     through
                                                                                               increases    both six
                                                                                                                  the passes   within
                                                                                                                       dislocation
thedensity
    coolingandslopegrain refinement as well as the fragmentation of eutectic Si particles, which led tograin
                       sample     during    the  process    of  ECAP,    increases    both  the   dislocation   density    and    a
refinement    as well as theinfragmentation
   greater improvement             hardness, which    of is
                                                         eutectic
                                                            in line Si  particles,
                                                                     with            which[39,49,50].
                                                                            other studies     led to a greater improvement in
hardness,Thewhich     is in linedistribution
              homogenous           with otherofstudies       [39,49,50].
                                                    fragmented      eutectic Si particles and primary α-Al phase of the
      The   homogenous         distribution     of fragmented
   cooling slope-cast sample plays an integral role in improving    eutectic    Si particles
                                                                                    the hardnessand ofprimary
                                                                                                         ECAPed α-Al    phase of
                                                                                                                    materials.  Asthe
cooling
   shownslope-cast
            in Figure 4c, sample     plays an integral
                              the homogeneity                 role in improving
                                                     of the distribution               the hardness
                                                                              of the primary               of ECAPed
                                                                                                   α-Al phase              materials.
                                                                                                                and Si particles
Aswithin
    shownthe  in eutectic
                  Figure mixture          phase, for the of
                             4c, the homogeneity              microstructure
                                                                 the distribution of ECAPed        cooling slope-cast
                                                                                       of the primary         α-Al phase   sample,
                                                                                                                               and Si
   surpassed
particles       the homogeneity
            within    the eutectic of      a similarphase,
                                        mixture       distribution
                                                               for theof microstructure
                                                                          the ECAPed as-cast        sample. Figure
                                                                                               of ECAPed       cooling6b displays
                                                                                                                          slope-cast
   the EDX
sample,       map of the
          surpassed      thedistribution
                              homogeneity     of of
                                                 Si particles,
                                                    a similar after     the ECAP
                                                                  distribution       process
                                                                                  of the  ECAPed for the  cooling
                                                                                                       as-cast     slope sample.
                                                                                                                sample.     Figure 6b
   Due tothe
displays    the EDX
                 microstructural
                        map of theevolution,
                                        distributionafter
                                                        ofthe   processes after
                                                             Si particles,   of semisolid
                                                                                    the ECAP casting,   coupled
                                                                                                   process         with
                                                                                                             for the     ECAP,slope
                                                                                                                      cooling     it
   was  expected     that   the  finer  formation     and   homogeneous        distribution     of
sample. Due to the microstructural evolution, after the processes of semisolid casting, coupled withα-Al   and eutectic   mixture
   phaseit enhanced
ECAP,      was expected the mechanical       properties
                                that the finer    formation of theand
                                                                   material    [51].
                                                                       homogeneous          distribution of α-Al and eutectic
mixture phase enhanced the mechanical properties of the material [51].
  3.6. Corrosion Resistance
3.6. Corrosion Resistance
   3.6.1. Surface Morphology
3.6.1. Surface
         Figure Morphology
                 7 reveals optical micrographs of the surface morphology, before and after the processes
   of Figure
      ECAP, 7after  immersion
                reveals opticalin  3.5% NaCl solution
                                 micrographs            for tenmorphology,
                                               of the surface   days, for bothbefore
                                                                               the as-cast  and cooling
                                                                                     and after          slope- of
                                                                                                the processes
   cast samples.   Overall, the size and the  number  of pitting corrosions, as well as  large corrosion
ECAP, after immersion in 3.5% NaCl solution for ten days, for both the as-cast and cooling slope-cast    rings
   products around pits, before and after the process of ECAP, for the cooling slope-cast sample, were
samples. Overall, the size and the number of pitting corrosions, as well as large corrosion rings products
   found to be lesser than those for the as-cast sample due to reduction and redistribution of cathodic
around pits, before and after the process of ECAP, for the cooling slope-cast sample, were found to
   phases after the ECAP process. Larger localized corrosion pits were found to be noticeable, for the
be lesser than those for the as-cast sample due to reduction and redistribution of cathodic phases
   as-cast sample. The surface morphology indicated the formation of stable pitting [52], which was
after the ECAP process. Larger localized corrosion pits were found to be noticeable, for the as-cast
   attributed to a localized corrosion attack between the active particles and noble particles in a eutectic
sample. The surface morphology indicated the formation of stable pitting [52], which was attributed
   phase [53]. Essentially, the non-presence of corrosion products within the corrosion rings indicates
to that
   a localized  corrosion
         the cathodic       attackoccurs
                       reaction    between   the active
                                         on rings, whileparticles and noble
                                                           the anodic         particles
                                                                       reaction  occurs in a eutectic
                                                                                         inside       phasepit
                                                                                                the stable   [53].
Essentially, the non-presence of corrosion products within the corrosion rings indicates that the cathodic
Metals 2019, 9, 303                                                                                                   9 of 15

reaction   occurs
   Metals 2018,      on rings,
                8, x FOR        while the anodic reaction occurs inside the stable pit instead. Applied
                         PEER REVIEW                                                                      9 ofstrain
                                                                                                                16
during the ECAP process reduces the grain size and develops crystalline defects, including dislocations
   instead.
of the grainApplied
                boundary. strain
                               Anduring  theinECAP
                                  increase     both process
                                                     the areareduces
                                                              of grainthe grain size and
                                                                       boundaries     and dislocations
                                                                                           develops crystalline
                                                                                                        led to the
formation of passive films and the corrosion of ultrafine grains, improved by of
   defects,  including    dislocations of the grain boundary. An  increase in both the area   grain
                                                                                            the     boundaries
                                                                                                rapid  formation
   and dislocations led to the formation of passive films and the corrosion of ultrafine grains, improved
of passive films at surface crystalline defects, including grain boundaries and dislocations [54,55].
   by the rapid formation of passive films at surface crystalline defects, including grain boundaries and
In Al alloy, Al oxide film, containing eutectic Si particles, improved the pitting corrosion resistance
   dislocations. [54,55]. In Al alloy, Al oxide film, containing eutectic Si particles, improved the pitting
by increasing the ECAP pass number, which was related to the decrease of the size of Si-containing
   corrosion resistance by increasing the ECAP pass number, which was related to the decrease of the
impurities, because Si is the major cause of pitting corrosion. The decreases of the cathodic area led to
   size of Si-containing impurities, because Si is the major cause of pitting corrosion. The decreases of
a consequent decrease of the anodic current density [56].
   the cathodic area led to a consequent decrease of the anodic current density [56].

         Figure
      Figure 7. 7. Surfaceappearance
                Surface    appearanceofofA356
                                         A356 alloy
                                               alloy (a)
                                                      (a) as-cast,
                                                          as-cast,(b)
                                                                   (b)cooling
                                                                       coolingslope (c)(c)
                                                                                slope   ECAPed
                                                                                           ECAPed as-cast-T6 afterafter
                                                                                                     as-cast-T6    4
         passes and  (d) ECAPed  cooling slope-T6  after 6 passes  after immersion  for 10
      4 passes and (d) ECAPed cooling slope-T6 after 6 passes after immersion for 10 days.  days.

3.6.2. Potentiodynamic
   3.6.2. PotentiodynamicTest
                          Test
         The
       The     electrochemical
           electrochemical          behavior
                                 behavior      of A356
                                           of A356   alloyalloy
                                                            was was    evaluated
                                                                  evaluated         through
                                                                               through          the exposure
                                                                                         the exposure            of samples
                                                                                                          of these   these
to asamples   to aenvironment,
      corrosive     corrosive environment,
                                    based on abased     on a simulation
                                                simulation                of sea
                                                               of sea water,      water,
                                                                              using  3.5% using
                                                                                            NaCl  3.5%  NaCl electrolyte
                                                                                                    electrolyte  solution at
roomsolution  at room temperature
        temperature       [57]. The rate[57]. The rate ofwas
                                          of corrosion     corrosion   was measured
                                                                measured     using the using
                                                                                         linearthe   linear polarization
                                                                                                  polarization   technique
through the Tafel extrapolation method to identify the corrosion resistance of both as-cast andas-cast
    technique   through     the Tafel extrapolation    method   to identify  the  corrosion   resistance  of both    cooling
    and cooling
slope-cast          slope-cast
              samples.            samples.these
                            To compare      To compare
                                                  samples,these    samples,
                                                              Figure           Figure the
                                                                      8a–c depicts     8a–cpolarization
                                                                                              depicts the curves
                                                                                                             polarization
                                                                                                                      for the
    curves   for  the  as-cast   and  cooling  slope-cast    samples,   before   and   after  the  ECAP
as-cast and cooling slope-cast samples, before and after the ECAP process. The corrosion performance        process.   The
    corrosion performance of A356 alloy in 3.5 wt.% NaCl solution are tabulated in Table 2.
of A356 alloy in 3.5 wt.% NaCl solution are tabulated in Table 2.
         Based on the curves presented, the estimated average corrosion potentials were found to be
       Based on the curves presented, the estimated average corrosion potentials were found to be
    approximately similar, with trivial differences. The results further revealed that the reduction in the
approximately similar, with trivial differences. The results further revealed that the reduction in the
    corrosion rate and increment of polarization resistance, after the T6 heat treatment process for both
corrosion rate and increment of polarization resistance, after the T6 heat treatment process for both
    as-cast and cooling slope-cast samples, could be attributed to the modification in the shape of certain
as-cast  and cooling slope-cast samples, could be attributed to the modification in the shape of certain
    Si particles, where these particles became substantially finer after the processes of ECAP and cooling
Si particles,  where
    slope casting    [40].these particles
                           Therefore,  thisbecame
                                            could besubstantially    finer
                                                       associated with      after the processes
                                                                         a reduction   in the areaof   ECAP
                                                                                                     ratio     and cooling
                                                                                                           of cathodic   to
slope   casting   [40].   Therefore,  this  could   be  associated   with  a  reduction    in  the
    anodic phases. The corrosion rate of the as-cast alloy was 0.042 mmpy, reduced to 0.0015 mmpy  area  ratio  of cathodic
                                                                                                                      after
to anodic    phases.
    T6-4 passes    routeThe   corrosion
                           of A.          rate ofthe
                                 Additionally,     thecorrosion
                                                        as-cast alloy   was
                                                                  rate of the0.042   mmpy,
                                                                               cooling  slopereduced      to 0.0015
                                                                                                casting alloy         mmpy
                                                                                                               was 0.019
after  T6-4   passes   route   of  A. Additionally,    the corrosion    rate  of
    mmpy, reduced to 0.0014 and 0.00125 mmpy after 4 and 6 passes, respectively. the  cooling    slope  casting   alloy  was
0.019 mmpy, reduced to 0.0014 and 0.00125 mmpy after 4 and 6 passes, respectively.
Metals 2019, 9, 303                                                                                                          10 of 15
   Metals 2018, 8, x FOR PEER REVIEW                                                                                     10 of 16

                 Figure 8. Polarization
      Figure 8. Polarization  curves ofcurves of A356
                                        A356 alloy    alloyand
                                                   before    before
                                                                afterand afterinECAP
                                                                      ECAP            in 3.5NaCl.
                                                                                 3.5 wt.%    wt.% (a)
                                                                                                  NaCl.
                                                                                                      as-cast before
      and after T6; (b) cooling slope before and after T6; (c) heat-treated T6, as-cast and cooling slope after 4
        Essentially,
      and 6 passes. the polarization resistance depends on the microstructural state. After the ECAP
   process, the polarization resistance for both samples increased with more ECAP passes. Nevertheless,
      Essentially,
   after  the ECAP the     polarization
                      process,               resistance
                                 the polarization           depends
                                                      resistance     for on
                                                                          thethe   microstructural
                                                                              as-cast                  state.toAfter
                                                                                        sample was found                  the ECAP
                                                                                                                  be inferior       to
   that ofthe
process,    cooling  slope-cast
                polarization       sample, which
                                resistance    for bothpositively
                                                          samplesaffected      the reconstruction
                                                                       increased     with more ECAP   of the  metalNevertheless,
                                                                                                          passes.     protective
   layer,
after  theas   shown
            ECAP       in Table.2.
                    process,          However, the
                              the polarization           rate of corrosion
                                                      resistance                 for thesample
                                                                      for the as-cast      heat-treated   as-casttoand
                                                                                                   was found               cooling to
                                                                                                                    be inferior
   slope-cast
that  of coolingsamples   decreased
                   slope-cast    sample,  with morepositively
                                             which    ECAP passes.   affected the reconstruction of the metal protective
         The   cooling  slope-cast    sample    mainly
layer, as shown in Table 2. However, the rate of corrosiondemonstrated       an exceptional     corrosion as-cast
                                                                                  for the heat-treated      resistance,andwhichcooling
   was   greater  than  that of  the  as-cast  sample.
slope-cast samples decreased with more ECAP passes.       The    fine-grained    structure,   with higher   grain  boundaries,
   reduces    the concentration
      The cooling       slope-cast  of chloride
                                         sample per     grain demonstrated
                                                   mainly        boundary, which     anreduces   the current
                                                                                          exceptional          densityresistance,
                                                                                                          corrosion        [58,59],
   and this provides the advantage of forming more a stable and intact passivation film, improving the
which was greater than that of the as-cast sample. The fine-grained structure, with higher grain
   corrosion resistance. The obtained result in this study is in line with [60–62].
boundaries, reduces the concentration of chloride per grain boundary, which reduces the current
density [58,59],    and this provides the advantage of forming more a stable and intact passivation film,
             Table 2. Average of corrosion rate (CR), polarization resistance (Rp) and current density (Icorr).
improving the corrosion resistance. The obtained result in this study is in line with [60–62].
                                    Ecorr             Icorr                Rp                βc            βa            CR
            Samples
                                     (V)
           Table 2. Average of corrosion      rate (A/cm    2)
                                                   (CR), polarization    (Ω·m  2)
                                                                           resistance    (V·dec
                                                                                        (Rp)      ) (V·dec
                                                                                             and−1current     −1)
                                                                                                           density  (I(mmy
                                                                                                                       corr ).
                                                                                                                                −1)

         As-cast (A-C)             –0.698        3.894 × 10    −6      5.212 × 10  3       0.642       0.0504          0.0424
             A-C-T6               E–0.713
                                    corr           Icorr × 10−7
                                                 8.432                  Rp × 104
                                                                       2.035              β0.443
                                                                                           c            βa
                                                                                                       0.0499             CR
                                                                                                                       0.0160
            Samples
                                   (V)           (A/cm2 )            (Ω·m2 )         (V·dec−1 )     (V·dec−1 )       (mmy−1 )
       A-C-T6, 4 passes            –0.751        1.369 × 10⁻⁷          9.147 × 10⁴         0.268       0.0286          0.0015
         As-cast (A-C)          −  0.698      3.894  ×  10 −6      5.212 ×  103         0.642         0.0504            0.0424
     Cooling slope (C.S)           –0.769        1.790 × 10    −6      9.690 × 10  3       0.333       0.0480          0.0195
             A-C-T6             −0.713        8.432 × 10⁻⁷ - 2.035 × 10⁴ 4              0.443         0.0499            0.0160
              C.S-T6
       A-C-T6, 4 passes
                                   -0.702 1.369
                                −0.751
                                                  7.258  × 10 9.147
                                                     × 10−7
                                                                       2.180 × 10
                                                                         × 104
                                                                                           0.321
                                                                                        0.268
                                                                                                       0.0474
                                                                                                      0.0286
                                                                                                                       0.0079
                                                                                                                        0.0015
        C.S-T6,slope
     Cooling     4 passes
                     (C.S)      −-0.717
                                   0.769         1.285
                                              1.790  × 10× −10
                                                             6 −7 9.6908.516
                                                                         × 10×3 10
                                                                                   4       0.280
                                                                                        0.333           0.047
                                                                                                      0.0480           0.0014
                                                                                                                        0.0195
        C.S-T6,  6 passes
             C.S-T6             −-0.709
                                   0.702         1.145
                                              7.258  × 10× −10
                                                             7 −7 2.180  × 10×4 104 0.321
                                                                       9.525               0.259        0.0466
                                                                                                      0.0474           0.00124
                                                                                                                        0.0079
       C.S-T6, 4 passes          −0.717       1.285 × 10⁻⁷       8.516 × 10⁴          0.280            0.047         0.0014
       C.S-T6, 6 passes          −0.709       1.145 × 10⁻⁷       9.525 × 10⁴          0.259           0.0466         0.00124
Metals 2019, 9, 303                                                                                                     11 of 15

   Metals 2018, 8, x FOR PEER REVIEW                                                                                 11 of 16
3.6.3. Pitting Corrosion Appearance
    3.6.3. Pitting
       In the        Corrosion
                eutectic  mixture Appearance
                                     phase, the initial corrosion stages of the as-cast sample revealed localized
corrosion,     whereas     the  silicon
          In the eutectic mixture phase, particles   and corrosion
                                               the initial  α-Al interfaces
                                                                       stages ofwere    unaffected
                                                                                  the as-cast  sample [8,32,33,49].    Figure 9
                                                                                                        revealed localized
reveals    a sidewhereas
    corrosion,     view of the
                             the silicon
                                  pitting particles
                                            corrosionandof A356
                                                            α-Al alloy.   Figure
                                                                   interfaces      9a,b
                                                                                were      displays the
                                                                                       unaffected        pitting corrosion
                                                                                                    [8,32,33,49].   Figure 9 of
(a)reveals
     the as-cast   and
              a side    (b) of
                      view   cooling   slope-cast
                                the pitting         of A356
                                              corrosion        alloyalloy.
                                                          of A356    samples.    It should
                                                                            Figure           be noted
                                                                                     9a,b displays   thethat   the corrosion
                                                                                                          pitting  presence of
theofenlarged     area in
       (a) the as-cast  andthe(b)
                                eutectic
                                  coolingmixture    phase
                                            slope-cast       in Figure
                                                        of A356          9a,b would
                                                                  alloy samples.        eventually
                                                                                   It should         leadthat
                                                                                              be noted     to athe
                                                                                                                 wider   area of
                                                                                                                    presence
corrosion     on the surface
    of the enlarged     area inof   alloy.
                                  the eutectic mixture phase in Figure 9a,b would eventually lead to a wider
    area  of corrosion
       This  implied that on the
                              the surface   of alloy.corrosion between impurities of high Si and Al matrix could
                                   microgalvanic
contributeThisto implied  that the microgalvanic
                   the occurrence                     corrosionwithin
                                       of pitting corrosion       between theimpurities
                                                                               area that of  high Si and
                                                                                           contains        Al matrix
                                                                                                      impurities     of could
                                                                                                                         high Si.
    contribute    to the  occurrence    of pitting  corrosion    within  the  area  that  contains impurities
Meanwhile, Figure 9c,d displays the pitting corrosion, after a potentiodynamic test for the heat-treated          of high  Si.
(c) Meanwhile,
     as-cast sample Figure   9c,dfour
                         (after     displays
                                        passestheofpitting
                                                    ECAP corrosion,
                                                              process) andafter(d)
                                                                                 a potentiodynamic
                                                                                    cooling slope-cast   test  for the(after
                                                                                                           sample        heat-six
    treated   (c) as-cast sample    (after four  passes  of ECAP    process)   and  (d)  cooling slope-cast
passes of ECAP process). The difference in the area of the α-Al separated grains and depth of corrosion       sample    (after
    six passes
in the  eutecticofmixture
                     ECAP process).      The difference
                              phase, between      both thein    the area
                                                             as-cast  andofcooling
                                                                              the α-Al   separated
                                                                                      slope-cast     grains before
                                                                                                 samples,     and depth     of
                                                                                                                      and after
    corrosion in the eutectic mixture phase, between both the as-cast and cooling slope-cast samples,
the ECAP process, was evident, as revealed in Figure 9a,b. The reduction in the size of Si particles,
    before and after the ECAP process, was evident, as revealed in Figure 9a,b. The reduction in the size
as previously shown in Figure 5 and Table 1, the refined grain in an elongated shape, as well as the
    of Si particles, as previously shown in Figure 5 and Table 1, the refined grain in an elongated shape,
microstructure homogeneity of eutectic mixture phase surrounding the elongated α-Al phase led to
    as well as the microstructure homogeneity of eutectic mixture phase surrounding the elongated α-Al
the reduced rate of corrosion for the ECAPed A356-T6 cooling slope-cast alloy sample, compared to
    phase led to the reduced rate of corrosion for the ECAPed A356-T6 cooling slope-cast alloy sample,
that of the as-cast alloy sample, as displayed in Figure 9c,d.
    compared to that of the as-cast alloy sample, as displayed in Figure 9c,d.

         Figure
      Figure   9. 9.Pitting
                     Pitting corrosion
                             corrosion of
                                        of(a)
                                           (a)as-cast, (b)(b)
                                                as-cast,   cooling slope,
                                                              cooling     (c) as-cast-T6,4
                                                                       slope,              passes passes
                                                                                (c) as-cast-T6,4  and (d) and
                                                                                                          cooling
                                                                                                               (d)slope-
                                                                                                                   cooling
         T6, 6 passes    route A of A356  alloy.
      slope-T6, 6 passes route A of A356 alloy.

     In In summary,
        summary,   the the  corrosion
                        corrosion      resistance
                                  resistance      of ECAPed
                                             of ECAPed         A356-T6
                                                         A356-T6           alloy sample
                                                                   alloy sample          was significantly
                                                                                  was significantly improved
  improved
due           due to theinreduction
    to the reduction                in the
                           the galvanic    galvanicdifference,
                                         potential  potential difference,
                                                               which thewhich     the reduced
                                                                             reduced           area
                                                                                      area ratio    rationoble
                                                                                                 of the   of
  the noble  phase  to less-noble eutectic mixture phase contributed
phase to less-noble eutectic mixture phase contributed to.             to.
        The shape of Si particles influences the formation of a firm oxide film. In particular, coarsened
  Si particles impede the development of a protective oxide layer in the aqueous solutions and weakens
Metals 2019, 9, 303                                                                                                      12 of 15

      The shape of Si particles influences the formation of a firm oxide film. In particular, coarsened Si
Metals 2018, 8, x FOR PEER REVIEW                                                                                        12 of 16
particles impede the development of a protective oxide layer in the aqueous solutions and weakens
the
the protective
     protective passive
                    passive film
                              film [8].    The reduction
                                     [8]. The     reduction in  in the
                                                                    the area
                                                                         area ratio
                                                                               ratio of
                                                                                      of noble
                                                                                         noble Si  Si particles
                                                                                                      particles to
                                                                                                                 to less-noble
                                                                                                                     less-noble
eutectic  Al  phase   around    these   Si particles    significantly   improves    the resistance
eutectic Al phase around these Si particles significantly improves the resistance of pitting          of pitting  corrosion   [5].
                                                                                                                      corrosion
Furthermore,      localized  mechanical        damage     or the  chemical    changes   of the
[5]. Furthermore, localized mechanical damage or the chemical changes of the environment may     environment     may   damage
the protective
damage            oxide film.oxide
           the protective       The increase
                                       film. The  of the  applied
                                                      increase   ofvoltage   on thevoltage
                                                                     the applied     side of theon cathodic
                                                                                                    the side curve,
                                                                                                              of the as  shown
                                                                                                                       cathodic
in Figure   8, contributes   to  the  rapid    reduction    of current   to the extent  that  its value
curve, as shown in Figure 8, contributes to the rapid reduction of current to the extent that its value   remains   unchanged
before
remains achieving
          unchanged   the before
                          value of    Icorr .
                                   achieving      the value of Icorr.
      The
      The steep increment in the anodic
            steep   increment     in  the  anodic current,
                                                       current, with
                                                                 with the
                                                                        the increment
                                                                             increment in in the
                                                                                               the applied
                                                                                                    applied potential
                                                                                                              potential inin the
                                                                                                                             the
positive  direction,    breaks   the   developed       oxide  layer   and  causes  pitting   corrosion.
positive direction, breaks the developed oxide layer and causes pitting corrosion. Here, the chloride      Here,  the  chloride
ion
ion attacks
     attacks and
               and dissolves
                     dissolves the
                                 the aluminum
                                      aluminum surfacesurface toto form
                                                                   form anan aluminum
                                                                              aluminum chloride
                                                                                           chloride compound.
                                                                                                        compound. The The SEM
                                                                                                                           SEM
image
image and EDX of the Al22O33 oxide layer of the ECAPed A356 alloy after the corrosion test, are shown
        and   EDX    of the Al   O   oxide     layer  of the  ECAPed      A356  alloy  after  the  corrosion   test, are shown
in
in Figure
   Figure 10.     The highest
             10. The    highest corrosion        resistance with
                                  corrosion resistance         with the
                                                                     the lowest
                                                                          lowest corrosion
                                                                                   corrosion raterate were
                                                                                                      were obtained
                                                                                                             obtained forfor the
                                                                                                                             the
aluminum
aluminum A356  A356 alloy,
                      alloy, which
                             which was wassubjected
                                              subjectedto  tothe
                                                              theECAP
                                                                   ECAPprocess,
                                                                            process,asastabulated
                                                                                         tabulatedin   inTable
                                                                                                          Table2.2.

                      Figure 10. (a) Oxide layer of ECAPed A356 alloy and (b–d) EDX of oxide layer.
                                                                                             layer.

4. Conclusions
4. Conclusions
      In
      In this
          thisstudy,
               study,the
                       themicrostructural
                           microstructuralevaluation
                                            evaluationof A356  alloy
                                                         of A356     using
                                                                   alloy    heat heat
                                                                          using  treatment  and cooling
                                                                                       treatment         slope
                                                                                                  and cooling
followed   by  ECAP   process was  successfully carried  out. The effect of grain refinement  on the
slope followed by ECAP process was successfully carried out. The effect of grain refinement on the   hardness
and  the corrosion
hardness             resistance resistance
            and the corrosion   was investigated  and the results
                                           was investigated        obtained
                                                              and the  resultscan  be summarized
                                                                               obtained            as follows:
                                                                                          can be summarized
•as follows:
       The as-cast samples were successfully subjected to ECAP for up to four passes, while the samples
      •from
          The  as-cast
             cooling     samples
                      slope       were
                            casting, six successfully
                                         passes.      subjected to ECAP for up to four passes, while the
          samples from cooling slope casting, six passes.
•      The latter also showed finer and more homogeneous distribution of α-Al grains and Si particles.
      • The latter also showed finer and more homogeneous distribution of α-Al grains and Si
       As a result, their hardness values were also higher.
          particles. As a result, their hardness values were also higher.
•      The combination of cooling slope casting and ECAP had given the lowest current density to the
      • The combination of −cooling       slope casting and ECAP had given the lowest current density to
       A356 alloy, at 1.145 × 10 7 A/cm−7  2 when experimental using 3.5 wt.% NaCl solution. The favorable
          the A356 alloy, at 1.145 × 10 A/cm2 when experimental using 3.5 wt.% NaCl solution. The
          favorable corrosion resistance was attributed to the refined Si particles that impeded the
          occurrences of microgalvanic cells on the protective layer of the alloy surface.
Metals 2019, 9, 303                                                                                          13 of 15

      corrosion resistance was attributed to the refined Si particles that impeded the occurrences of
      microgalvanic cells on the protective layer of the alloy surface.

Author Contributions: M.A.G. carried out the experimental works, analysis and writing under the supervision
of M.Z.O., I.F.M. and N.K.O.
Funding: This research was funded by Ministry of Education Malaysia and Universiti Kebangsaan Malaysia
[DIP-2016-007].
Acknowledgments: The authors wish to express their gratitude to the Ministry of Education Malaysia and
Universiti Kebangsaan Malaysia for the financial assistance and support.
Conflicts of Interest: The authors declare no conflict of interest.

References
1.    Haghdadi, N.; Zarei-Hanzaki, A.; Abedi, H.R.; Sabokpa, O. The effect of thermomechanical parameters on
      the eutectic silicon characteristics in a non-modified cast A356 aluminum alloy. Mater. Sci. Eng. A 2012, 549,
      93–99. [CrossRef]
2.    Davis, J.R. Aluminum and Aluminum Alloys. Light Met. Alloy 2001, 66, 351–416. [CrossRef]
3.    Musa, A.Y.; Mohamad, A.B.; Kadhum, A.A.H.; Chee, E.P. Galvanic corrosion of aluminum alloy (Al2024)
      and copper in 1.0 M nitric acid. Int. J. Electrochem. Sci. 2011, 6, 5052–5065.
4.    Galvin, E.; O’Brien, D.; Cummins, C.; Mac Donald, B.J.; Lally, C. A strain-mediated corrosion model for
      bioabsorbable metallic stents. Acta Biomater. 2017, 55, 505–517. [CrossRef] [PubMed]
5.    Tahamtan, S.; Fadavi Boostani, A. Evaluation of pitting corrosion of thixoformed A356 alloy using
      a simulation model. Trans. Nonferrous Met. Soc. China English Ed. 2010, 20, 1702–1706. [CrossRef]
6.    Boostani, A.F.; Tahamtan, S. Fracture behavior of thixoformed A356 alloy produced by SIMA process. J. Alloys
      Compd. 2009, 481, 220–227. [CrossRef]
7.    Tahamtan, S.; Boostani, A.F. Quantitative analysis of pitting corrosion behavior of thixoformed A356 alloy in
      chloride medium using electrochemical techniques. Mater. Des. 2009, 30, 2483–2489. [CrossRef]
8.    Barbucci, A.; Bruzzone, G.; Delucchi, M.; Panizza, M.; Cerisola, G. Breakdown of passivity of aluminium
      alloys by intermetallic phases in neutral chloride solution. Intermetallics 2000, 8, 305–312. [CrossRef]
9.    Wang, Q.G. Microstructural effects on the tensile and fracture behavior of aluminum casting alloys A356/357.
      Metall. Mater. Trans. A 2003, 34, 2887–2899. [CrossRef]
10.   Arrabal, R.; Mingo, B.; Pardo, A.; Mohedano, M.; Matykina, E.; Rodríguez, I. Pitting corrosion of rheocast
      A356 aluminium alloy in 3.5 wt.% NaCl solution. Corros. Sci. 2013, 73, 342–355. [CrossRef]
11.   Akhter, R.; Ivanchev, L.; Burger, H.P. Effect of pre/post T6 heat treatment on the mechanical properties of
      laser welded SSM cast A356 aluminium alloy. Mater. Sci. Eng. A 2007, 447, 192–196. [CrossRef]
12.   Liao, B.; Park, Y.; Ding, H. Effects of rheocasting and heat treatment on microstructure and mechanical
      properties of A356 alloy. Mater. Sci. Eng. A 2011, 528, 986–995. [CrossRef]
13.   Syarif, J.; Detak, Y.P.; Ramli, R. Modeling of Correlation between Heat Treatment and Mechanical Properties
      of Ti–6Al–4V Alloy Using Feed Forward Back Propagation Neural Network. ISIJ Int. 2010, 50, 1689–1694.
      [CrossRef]
14.   Atkinson, H. Current status of semi-solid processing of metallic materials. Adv. Mater. Form. 2007, 81–98.
      [CrossRef]
15.   Mohammed, M.N.; Omar, M.Z.; Salleh, M.S.; Alhawari, K.S.; Kapranos, P. Semisolid metal processing
      techniques for nondendritic feedstock production. Sci. World J. 2013, 2013, 1–16. [CrossRef] [PubMed]
16.   Salleh, M.S.; Omar, M.Z.; Syarif, J.; Mohammed, M.N. An Overview of Semisolid Processing of Aluminium
      Alloys. ISRN Mater. Sci. 2013, 2013, 1–9. [CrossRef]
17.   Spencer, D.B.; Merhrabian, R.; Flemings, M. Rheological behaviour of Sn-15pct Pb in the crystallization range.
      Metall. Trans. 1972, 3, 1925–1932. [CrossRef]
18.   Haga, T.; Kapranos, P. Billetless simple thixoforming process. J. Mater. Process. Technol. 2002, 130–131,
      581–586. [CrossRef]
19.   Birol, Y. A357 thixoforming feedstock produced by cooling slope casting. J. Mater. Process. Technol. 2007, 186,
      94–101. [CrossRef]
You can also read