Investor presentation - Q4 2018
←
→
Page content transcription
If your browser does not render page correctly, please read the page content below

ESCV conference, Athens, Greece, September 2018

                         Investor presentation
                         Q4 2018

     Sample to Insight
                         Investor presentation Q4 2018   1
Disclaimer

Safe Harbor Statement: This presentation contains both historical and forward-looking statements. All statements other than statements of historical fact are, or may be deemed to be forward looking
statements within the meaning of Section 27A of the U.S. Securities Act of 1933, as amended, and Section 21E of the U.S. Securities Exchange Act of 1934, as amended. These statements are based on
current expectations of future events. If underlying assumptions prove inaccurate or unknown risks or uncertainties materialize, actual results could vary materially from our own expectations and projections.
Some of the factors that could cause actual results to differ include, but are not limited, to the following: general industry conditions and competition; risks associated with managing growth and international
operations (including the effects of currency fluctuations, regulatory processes and dependence on logistics), variability of operating results and allocations between customer classes, and the commercial
development of markets for our products to customers in academia, pharma, applied testing and molecular diagnostics; changing relationships with customers, suppliers and strategic partners; competition;
rapid or unexpected changes in technologies; fluctuations in demand for QIAGEN's products (including factors such as general economic conditions, the level and timing of customers' funding, budgets and
other factors); our ability to obtain regulatory approval of our products; technological advances of our competitors and related legal disputes; difficulties in successfully adapting QIAGEN's products to
integrated solutions and producing such products; the ability of QIAGEN to identify and develop new products and to differentiate and protect our products from competitor products; market acceptance of
QIAGEN's new products and the integration of acquired technologies and businesses. For further information, please refer to “Risk Factors” section of reports that QIAGEN has filed with, or furnished to, the
U.S. Securities and Exchange Commission (SEC). We undertake no obligation, and do not intend, to update these forward-looking statements as a result of new information or future events or developments
unless and to the extent required by law.

Regulation G: QIAGEN reports adjusted results, as well as results on a constant exchange rate (CER) basis, and other non-U.S. GAAP figures (generally accepted accounting principles), to provide
additional insight on performance. In this presentation, adjusted results include adjusted net sales, adjusted operating expenses, adjusted EBITDA, adjusted diluted EPS and free cash flow. Adjusted results
are non-GAAP financial measures QIAGEN believes should be considered in addition to reported results prepared in accordance with GAAP, but should not be considered as a substitute. QIAGEN believes
certain items should be excluded from adjusted results when they are outside of its ongoing core operations, vary significantly from period to period, or affect the comparability of results with its competitors
and its own prior periods. Please see the Appendix provided in this presentation “Reconciliation of Non-GAAP to GAAP Measures” for reconciliations of historical non-GAAP measures to comparable GAAP
measures and the definitions of terms used in the presentation. QIAGEN does not reconcile forward-looking non-GAAP financial measures to the corresponding GAAP measures due to the high variability
and difficulty in making accurate forecasts and projections that are impacted by future decisions and actions. Accordingly, reconciliations of these forward-looking non-GAAP financial measures to the
corresponding GAAP measures are not available without unreasonable effort. However, the actual amounts of these excluded items will have a significant impact on QIAGEN’s GAAP results.

GeneReader NGS System: The QIAGEN GeneReader® NGS System is intended for Research Use Only. This product is not intended for the diagnosis, prevention or treatment of a disease. QIAGEN
Clinical Insight® is an evidence-based decision support software intended as an aid in the interpretation of variants observed in genomic sequencing data. The software evaluates genomic variants in the
context of published biomedical literature, professional association guidelines, publicly available databases and annotations, drug labels and clinical-trials. Based on this evaluation, the software proposes a
classification and bibliographic references to aid in the interpretation of observed variants. The software is not intended as a primary diagnostic tool by physicians or to be used as a substitute for professional
healthcare advice. Each laboratory is responsible for ensuring compliance with applicable international, national and local clinical laboratory regulations and other accreditation requirements.

Sample to Insight
                    Investor presentation Q4 2018                                                                                                                                                                  2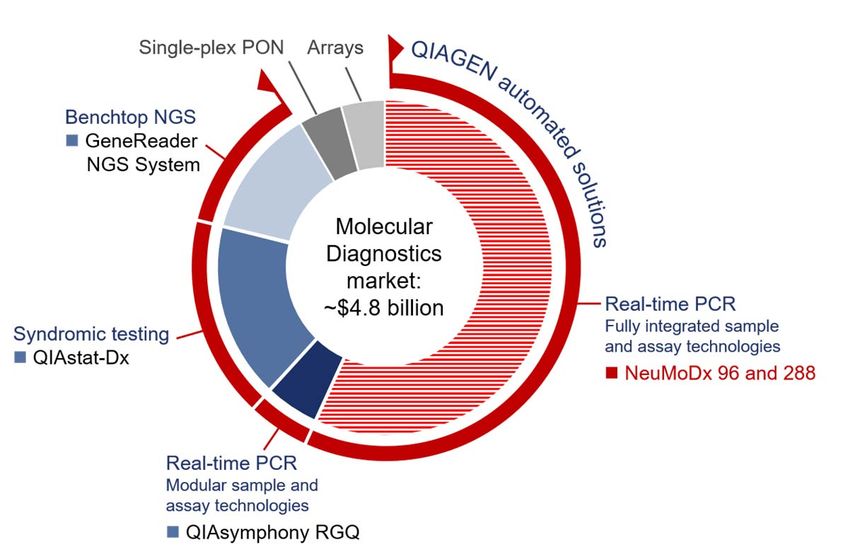
Agenda

                                                    Introducing QIAGEN

                                                    Portfolio review

                                                    Full-year 2017 results

                                                    Q3 2018 results

                                                    Appendix

Sample to Insight
                    Investor presentation Q4 2018                            3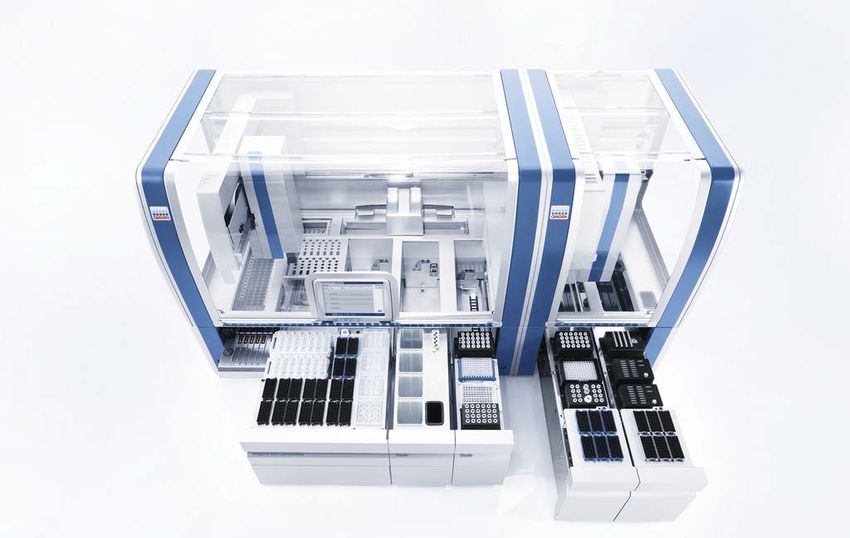
THE BUILDING BLOCKS OF LIFE:
DNA AND RNA

         The molecular revolution is gaining momentum – importance of valuable insights

Sample to Insight
                    Investor presentation Q4 2018                                         4
ADDRESSING THE WORLD’S
MOST PRESSING CHALLENGES

    How can we                                                                     How can we
                                               How can we        How can we
  achieve scientific                                                             further improve
                                              develop better      improve
   breakthroughs                                                                  outcomes for
                                             and safer drugs?   public safety?
    even faster?                                                                     patients?

         Expanding the range of customers who can benefit from molecular solutions

Sample to Insight
                    Investor presentation Q4 2018                                                  5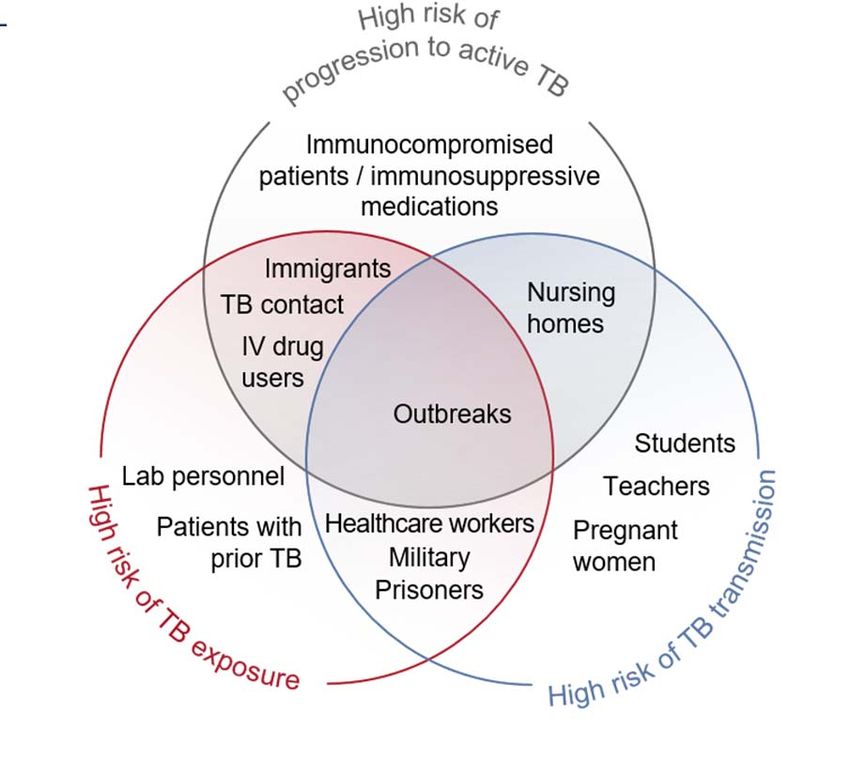
CUSTOMERS RELY ON QIAGEN
TO MASTER THESE CHALLENGES

                                                    Faster                         Better                 More efficiently

                                                     #1                                                          Top 3
                                                             Sample Technologies            Assay Technologies

                                                                Bioinformatics              Automation systems
                                                     #1                                                          Top 5
     BIOLOGICAL                                                                                                                  VALUABLE
                                                                    SAMPLE TO INSIGHT SOLUTIONS
       SAMPLE                                                                                                                MOLECULAR INSIGHTS

         QIAGEN: World leader in molecular testing solutions that enable valuable insights

Sample to Insight
                    Investor presentation Q4 2018                                                                                                 6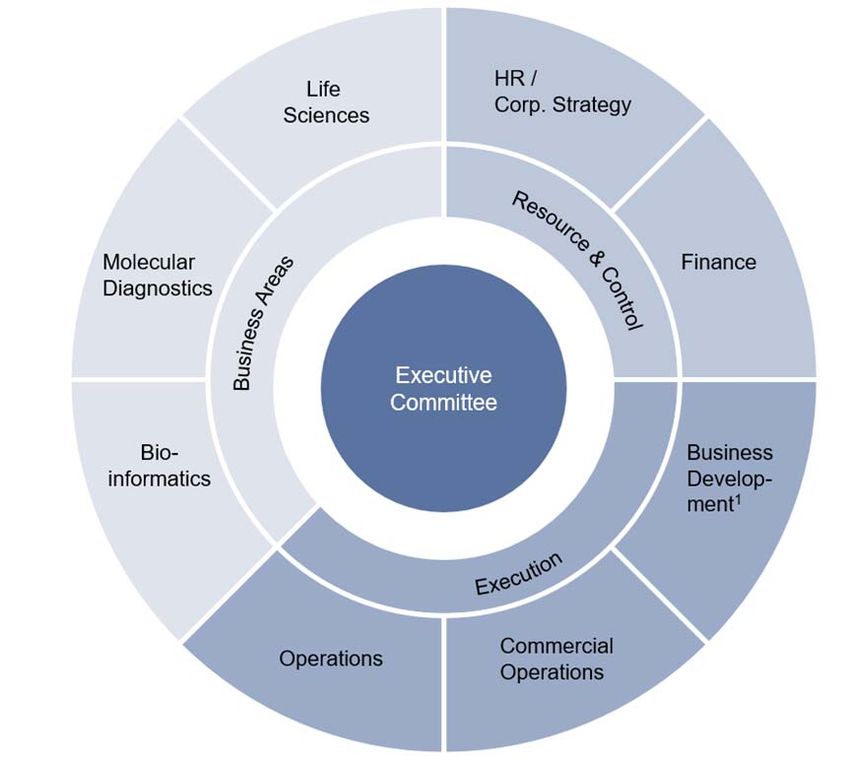
#1                                                Top 3
                                                         Sample Technologies     Assay Technologies

                                                            Bioinformatics       Automation systems
                                                    #1                                                Top 5
     BIOLOGICAL                                                                                                   VALUABLE
                                                                SAMPLE TO INSIGHT SOLUTIONS
       SAMPLE                                                                                                 MOLECULAR INSIGHTS

         QIAGEN: World leader in molecular testing solutions that enable valuable insights

Sample to Insight
                    Investor presentation Q4 2018                                                                                  7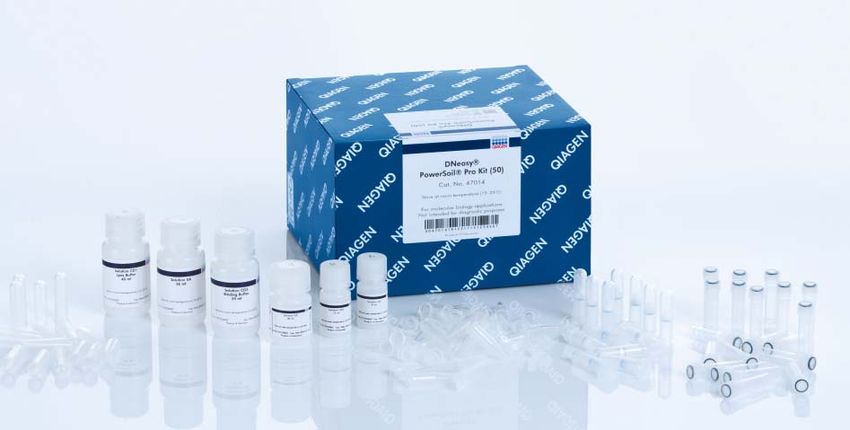
Academia
~23%
QIAGEN at a glance Consumables (incl. bioinformatics) Scientific breakthroughs
Leader in molecular testing solutions
True hybrid covering continuum from ~87%
Pharma
Life Sciences to Molecular Diagnostics
~19%
Better and safer drugs
Facts and figures
Applied Testing
2017 sales ~$1.42 billion
~10%
Customers >500,000 ~13%
Secure and protect
Global reach >35 countries
Employees ~4,800 Instruments and automation systems Molecular Diagnostics
Share listings Frankfurt / NYSE
~48%
Headquarters Netherlands
Better healthcare
World leader in molecular testing, transforming biological samples into valuable insights
Sample to Insight
Investor presentation Q4 2018 8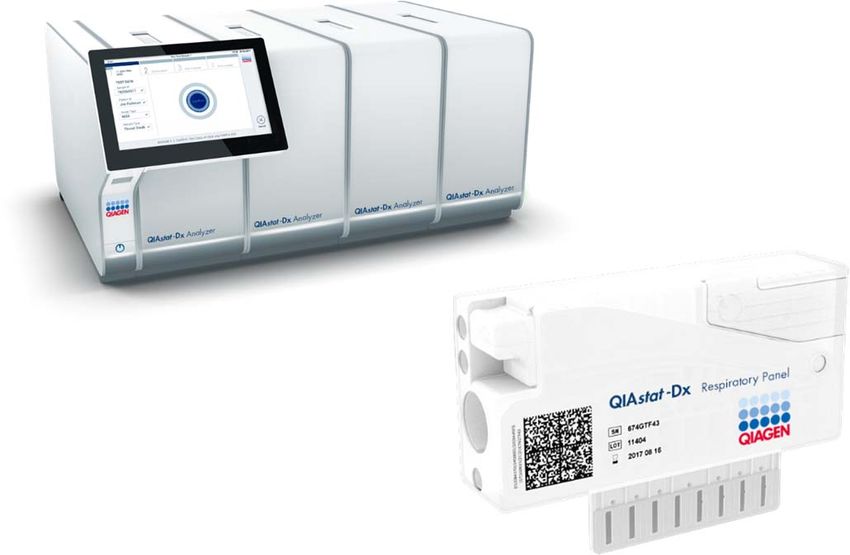
Sales by customer class
(As % of annual net sales)
                                                                 2016-2020 target:
                                                                ~+7-9% CER CAGR

                       100%                              100%
                                                                                           Academia
                                                                       45%
                         26%                             23%
                                                                                           Pharma

                                                         19%
                         21%                                                               Applied Testing

                          6%                             10%
                                                          2%                               U.S. HPV
                         22%                                           55%
                                                                                           MDx core portfolio
                                                         46%
                         25%

                         2009                            2017          2020

         QIAGEN going through transformation to focus on attractive growth opportunities
                    CAGR – Compound annual growth rate
Sample to Insight
                    Investor presentation Q4 2018                                                               9
2020 ambitions

                           Net sales                             Adjusted EPS              Operating cash flow

                                        ~+7-9% CER                         ≥12% CER
                                           CAGR                              CAGR                        ~$600 m

        $1,338 m
        +6% CER
                                                         $1.11
                                                                                         $340 m

            2016                                 2020    2016                    2020    2016              2020
                                                target                          target                    target

           2020 ambitions: Strong growth in sales, adjusted EPS and cash flow

Sample to Insight
                    Investor presentation Q4 2018                                                                  10
Reinvest for organic growth
Capture more value from our Sample to Insight portfolio
New products
Geographic expansion
Increase returns
Disciplined
Returned $300 million in 2017
capital allocation
New commitment in 2018 to return $200 million via repurchases
Targeted M&A / licensing
Continuing our strategy
Novel technologies
Molecular test content
Geographic expansion
Supporting our business expansion while increasing returns to shareholders
Sample to Insight
Investor presentation Q4 2018 11+ Maximize sales growth
Multiple drivers
+ Deliver operating leverage
Greater
+ Optimize balance sheet value
creation
+ Strong governance and top talent
= Adjusted EPS growth and high returns
Committed to higher returns and greater value creation as differentiated leader
Sample to Insight
Investor presentation Q4 2018 12Agenda
Introducing QIAGEN
Portfolio review
Full-year 2017 results
Q3 2018 results
Appendix
Sample to Insight
Investor presentation Q4 2018 13Sample to Insight portfolio
Key highlight areas: QIAGEN’s Sample to Insight portfolio
Life Sciences Molecular Diagnostics
QuantiFERON
NeuMoDx NEW
QIAstat-Dx
Personalized Healthcare
Next-generation sequencing
Life Sciences
QIAsymphony
Differentiated Technologies
Multiple growth opportunities across our Sample to Insight portfolio
Sample to Insight
Investor presentation Q4 2018 14QIAGEN’s footprint in the Molecular Diagnostics market
Addressing the majority of the ~4.8 billion Molecular Diagnostics market in 2018
Single-plex PON Arrays
Benchtop NGS
GeneReader
NGS System
Real-time PCR
Syndromic testing Fully integrated sample
QIAstat-Dx and assay technologies
NeuMoDx 96 and 288
Real-time PCR
Modular sample and
assay technologies
QIAsymphony RGQ
Since 2015: QIAGEN created a comprehensive automation portfolio addressing MDx key segments
Sample to Insight
Investor presentation Q4 2018 15NeuMoDx
NeuMoDx: The next generation of clinical molecular testing Q3 2018 highlights
Distribution agreement with NeuMoDx Inc.
Fully integrated microfluidic design
N96 Access to disruptive new technology for PCR
in standard microplate format
Launch of two clinical platforms
PCR Contingent full acquisition: Earliest mid-2019
chamber
NeuMoDx™ N96 and N288 systems
Fully integrated PCR platforms
DNA / RNA
capture chamber Highly synergistic with existing portfolio
N288
“Flowthrough” Unique and scalable platform technology
extraction even
Best-in-class workflow features:
for high volumes
NeuMoDx Comp. R Comp. H
True random access No No
Time to result 40 minNeuMoDx
NeuMoDx platform key features
Specification NeuMoDx N288 NeuMoDx N96
Rapid turnaround time
Sample throughput: High-throughput Mid-throughput
Samples per 8-hour shift Up to 340 Up to 150
Best ease-of-use
Maximal sample loading 288 96
Greater workflow versatility Walk-away capability ~7 hours ~5 hours
Turn-around time 40 to 80 min 40 to 80 min
Cost efficiency True random access Up to 30 assays Up to 20 assays
Footprint 183 cm x 109 cm 136 cm x 108 cm
Compact design
Onboard refrigeration necessary No No
NeuMoDx N96 and N288: Two novel platforms with identical consumables and same core technology
Sample to Insight
Investor presentation Q4 2018 17NeuMoDx
A full portfolio for all major Molecular Diagnostics segments
Platform Applications Laboratories
All MDx areas Use across all laboratory types
QIAsymphony
Practically unlimited Modular workflows
RGQ sample capabilities Low- to mid-throughput
All MDx areas Use across all laboratory types
NeuMoDx Primarily used for Integrated workflows
infectious diseases Low- to high-throughput
Syndromic testing Use in all laboratories for
QIAstat-Dx Infectious diseases, syndromic testing
oncology, etc. Also near-patient and ER use
Initial focus on
GeneReader oncology gene panels Use in pathology and
NGS System New: Genetics, NIPT core MDx laboratories
and infectious diseases
QIAGEN using disruptive next-generation NeuMoDx platforms to gain entry into largest MDx market segment
ER – Emergency room NIPT – Non-invasive prenatal testing
Sample to Insight
Investor presentation Q4 2018 18QIAstat-Dx
QIAstat-Dx: The next generation of syndromic insights Q3 2018 highlights
Rapidly establishing footprint in the growing
Operational module Analytical module
market for syndromic testing
Intuitive and simple graphical Small footprint with low
user interface maintenance requirements New Gastrointestinal panel launched, featuring
comprehensive viral, bacterial and parasitic coverage
Well on track to complete FDA regulatory submission
by the end of 2018 and U.S. launch by mid-2019
Modular Liquid / solid
instrument sample input
Dry swab
Self- sample input
contained
cartridge Real-time PCR
reaction chambers
QIAstat-Dx adds next-generation Sample to Insight system to QIAGEN’s portfolio of core platforms
GI - Gastrointestinal
Sample to Insight
Investor presentation Q4 2018 19QuantiFERON
QuantiFERON-TB: Full automation sets new standard for TB testing Q3 2018 highlights
Best-in-class test to screen for latent tuberculosis
Double-digit CER growth in Q3, on track
for 2020 revenue target of ~$300 m
QuantiFERON-TB Gold Plus
Standard test in clinical trial of first vaccine to
+ show efficacy in treatment of latent TB
Support by UN TB Summit: Commitment to fund
$13 bn a year for TB prevention and care by 2022
Best-in-class workflow automation
Launch of CE-marked test read-out workflow
Lithium heparin Hamilton DiaSorin Test DiaSorin, LIAISON analyzers
single tube Microlab STAR LIAISON XL results
Blood collection Liquid handling Test read-out Launch of front-end automation
Hamilton systems
Best-in-class menu
50% reduction of hands-on time Launch of CE-marked workflow
QuantiFERON-TB now embedded in LIAISON
menu of >120 assays
Ongoing global dissemination of QuantiFERON-TB as the gold standard blood test for latent TB
TB – Tuberculosis UN – United Nations
Sample to Insight
Investor presentation Q4 2018 20QuantiFERON
Tuberculin skin test (TST) QuantiFERON-TB (QFT)
Manual placement, reading, data entry Can be fully automated
Affected by BCG vaccine and NTM Highly specific
Two patient visits required Results with one patient visit
Significant inter-reader variability No inter-reader variability
Poor surveillance tool Electronic results
Often no quality control after training Quality-assured laboratory test(1)
QuantiFERON-TB: Leading IGRA with significant clinical and workflow benefits
BCG – Bacillus Calmette-Guerin vaccine NTM – Non-tuberculosis mycobacteria IGRA – Interferon-gamma release assay
(1) Not available in all markets
Sample to Insight
Investor presentation Q4 2018 21QuantiFERON
Expanding QuantiFERON-TB benefits
Total
convertible
2020 target: >$300 million sales
LTBI market:
Intensify commercial activities in strategic markets
Automation upgrades to improve workflow ~70 million
Continue menu expansion tests annually
North America
Market: ~20 million LTBI tests
FDA approval of QFT-Plus in 2017 China
Commercial power: Adding reps Market: ~15 million LTBI tests
Build networks and
drive clinical demand
Support LTBI guidelines
Latin America Japan
Market: ~8 million LTBI tests Market: ~7 million LTBI tests
Support public health Launch QFT-Plus in Feb 2018
guidelines Develop commercial partner network
Asia-Pacific
Europe / Middle East / Africa Market: ~15 million LTBI tests
Market: ~5 million LTBI tests Highest TB burden region
Dubai hub to expand Go direct in attractive markets
regional activities Influence guidelines
QuantiFERON-TB: Drive commercial success through targeted global actions
Sample to Insight
Investor presentation Q4 2018 22Next-generation sequencing
QIAseq FastSelect: Solving a critical obstacle in RNA sequencing Q3 2018 highlights
Depletes background of highly abundant RNA that is of low scientific value On track to achieve $140 million in 2018 NGS sales
Selectively enriches RNA of interest
Generates RNA-seq libraries only containing RNA of interest Universal NGS portfolio
Breakthrough technology with QIAseq
FastSelect for RNA sequencing
Number of Procedure steps Procedure time [min]
Strengthens QIAGEN’s industry-leading portfolio
40 140
of sequencing solutions for any sequencer
35 120
30
GeneReader NGS System
100
25
Launch of two panels using Digital NGS
80 80% to deliver more powerful genomic insights
20
1 less time
step only 60 – QIAact AIT DNA UMI Panel: Broadening
15
coverage to 30 genes and >850 variants
40
10
– QIAact BRCA Advanced UMI Panel: Analyzing
20
5 BRCA1, BRCA2, TP53 and PTEN genes
0 0
Other QIAseq Other QIAseq
FastSelect FastSelect
QIAGEN solutions providing breakthrough technologies to help disseminate next-generation sequencing
UMI – Unique molecular indices
Sample to Insight
Investor presentation Q4 2018 23GeneReader NGS System
Ease of use Unique automation Reliable results Data interpretation
QIAcube® GeneRead QIAcube® GeneReader™ Bioinformatics portfolio
1 2 3 4 5
First complete Predictable Actionable Expertise Flexibility to
NGS workflow costs insights and service fit needs
The world’s first complete Sample to Insight NGS solution for actionable results
Sample to Insight
Investor presentation Q4 2018 24GeneReader NGS System
QIAGEN Target customer requirements Comp. I Comp. T
Actionability(1) 100% 100% 70% 80%
Minimum Optimum
Integration of bioinformatics 100% 70% 80%
Strength of Knowledge Base, # publications >30k Third party >1k
Actionable variants detected in panel >700 500 600
Analytical performance 100% 100% 70% 80%
Minimum Optimum
>35 to >60
Accuracy (Q-score) UMI 30 25
Read length (base pairs) 150 2x300 600
Integration and in-process controls 100% 70% 80%
Throughput range of tumor panel(2) 200-3,000 250-1,500 300-1,000 ≥1,000
Minimum Optimum
Data output (gigabases) 6 15 15
Sample to result turnaround time (days) 5 4 3
Time to go live (months) 1 3-9 3-9
Meeting and exceeding target requirements with strong competitive position
(1) Based on 2 use case scenarios: a) QIAact AIT vs. AmpliSeq Hotspot vs. Tumor 15; b) QIAact Lung vs. Oncomine Lung vs. Tumor 15
(2) Based on price per sample analysis incl. consumables, hardware and software (no service) for use-case a): QIAact AIT vs. AmpliSeq Hotspot vs. Tumor 15
UMI – Unique Molecular Indices
Sample to Insight
Investor presentation Q4 2018 25GeneReader NGS System
NGS market by application Clinical research market throughput(1)
Share of Large WES / Majority of use is
Panels
No. of laboratories
market panels WGS in the mid to low
throughput
Research 80% 20% 40% 40%
Average
Clinical research throughput
20% 70% 20% 10%
and diagnostics
0 250 500 750 1.000 1.500 2.000 2.500
Samples per year
Throughput per small benchtop system ($150 throughput needs of panel
market very well
Panels panels WES
Higher consumable
pull-through for Comp. T
Large
~$40 clinical labs Comp. I
Clinical GeneReader
Research
Research Clinical research
research
and
anddiagnostics
diagnostics Low Medium High
Throughput
GeneReader targeting a distinct and highly attractive market segment
(1) Including pathology market (2) Based on price per sample analysis incl. consumables, hardware and software (no service) for use-case:
QIAact AIT vs. AmpliSeq Hotspot vs. Tumor 15 WES – Whole exome sequencing WGS – Whole genome sequencing
Sample to Insight
Investor presentation Q4 2018 26Natera and QIAGEN collaboration
GeneReader NGS System
Long-term partnership for development of cutting-edge genetic testing assays
Joint development of NGS-based cell-free NIPT assay
Designed for GeneReader NGS System
Powerful bioinformatics integrating Natera’s Constellation cloud platform and QIAGEN’s QCI (QIAGEN Clinical Insight)
Fully integrated GeneReader workflow designed to make new NIPT assay accessible for any lab around the world
Building on Natera’s expertise in reproductive genetics and non-invasive cell-free DNA testing
Providing access to genetic testing across several applications, including prenatal screening
Fully integrated workflow based on a simple blood sample
Broadening value and utility of GeneReader beyond current oncology focus
QIAGEN and Natera to establish and fully validate GeneReader solution
Natera’s leading test portfolio to be added to QIAGEN’s fully integrated Sample to Insight NGS workflow
Transaction details include QIAGEN paying $40 m in upfront licensing fees and prepaid royalties in Q1 2018 as well as up to $10 m in future milestone payments
Sample to Insight
Investor presentation Q4 2018 27Natera and QIAGEN collaboration
Clinical molecular testing market by application(1) QIAGEN Partnership Natera
(In $ billions)
3.4
2.1 2.7
1.4 1.6 Liquid biopsy Cell-free DNA
2.2 Oncology platform technologies NIPT expertise
2.1 2.5
0.8 1.0 1.6
2.4 NIPT NGS assay Panorama assay
platform technologies Test design
0.5 0.5 0.5 0.6 0.6 Rare
diseases Fully integrated NGS NIPT / NGS
workflow Expertise
1.3 1.4 1.5 1.7 1.9 Virology /
Genotyping
4.6 Panorama
3.0 3.7 Informatics
2.1 2.4 Sexually-transmitted / informatics
Infectious diseases
13.0
10.8 IVD IVD
8.7 manufacturing manufacturing
6.1 6.9 Molecular
testing
Global Studies, validations and
5.3
distribution clinical marketing
2015 2016 2018 2020 2022
Current technologies Next-generation sequencing
Joining forces to provide customers with actionable and potentially life-changing clinical insights
(1) Source: QIAGEN analysis NIPT – Non-invasive prenatal testing
Sample to Insight
Investor presentation Q4 2018 28Personalized Healthcare
Immuno-oncology: Unleashing the immune system to cure cancer Q3 2018 highlights
QIAseq Tumor Mutational Burden Panel Launch of QIAseq tumor mutational burden panel
Featuring most advanced I-O related biomarkers
Detecting TMB, MSI, SNVs, Indels via Digital NGS
Designed to run on any NGS platform
Expanding QIAGEN solutions for immuno-oncology
Further expansion of partnerships with pharma to
develop companion diagnostics for I-O drugs
QIAGEN Clinical Insight (QCI) bioinformatics
software expands to support I-O research
FDA approval for therascreen EGFR kit to guide
use of new lung cancer drug VIZIMPRO®
Immuno-oncology momentum underscored by
2018 Nobel Prize in Medicine
Strengthening Companion Diagnostics portfolio with new NGS TMB panel and FDA approval
(1) Source: "School Basic Survey" (Ministry for education, culture, sports, science and technology: http://www.mext.go.jp/b_menu/toukei/chousa01/kihon/1267995.htm)
I-O – Immuno-oncology TMB – Tumor mutation burden MSI – Microsatellite instabilities SNVs – Single nucleotide variants Indels – Insertions or deletions CDx – Companion diagnostics
Sample to Insight
Investor presentation Q4 2018 29QIAsymphony
QIAGEN’s flagship automation platform Q3 2018 highlights
Strong momentum toward achieving 2018 target of
>2,300 cumulative placements
High single-digit CER growth pace for related
consumables
Dedicated workflow automation for QIAGEN’s
gold standard liquid biopsy kits
QIAsymphony: Gold standard in molecular testing for Molecular Diagnostics and Life Science customers
Sample to Insight
Investor presentation Q4 2018 30Differentiated Technologies
Enhancing the scientific understanding of microbial communities Q3 2018 highlights
Strengthening leadership in liquid biopsy with
dissemination of technology into clinical applications
Solid double-digit growth for microbiome Sample to
Insight solutions
Ongoing expansion of POWER portfolio for
extraction of DNA from most complex samples
Proven ability to integrate cutting-edge breakthroughs into Sample to Insight workflows
Sample to Insight
Investor presentation Q4 2018 31Agenda
Introducing QIAGEN
Portfolio review
Full-year 2017 results
Q3 2018 results
Appendix
Sample to Insight
Investor presentation Q4 2018 322017: Quarterly and full-year income statement summary
(In $ millions, unless indicated)
(Diluted EPS in $ per share) Q1 2017 Q2 2017 Q3 2017 Q4 2017 FY 2017
Net sales 307.7 349.0 364.0 396.9 1,417.5
Adjusted net sales 308.3 349.6 364.4 397.1 1,419.4
Gross profit 195.8 224.6 240.9 261.3 922.6
Gross profit margin 64% 64% 66% 66% 65%
Adjusted gross profit 217.5 246.8 258.7 280.2 1,003.2
Adjusted gross profit margin 71% 71% 71% 71% 71%
Operating income 23.8 22.4 63.9 43.4 153.4
Operating margin 8% 6% 18% 11% 11%
Adjusted operating income 63.8 88.0 97.9 121.7 371.5
Adjusted operating margin 21% 25% 27% 31% 26%
Tax rate NM NM 6% NM NM
Adjusted tax rate 18% 17% 19% 17% 18%
Net income (loss) 17.7 14.0 48.5 -39.7 40.4
Adjusted net income 50.8 68.7 75.5 100.1 295.3
Diluted EPS(1) 0.08 0.06 0.21 -0.18 0.17
Adjusted diluted EPS ($ per share) 0.22 0.30 0.32 0.43 1.27
Diluted shares outstanding for EPS calculation(1) 234.9 232.7 232.7 231.8 233.0
(1) Reported diluted EPS for Q4 2017 based on basic shares of 226.6 million.
NM - Not meaningful Table may have rounding differences. All adjusted figures exclude restructuring charges
Sample to Insight
Investor presentation Q4 2018 33Agenda
Introducing QIAGEN
Portfolio review
Full-year 2017 results
Q3 2018 results
Appendix
Sample to Insight
Investor presentation Q4 2018 34Q3 2018: Overview
1 Solid Q3 performance and on track to achieve 2018 outlook Q3 and 9M net sales Q3 and 9M adjusted EPS(1,2)
+4% total net sales growth (+6.5% CER vs. ~+6% CER outlook) (In $ millions, at actual rates) (In $ per share)
$0.35 adjusted EPS ($0.36 CER vs. ~$0.33-0.34 CER outlook)
+6.4% CER
28% adjusted operating income margin, 1.5 percentage points rise at CER
Free cash flow rises 21% to $176.7 million in first nine months 1,098.7
1,020.7 0.93
0.84
+6.5% CER
2 Advancing our Sample to Insight portfolio
QuantiFERON-TB: Double-digit CER growth, improving workflow efficiency 0.32 0.35
364.0 377.9
QIAstat-Dx: Rapidly expanding footprint, preparing for U.S. entry in 2019
QIAsymphony: Strong placement rate reaffirms 2018 goal of >2,300 instruments
Q3 Q3 9M 9M Q3 Q3 9M 9M
NeuMoDx: QIAGEN gains access to disruptive technology for integrated PCR Third Quarter Nine Months Third
2017 2018 2017 2018 2017Quarter
2018 Nine
2017Months
2018
NGS: New UNGS and GeneReader solutions, reaffirm 2018 goal of >$140 m
Outlook – As of October 29, 2018
Q4 2018 FY 2018
3 2018 outlook: Raising full-year adj. EPS, reaffirming full-year sales Net sales growth (CER) ~ +6-7% ~ +6-7%
Raising adjusted EPS(1) target to ~$1.33-1.34 CER vs. prior ~$1.31-1.33 Anticipated currency impact(3) ~ −4 p.p. ~ −1 p.p.
Reaffirming ~+6-7% CER target for total net sales growth ~$0.39-0.40 ~$1.33-1.34
Adj. diluted EPS (CER)(1)
RAISED
Anticipated currency impact(3) ~ −$0.01 ~ −$0.02
(1) Adjusted figures exclude restructuring charges and other items detailed in reconciliation tables.
(2) Weighted number of diluted shares (Q3 2018: 235.2 million, Q3 2017: 232.7 million; 9M 2018: 233.8 million, 9M 2017: 233.4 million).
(3) Based on currency rates as of October 26, 2018.
CER – Constant exchange rates p.p. – percentage points PCR – Polymerase chain reaction NGS – Next-generation sequencing UNGS – Universal NGS
Sample to Insight
Third quarter and first nine months 2018 results 35Q3 and 9M 2018: Product type and customer class
Q3 2018 net sales: $377.9 million 9M 2018 net sales: $1,098.7 million
Sales (In $ m) % CER change % of sales Sales (In $ m) % CER change % of sales
Consumables and related revenues $331 +6% 88% $971 +6% 88%
Instruments $46 +11% 12% $127 +7% 12%
Molecular Diagnostics(1) $189 +9% 50% $537 +9% 49%
Applied Testing $35 +1% 9% $98 -1% 9%
Pharma $71 +5% 19% $216 +5% 20%
Academia $83 +5% 22% $247 +4% 22%
Molecular Diagnostics Applied Testing Pharma Academia
Q3 2018: Robust double-digit CER Q3 2018: Underlying mid-single-digit Q3 2018: Mid-single-digit CER growth Q3 2018: Double-digit CER growth in
growth in instrument sales with high CER growth excluding divestment of in consumables along with largely instruments and modest single-digit
single-digit CER gains in consumables, veterinary assays in early 2018, led by unchanged instrument sales, highest CER gains in consumables, Asia-
led by QuantiFERON-TB and high-single expansion in Human ID / forensics growth rate in Americas region Pacific has strongest performance
digit growth in QIAsymphony
consumables
Q3 2018: Molecular Diagnostics leads customer classes with 9% CER growth, solid gains in Life Sciences
(1) CDx co-development sales (Q3 2018: $17 million, +49% CER; 9M 2018: $39 million, +54% CER); U.S. HPV sales (Q3 2018: $6 million vs. Q3 2017: $8 million; 9M 2018: $15 million vs. 9M 2017: $19 million)
Sales figures and sales contributions at actual FX rates Growth rates at CER Tables may contain rounding differences CDx – Companion diagnostics
Sample to Insight
Investor presentation Q4 2018 36Q3 and 9M 2018: Geographic regions
Q3 2018 net sales: $377.9 million 9M 2018 net sales: $1,098.7 million
Sales (In $ m) % CER change % of Sales (In $ m) % CER change % of sales
sales
Americas $186 +9% 49% $524 +10% 48%
Europe / Middle East / Africa $111 +1% 30% $347 +3% 32%
Asia-Pacific / Japan $80 +11% 21% $225 +4% 20%
Americas Europe / Middle East / Africa Asia-Pacific / Japan
Q3 2018: Ongoing double-digit CER growth across Q3 2018: Improving CER trends in Germany, Turkey, Q3 2018 : +19% CER region growth excluding South
key countries – including U.S. and Mexico – supported Switzerland and Italy against weaker trends in France, Korea QuantiFERON-TB tender in 2017, growth led by
by gains in Molecular Diagnostics and Life Sciences Benelux region and Middle East China at double-digit CER rate and gains in Japan
Q3 2018: Americas region (+9% CER) and top 7 emerging markets (+19% CER) lead regional performance
Top 7 EGM (Q3 2018: +19% CER / 17% of sales; 9M 2018: +10% CER / 16% of sales); Rest of the world (Q3 2018 and 9M 2018: Less than 1% of net sales)
Sales figures and sales contributions at actual FX rates Growth rates at CER Tables may contain rounding differences
Sample to Insight
Investor presentation Q4 2018 37Q3 and 9M 2018: Balance sheet and cash flow
Balance sheet data
(As of September 30 ) 2018 2017 Leverage ratio(1)
Group liquidity (In $ millions) 921 975
Net debt (In $ millions) 848 774
3.3
Shareholder equity ratio 48% 50%
Leverage ratio(1) 1.6x 1.5x
2.2
1.6 1.5 1,6
1.3 1.2
1.1
Cash flow 0.9 0.9
(In $ millions) 9M 2018 9M 2017 0.4
Net cash provided by 0.2
249.0 210.7 -0.1
operating activities(2)
Purchases of property,
-72.3 -64.6 2006 2008 2010 2012 2014 2016 Q3
plant and equipment
2018
Free cash flow(2)(3) 176.7 146.1
2007 2009 2011 2013 2015 2017
9M 2018: Operating cash flow rises 18% to $249 million, includes $30 million prepayment to Natera
(1) Leverage ratio is calculated on trailing four quarters as net debt / adjusted EBITDA.
(2) Net cash provided by operating activities for 9M 2018 included $30 million payment for pre-paid royalties for Natera partnership.
(3) Quarterly free cash flow (Q3 2018: $53.3 million vs. Q3 2017: $54.5 million)
Sample to Insight
Investor presentation Q4 2018 38Q3 and 9M 2018: Reconciliation adjusted results
In $ millions (Except EPS) Net Gross Operating Pretax Income Tax Net Diluted
(unaudited) sales profit income income tax rate income EPS
Third quarter 2018
Reported results 377.9 256.8 77.0 72.2 -11.9 16% 60.3 0.26
Adjustments
Business integration, acquisition and restructuring-related
0.3 6.0 6.0 -1.8 4.2 0.02
items (including litigation)
Purchased intangibles amortization 13.2 22.6 22.6 -5.9 16.7 0.07
Non-cash interest expense charges 8.4 8.4 0.03
Other special income and expense 4
-8.5 0.4 -8.1 -0.03
Total adjustments 13.5 28.6 28.5 -7.3 21.2 0.09
Adjusted results 377.9 270.3 105.6 100.7 -19.2 19% 81.5 0.35
First nine months 2018
Reported results 1,098.7 736.2 178.3 157.3 -27.9 18% 129.4 0.55
Adjustments
Business integration, acquisition and restructuring-related 0.1 0.9 32.3 32.3 -8.6 23.7 0.10
items (including litigation)
Purchased intangibles amortization 43.6 73.3 73.3 -19.0 54.3 0.23
Non-cash interest expense charges 24.9 24.9 0.11
Other special income and expense -16.7 2.6 -14.1 -0.06
Total adjustments 0.1 44.5 105.6 113.8 -25.0 88.8 0.38
Adjusted results 1,098.8 780.7 283.9 271.1 -52.9 20% 218.2 0.93
Table may have rounding differences. Net income and diluted EPS based on net income.
Sample to Insight
Investor presentation Q4 2018 39Q4 and FY 2018: Outlook and assumptions
As of October 29, 2018 Q4 2018 outlook Full-year 2018 outlook
Net sales ~+6-7% CER ~+6-7% CER
~$0.39-0.40 CER ~$1.33-1.34 CER
Adjusted EPS(1)
(Prior year: $0.43) (Prior year: $1.27)
Amortization of acquired intellectual property
~24 ~97
(In $ millions)
Restructuring-related items
~2 ~9
(In $ millions)
Business integration and acquisition-related items
~5 ~30
(In $ millions)
Adjusted tax rate
~20% ~20%
(In %)
Weighted average number of diluted shares outstanding
~233 million ~234 million
(Based on $36.00 share price)
CER – Constant exchange rates
(1) QIAGEN reports adjusted results, as well as results on a constant exchange rate (CER) basis, and other non-U.S. GAAP figures to provide additional insight into its performance. These results include adjusted net sales,
adjusted gross profit, adjusted operating income, adjusted net income attributable to owners of QIAGEN N.V. and adjusted diluted EPS. Adjusted results are non-GAAP financial measures that QIAGEN believes should be
considered in addition to reported results prepared in accordance with GAAP, but should not be considered as a substitute. QIAGEN believes certain items should be excluded from adjusted results when they are outside of
ongoing core operations, vary significantly from period to period, or affect the comparability of results with competitors and its own prior periods. Furthermore, QIAGEN uses non-GAAP and constant currency financial
measures internally in planning, forecasting and reporting, as well as to measure and compensate employees. QIAGEN also uses adjusted results when comparing current performance to historical operating results, which
have consistently been presented on an adjusted basis.
Every $1.00 change in market price per share of common stock above $32.06 share price results in an increase / decrease of ~700,000 in dilutive shares due to call-spread overlay (CSO) related to 2019 and 2021 convertible
notes, while every $1.00 change above $50.97 share prices results in increase of ~600,000 in dilutive shares due to 2023 convertible notes.
Sample to Insight
Investor presentation Q4 2018 40Agenda
Introducing QIAGEN
Portfolio review
Full-year 2017 results
Q3 2018 results
Appendix
Sample to Insight
Investor presentation Q4 2018 41Global reach into the most attractive geographic markets
Aarhus
Manchester
Hilden
Venlo
Waltham
Redwood City Germantown
Shanghai
Shenzhen
Hilden, Germany
Europe
Germantown, Maryland
Americas Shanghai
Asia-Pacific
Sample to Insight
Investor presentation Q4 2018 42Executive Committee
CEO Commercial Operations
Peer Schatz Manuel O. Méndez
Executive Committee
Molecular Diagnostics CFO
Thierry Bernard Roland Sackers
Life Science Bioinformatics
Thomas Schweins Jonathan Sheldon
Human Resources
Annette Koch
Development(1)
Business Development
Business
Jean-Pascal Viola
Solid leadership team with experience and an effective structure
1) Business Development is a strategic function reporting directly to CEO, but not included in EC.
Sample to Insight
Investor presentation Q4 2018 43Employees as of September 30, 2018
Europe / Asia Pacific / Total Total
Americas Change
Middle East / Africa Japan / ROW Q3 2018 Q3 2017
Production 277 639 143 1,059 996 6%
R&D 233 773 50 1,056 978 8%
Sales 561 748 622 1,931 1,888 2%
Marketing 77 150 69 296 265 12%
Administration 88 326 117 531 483 10%
Total 1,236 2,636 1,001 4,873 4,610 6%
Headcount information is made using certain assumptions regarding role and function. During Q3 2018, these assumptions were updated and their classifications were changed accordingly.
Sample to Insight
Investor presentation Q4 2018 44Your contacts
Download the QIAGEN IR App
John Gilardi Dr. Sarah Fakih Alexandra Koenig
Vice President Corporate Director Coordinator
Communications and IR Investor Relations Investor Relations
Phone: +49 2103 29 11711 Phone: +49 2103 29 11457 Phone: +49 2103 29 11709
Mobile: +49 152 018 11711 Mobile: +49 152 018 11457 Mobile: +49 152 018 11709
E-mail: john.gilardi@qiagen.com E-mail: sarah.fakih@qiagen.com E-mail: alexandra.koenig@qiagen.com
E-mail: ir@qiagen.com www.linkedin.com/company/qiagen twitter.com/QIAGEN
Internet: ir.qiagen.com www.facebook.com/QIAGEN www.youtube.com/user/QIAGENvideos
Share information Calendar
NYSE: QGEN Q4 2018 results February 2019
Frankfurt: QIA Q1 2019 results May 2019
ISIN / CUSIP: NL0012169213 / N72482 123 Annual General Meeting June 2019
WKN: A2D KCH Q2 2019 results July 2019
Sample to Insight
Investor presentation Q4 2018 45You can also read