HELLA GMBH & CO. KGAA - Q1 FY 2017/2018 COMPANY PRESENTATION
←
→
Page content transcription
If your browser does not render page correctly, please read the page content below

HELLA GmbH & Co. KGaA
                        Company Presentation

                        Q1 FY 2017/2018

HF-7761DE_C (2013-10)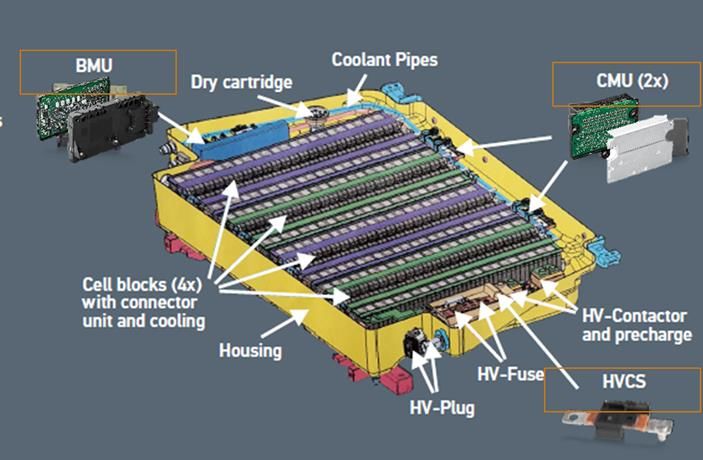
Disclaimer
This document was prepared with reasonable care. However, no responsibility can be assumed for the correctness
of the provided information. In addition, this document contains summary information only and does not purport to be
comprehensive and is not intended to be (and should not be construed as) a basis of any analysis or other
evaluation. No representation or warranty (express or implied) is made as to, and no reliance should be placed on,
any information, including projections, targets, estimates and opinions contained herein.

This document may contain forward-looking statements and information on the markets in which the HELLA Group is
active as well as on the business development of the HELLA Group. These statements are based on various
assumptions relating, for example, to the development of the economies of individual countries, and in particular of
the automotive industry. Various known and unknown risks, uncertainties and other factors (including those
discussed in HELLA’s public reports) could lead to material differences between the actual future results, financial
situation, development or performance of the HELLA Group and/or relevant markets and the statements and
estimates given here. We do not update forward-looking statements and estimates retrospectively. Such statements
and estimates are valid on the date of publication and can be superseded.

This document contains an English translation of the accounts of the Company and its subsidiaries. In the event of a
discrepancy between the English translation herein and the official German version of such accounts, the official
German version is the legal valid and binding version of the accounts and shall prevail.

 2                                               HELLA Company Presentation | Q1 FY 2017/18
HELLA Company Presentation Q1 FY 2017/18
Outline

■ HELLA Financial Highlights Q1 FY 2017/18

■ HELLA Financial Results Q1 FY 2017/18

■ Outlook

BACKUP

 3                                HELLA Company Presentation | Q1 FY 2017/18

Positive sales growth and EBIT increase in Q1 FY 2017/18
Financial Highlights Q1 FY 2017/18

                                   ■ HELLA Group currency adjusted sales grew by 5.8% YoY to 1.6
         Sales
                                     bill. EUR

                                   ■ Adj. Gross Profit margin at 27.7% (+0.2%-points YoY)
   Profitability                   ■ Adj. EBIT +7 mill. EUR (+5.6% YoY) at 125 mill. EUR
                                   ■ Adjusted EBIT margin +0.1pp to 7.7%

                                   ■ Adjusted Free Cash Flow from operating activities increased by
      Liquidity                      20 mill. EUR (+64% YoY) to 50 mill. EUR mainly due to higher
                                     funds from operations

Note: Adjustments including restructuring expenses in Q1 FY 16/17 and Q1 FY 17/18. Please note that where sums and percentages in the presentation have been rounded,
differences may arise as a result of commercial rounding.
  4                                                                   HELLA Company Presentation | Q1 FY 2017/18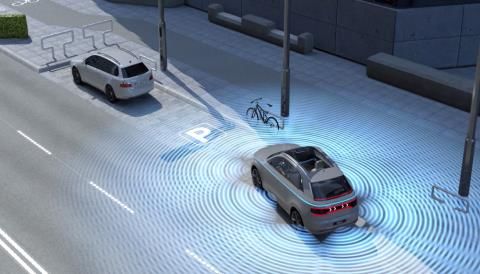
HELLA top line growth with expected development in Q1 FY 17/18
Financial Highlights Q1 FY 2017/18
HELLA Group sales (EUR millions) Comment
■ Currency adjusted growth HELLA
Group at 5.8%
-13 ■ Reported sales growth HELLA Group
at 4.9% (increased by 77 mill. EUR,
+5.8% 90
4.9%
+ to 1,629 mill. EUR)
Automotive + 5.9% to 1,244 mill. EUR.
Demand for energy management
1,629 products, radar solutions and advanced
1,553 lighting systems drives business. Lighting
still with ongoing ramp-ups
Aftermarket external sales +2.0%,
positive demand from Independent
Q1 FY 16/17 adj. growth FX Q1 FY 17/18 Aftermarket and Wholesale
Special Applications +12.3% to 100 mill.
EUR, positive development in agriculture
and constructions as well as over-
proportional demand in Australia
5 HELLA Company Presentation | Q1 FY 2017/18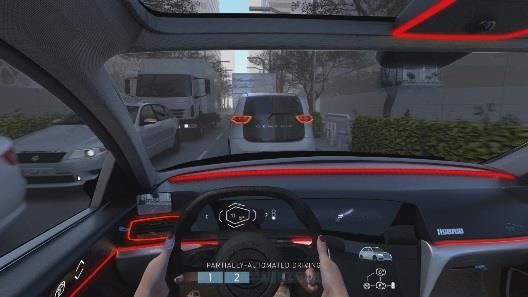
Automotive outperforming LVP in all regions
Financial Highlights Q1 FY 2017/18
HELLA Automotive external sales by region (in EUR millions)

Global                                                      Europe                                                 North & South America                                     Asia & RoW
                                           1,227                             762             754            762                                                       264                                                   201
             1,138          1,163
                                                              665                                                                                     228                                                   181
  979                                                                               -1.1%           +1.1%                             208                                                    167
                        +2.2%          +5.5%
                                                                    +14.7%                                                                                  +15.9%            143                                  +10.8%
        +16.2%                                                                                                        171                    +9.4%                                                 +8.2%
                                                                                                                                                                                    +17.2%
                                                                                                                            +21.4%
                 537                                  646

 Q1 FY       Q1 FY          Q1 FY          Q1 FY             Q1 FY          Q1 FY           Q1 FY          Q1 FY     Q1 FY           Q1 FY           Q1 FY           Q1 FY   Q1 FY          Q1 FY       Q1 FY           Q1 FY
 14/15       15/16          16/17          17/18             14/15          15/16           16/17          17/18     14/15           15/16           16/17           17/18   14/15          15/16       16/17           17/18

Light vehicle production (in million units)
Global                                                      Europe                                                 North & South America                                     Asia & RoW
                                               22.0                                          4.9            4.9                       5.2             5.2                                                                  11.6
                                21.8
                                                                                                                                                                                                            11.3
                                       +1.0%                                 4.8                   +0.5%                                     +0.2%
                                                                                                                      5.1                                                                                          +2.9%
                 20.5                                                              +3.2%                                                                                     10.5
  20.4                                                        4.5                                                                                                     5.0                   10.3
                                                                                                                             +2.3%
         +0.6%          +6.2%
                                                                    +5.1%                                                                                    -3.6%                  -2.5%          +10.3%

 Q1 FY       Q1 FY          Q1 FY          Q1 FY             Q1 FY       Q1 FY              Q1 FY       Q1 FY        Q1 FY           Q1 FY           Q1 FY           Q1 FY   Q1 FY       Q1 FY          Q1 FY           Q1 FY
 14/15       15/16          16/17          17/18             14/15       15/16              16/17       17/18        14/15           15/16           16/17           17/18   14/15       15/16          16/17           17/18

HELLA Automotive growth vs. market (Light vehicle production growth):

           +15.9%          -4.0%           4.5%                             +9.5%       -4.3%           0.6%                     +19.1%              +9.2%      +19.5%                  +19.6%          -2.1%           7.9%

 Please note that where sums and percentages in the presentation have been rounded, differences may arise as a result of commercial rounding.
 Source: HELLA; IHS (as of September 2017)

   6                                                                                                  HELLA Company Presentation | Q1 FY 2017/18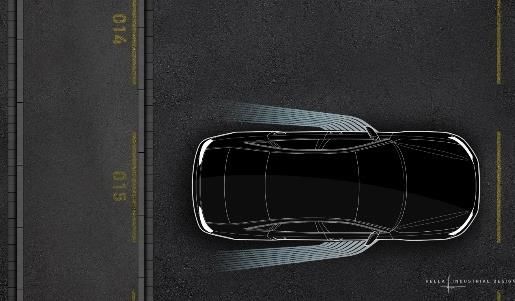
HELLA Company Presentation Q1 FY 2017/18
Outline

■ HELLA Financial Highlights Q1 FY 2017/18

■ HELLA Financial Results Q1 FY 2017/18

■ Outlook

BACKUP

 7                                HELLA Company Presentation | Q1 FY 2017/18

GPM increase due to stronger Aftermarket and Special Applications
Financial results Q1 FY 2017/18
Gross Profit Highlights
EUR millions
452 ■ Adj. Gross Profit increased by 24
428
399 mill. EUR (+5.6%) to 452 mill. EUR
350 +24
+29 Automotive + 4.2% to 306 mill. EUR
+49
Aftermarket + 2.2% to 105 mill. EUR
Special Applications +33.1% to 41
mill. EUR
Q1 FY 14/15 Q1 FY 15/16 Q1 FY 16/17 Q1 FY 17/18
Gross Profit margin Highlights
% sales
27.7
■ Adj. Gross Profit margin improved
27.6
by 0.2%-points to 27.7%
+0.2
26.6 26.7 increased margins in Aftermarket
+0.1 +0.9 and Special Applications
ongoing capacity increase with
initially lower utilization negatively
Q1 FY 14/15 Q1 FY 15/16 Q1 FY 16/17 Q1 FY 17/18 affected GPM in Automotive
8 HELLA Company Presentation | Q1 FY 2017/18
Continuous high R&D expenses to secure future growth
Financial results Q1 FY 2017/18
R&D expenses Highlights
EUR millions
162 ■ Absolute R&D expenses increased
3.7% 154
140 by 8 mill. EUR (+5.5% YoY) to
+8
117 3.4% +14 162 mill. EUR, mainly:
+23 booked business
exploring potential of market trends
enhancements of product portfolio
Q1 FY 14/15 Q1 FY 15/16 Q1 FY 16/17 Q1 FY 17/18
R&D expenses ratio Highlights
% sales
10.0
■ Q1 FY 17/18 ratio nearly constant at
9.9
8.9 9.3 10% due to high level of absolute
8.1% 0.0
+0.5 +0.6 R&D expenses
7.8%
Q1 FY 14/15 Q1 FY 15/16 Q1 FY 16/17 Q1 FY 17/18
9 HELLA Company Presentation | Q1 FY 2017/18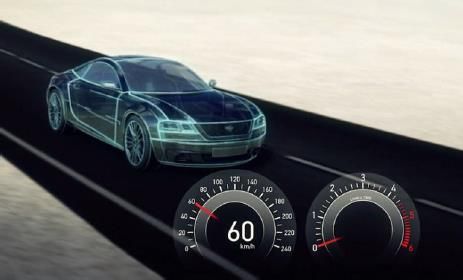
Relatively stable development of SG&A costs
Financial results Q1 FY 2017/18
Adjusted SG&A expenses Highlights
EUR millions
176
■ Only slight increase (+ 6 mill. EUR,
3.7%
3.7% 166 170
150
+ 3.3%) of SG&A costs mainly due to
+4 +6 increase in distribution expenses:
3.4%
+16 3.4%
distribution expenses +5 mill. EUR
(+4.5%) to 128 mill. EUR driven by
Aftermarket business extension and
higher logistic costs in Automotive in
Eastern Europe
Q1 FY 14/15 Q1 FY 15/16 Q1 FY 16/17 Q1 FY 17/18
8.1%
Adjusted SG&A expenses ratio Highlights
% sales
7.8% ■ SG&A ratio -0.2%-points to 10.8%,
11.4 11.1 11.0 10.8 ratio of structural costs shows in
8.1% -0.3 -0.1 -0.2 general a stable development
7.8% distribution cost ratio constant at 7.9%
administrative cost ratio -0.2%-points
to 3.3%
Q1 FY 14/15 Q1 FY 15/16 Q1 FY 16/17 Q1 FY 17/18
adjusted other income and expenses
-0.1%-points to 0.4%
10 HELLA Company Presentation | Q1 FY 2017/18Adjusted EBIT and EBIT margin above prior-year’s level
Financial results Q1 FY 2017/18
Adjusted EBIT Highlights
EUR millions
125 ■ Adjusted EBIT increased by 7mill.
118
101
EUR (+5.6%) to 125 mill. EUR
97 +7
+17 increase in Gross Profit by 24 mill.
+4
EUR (+5.6%)
higher R&D (+8 mill. EUR, +5.5%)
decline in JV income by 3 mill. EUR
(-21.8%)
Q1 FY 14/15 Q1 FY 15/16 Q1 FY 16/17 Q1 FY 17/18
Adjusted EBIT margin Highlights
% sales
■ Adj. EBIT margin increased by
7.6 7.7
7.4 0.1%-points to 7.7%:
6.8 +0.1
-0.6 +0.9 slight increase of GPM by 0.2%-
points
higher R&D expenses with increase
of ratio by 0.1%-points
Q1 FY 14/15 Q1 FY 15/16 Q1 FY 16/17 Q1 FY 17/18 decreased contribution of JVs
affected profitability negatively by
0.2%-points
11 HELLA Company Presentation | Q1 FY 2017/18P&L including reconciliation
Financial results Q1 FY 2017/18
Quarterly comparison Comments
HELLA GROUP Q1 Q1 ■ Reported EBIT Q1 slightly
FY 16/17 FY 17/18 negatively impacted by
in EUR mill. restructuring expenses in
Gross Profit reported 427.8 451.1 Germany
Restructuring 0.0 0.6
■ Net financial result decreased
adjusted 427.8 451.7 due to the funding of activities in
Other income and expenses reported
growth regions at higher local
5.3 5.1
interest rates
Restructuring 1.7 1.2
adjusted 7.1 6.2 ■ Earnings for the period
decreased slightly despite EBIT
EBIT reported 116.5 123.2 increase; higher tax payments
Restructuring 1.7 1.8 after low comparable tax rate in
adjusted 118.3 124.9 Q1 PY
Net financial result -10.1 -11.9 ■ EPS decreased by 1 Cent to
0.74 EUR
Taxes -23.0 -28.4
Earnings for the period 83.5 82.9
Earnings per share (EUR) 0.75 0.74
12 HELLA Company Presentation | Q1 FY 2017/18Adj. Free Cash Flow from operating activities increased due to
higher funds from operations
Financial results Q1 FY 2017/18
Adj. FCF from operating activities Highlights
EUR millions
+562.7%
■ Adj. Free Cash Flow from
-54.2%
67
operating activities increased by 20
+63.8%
mill. EUR to 50 mill. EUR, mainly:
50
increased funds from
31 operations
10 lower Working Capital
consumption
Q1 FY 14/15 Q1 FY 15/16 Q1 FY 16/17 Q1 FY 17/18
Net CAPEX Highlights
EUR millions
159 ■ Net CAPEX increased by 39 mill.
145
EUR to 145 mill. EUR
106 106
■ Continuous investments in
-52 +-1 +39
customer-specific equipment, start
of capacity extension
■ Reimbursements decreased by 16
Q1 FY 14/15 Q1 FY 15/16 Q1 FY 16/17 Q1 FY 17/18 mill. EUR to 11 mill. EUR depending
on project launches
13 HELLA Company Presentation | Q1 FY 2017/18Automotive segment with increasing growth
Financial results Q1 FY 2017/18
+5.9%
+9.9% +2.4% Automotive Sales
1,244
1,147 1,175 ■ Growth of 5.9% with ongoing project ramp-ups
1,044
3.0% 6.3%
547 started in H2 FY 16/17:
537
10.2% 500 646 515
454 demand for energy management products
+1.6% 4.9% and radar drives Electronics
526 +21.4% 638 648 680 demand for LED headlamps in Lighting
65 9 12 17
ongoing growth dynamics expected
Q1 FY 14/15 Q1 FY 15/16 Q1 FY 16/17 Q1 FY 17/18
External Sales Electronics Intersegment Sales
External Sales Lighting
Automotive Profitability
+25.8%
-6.7%
■ Decline of adj. EBIT by 6.7% to 91 mill. EUR:
+1.5% 98
91 capacity increase with initially lower
76 78
utilization level
8.3 increase in R&D to prepare new launches
7.3 7.3
6.8
lower JV contribution due to weakness in
Asian joint ventures
negative FX effects
Q1 FY 14/15 Q1 FY 15/16 Q1 FY 16/17 Q1 FY 17/18
Adj. EBIT Adj. EBIT Margin (% of total sales)
14 HELLA Company Presentation | Q1 FY 2017/18Non Automotive segments with positive contributions
Financial results Q1 FY 2017/18
-1.6% Aftermarket
+2.1%
307
■ External sales growth (+2.0%) due to positive
18.9 19.3
IAM and wholesale business
302
■ Total sales declined by 1.6%, mainly due to new
537 6.2 6.4 allocation between Aftermarket and Special
Applications segments
Q1 FY 16/17 Q1 FY 17/18 Q1 FY 16/17 Q1 FY 17/18 ■ EBIT margin +0.2pp due to increase in GPM
(+1.3%-points) driven by mix effects
+12.3%
+523.1% Special Applications
100 16.0
■ Strong top-line growth (+12.3%):
16.1
increasing demand in Agricultural and
89 2.6
Construction sector
537 other product groups e.g. Trailer also growing
over-proportional growth in Australia
2.9
Q1 FY 16/17 Q1 FY 17/18 ■ Massive profitability increase (>500%)
Q1 FY 16/17 Q1 FY 17/18
strong top line growth
Total Sales EBIT negative effects from the sale of Industries &
EBIT Margin
Airport lighting activities in Q1 FY 16/17
15 HELLA Company Presentation | Q1 FY 2017/18HELLA Company Presentation Q1 FY 2017/18 Outline ■ HELLA Financial Highlights Q1 FY 2017/18 ■ HELLA Financial Results Q1 FY 2017/18 ■ Outlook BACKUP 16 HELLA Company Presentation | Q1 FY 2017/18
Overall market FY 17/18 expected to grow by 1.3% according to IHS
Outlook

                              Expected LVP
Region                                                              Comment
                               (in m units)
                                           +2.6%
                                                                    ■ Continuing growth in 2017/18 expected. Europe
                                                                      excluding Germany expected to grow by 3.9% to
Europe                                      22.4
                                                                      16.5m units, Germany with an expected decline of
                                         FY 17/18
                                                                      1.0% to 5.9m units
                                           +0.1%

                                                                    ■ After weak first half, better growth dynamic in H2
NSA                                         20.8
                                                                      2017/18 expected
                                          FY 17/18

                                           +0.0%
                                                                    ■ After weak first half (-0.6%), China expected to
China                                       27.5                      stay flat in 2017/18, Asia/RoW expected to grow
                                                                      by 1.0% to 50.9m units
                                         FY 17/18

 Global                                   +1.3%                     ■ Overall market expected to grow by 1.3%
                                          +95.8
                                         FY 17/18

Source: IHS Light Vehicle Production (LVP) (as of September 2017)

  17                                                                 HELLA Company Presentation | Q1 FY 2017/18
Company specific development for FY 17/18 confirmed
Guidance
Presuming no serious economic turmoil, we assume a positive development of the
operative HELLA business for FY 2017/18:
Sales growth ■ Growth excluding FX between 5-10%
Adj. EBIT growth ■ Growth between 5-10%
Adj. EBIT margin ■ Margin around 8%
18 HELLA Company Presentation | Q1 FY 2017/18HELLA Company Presentation Q1 FY 2017/18 Outline ■ HELLA Financial Highlights Q1 FY 2017/18 ■ HELLA Financial Results Q1 FY 2017/18 ■ Outlook BACKUP - HELLA at a Glance 19 HELLA Company Presentation | Q1 FY 2017/18
Market and technology leadership as key strategic principles
HELLA at a glance – Overview
KEY FACTS                                                                            KEY FINANCIALS

▪ Founded 1899 in Lippstadt (Germany)                                                in EUR millions and % of sales
▪ Global footprint with around 38,000 employees at more than                                                      FY 2015/16          FY 2016/17     Change
  125 locations in some 35 countries
          ▪ Thereof: 41 research & 28 production sites                                Sales                             6,352           6,585         +3.7%

▪ Integrated business portfolio in Automotive, Aftermarket,                           Adjusted EBIT                      476              534       +12.0%
  and Special Applications                                                            Adjusted EBIT                                                   +0.6%
                                                                                                                        7.5%             8.1%
                                                                                      margin                                                          points
▪ Leading market positions in automotive Lighting and
  Electronics                                                                         Adjusted
                                                                                                                         155              149         -3.9%
                                                                                      Free Cash Flow
▪ One of the top 40 automotive suppliers in the world and
  one of the 100 largest German industrial companies

SALES BY BUSINESS SEGMENT                                                            SALES BY REGION

external sales, fiscal year 2016/2017                                                based on the HQs of HELLA’s customers, fiscal year 2016/2017
                         Special Applications                                                     North & South America
                             €384 million                                                              €1,061 million                        Germany
                                                                                                                                           €2,243 million
                                  6%                                                                                     16%
         Aftermarket
        €1,185 million      18%
                                   €6.6                                                                                      €6.6       34%
                                            43%                                            Asia, Pacific, RoW
                                  billion          Automotive                                                               billion
                                                                                             €1,063 million       16%
                                  group              Lighting                                                               group
                                  sales           €2,788 million                                                            sales
            Automotive       33%
                                                                                                      Rest of Europe            34%
             Electronics
           €2,191 million                                                                              €2,218 million

   20                                                              HELLA Company Presentation | Q1 FY 2017/18
HELLA has shown sustainable profitable growth
since automotive crisis
HELLA at a glance – Sales and EBIT development
SALES ADJUSTED EBIT
in EUR millions and % of sales in EUR millions and % of sales
7% 6,585 534
6,352 9%
5,835 476
5,343 445
4,835 399
4,637
350 8.1
7.5 7.6 7.5
306
7.5
6.3
FY 11/12 FY 12/13 FY 13/14 FY 14/15 FY 15/16 FY 16/17 FY 11/12 FY 12/13 FY 13/14 FY 14/15 FY 15/16 FY 16/17
Adj.* EBIT % sales
▪ Sustainable growth during the last years mainly driven ▪ Continuous EBIT increase despite large
by Automotive investments in global structures and R&D
▪ Aftermarket and Special Applications also with ▪ Overall stable margin level through growth driven
positive growth by technology leadership and increased efficiency
21 HELLA Company Presentation | Q1 FY 2017/18High financial stability ensuring long-term growth perspective
HELLA at a glance – Financial stability
Solid capital structure Strategic flexibility
Leverage (Net debt / EBITDA) Debt and maturity profile*, in millions EUR HELLA has a stable
and solid financial
0.7x fundament which
0.6x 500
0.5x forms the basis for
0.3x 0.3x 300 its future strategic
0.2x plans
105 117
70 Prudent financial
policy throughout
May 12 May 13 May 14 May 15 May 16 May 17 2020 2024 2032 2033 Other
the cycle with
Debt**
leverage < 1.0x
Bond Bond Aflac*** Aflac
Gearing (Net debt / Equity) (2.375%) (1.0%) bond I bond II Financing of long-
0.3x 0.3x 0.3x term growth
strategy secured
Additional Revolving Credit (2022) of Well balanced debt
0.1x 0.1x 0.1x EUR 450m with 10 core banks as back-up portfolio
facility
New issuing
May 12 May 13 May 14 May 15 May 16 May 17 (senior, unsecured
/ bearer debt) for
Capital-market-oriented capital structure with investment grade rating attractive
Good liquidity profile and consistent liquidity management conditions
EUR 102m dividends (0.92EUR/share) paid October 2017 Mid term target:
Leverage < 1.0x
Equity ratio at 39.5% and cash & assets at 1,098 mill. EUR
* As of August, 2017; Euro Bond I: 1,15%, Euro Bond II: 2,375%, Euro Bond III: 1.00% ; Aflac bonds hedged values ** Mostly short term loans and evaluation impact
*** Abbreviation for “American Family Life Insurance Company“
22 HELLA Company Presentation | Q1 FY 2017/18Broad automotive portfolio in strong growing areas
HELLA at a glance – Business Segment Automotive
BUSINESS OVERVIEW* KEY FINANCIALS
Lighting ► #1 market position in LED in EUR millions and % of sales
▪ Headlamps headlamps Europe
▪ Rear Combination Lamps FY 2015/16 FY 2016/17 Change
▪ Small Lamps ► #3-4 global and #1-2 European
▪ Interior Lighting market position in OE passenger
▪ Lighting Electronics External Sales 4,804 4,980 +3.7%
car lighting
Adjusted EBIT** 390 444 +13.8%
Electronics ► #2-3 global and #1-2 European +0.7%
▪ Components market position in defined automotive Adjusted EBIT margin** 8.1% 8.8%
points
▪ Energy Management
▪ Driver Assistance Systems
electronic segments
▪ Body Electronics Ext. Sales Lighting 2,720 2,788 2.5%
▪ Steering
Ext. Sales Electronics 2,084 2,191 5.2%
AUTOMOTIVE SALES BY CUSTOMERS AUTOMOTIVE SALES BY REGIONS
fiscal year 2016/2017 fiscal year 2016/2017
Other*** North & South America
€948 million Germany
€1,906 million
6%
German 19%
OEM 38%
29% €5.0 43% Asia, Pacific, RoW €5.0
Tier X €858 million
billion 17% billion
11%
13% 26%
Asian OEM Rest of Europe
€1,268 million
US OEM
*) All figures related to the selected markets and product categories based on HELLA‘s portfolio, as covered in an external market study commissioned by HELLA (2014)
**) Adjustments including restructuring expenses and supplier default in FY 15/16
***) Including European OEM (ex Germany) and trucks.
23 HELLA Company Presentation | Q1 FY 2017/18Over the last years HELLA was 1st to market with several
technologies which support strong market positions
Innovation Leadership – Automotive
SELECTED INNOVATION HIGHLIGHTS
Advanced LED Headlamps 24 Ghz (NB) Radar Sensors Intelligent Battery Sensors
Global Market Position Global Market Position Global Market Position
#1-2 #1 #2
Milestones Milestones Milestones
2006 Cadillac Escalade Platinum: Full-
LED headlamp (1st to segment) 2009 Audi Q7: Introduction of Lane
Change Assistant (1st Generation) 2005 BMW 5-series: Introduction of
first IBS product (1st Generation)
2010 Audi A8: Full-LED headlamp
with AFS functions (1st to market) 2012 Audi A8: Lane Change Assistant +
Pre-Crash Rear (2nd Generation) 2008 Hyundai Sonata: Rollout of IBS
product in Korea (2nd Generation)
2013 Audi A8: LED Matrix headlamp with
glare-free high beam (1st to market) 2014 VW Golf: Blind-Spot Detect + Rear
Cross Traffic Alert (3rd Generation) 2012 VW Passat: Global VW platform
for IBS product (3rd Generation)
2016 Mercedes E-Class: LED Matrix with
glare-free high beam (1st to market) 2017 Opel Mokka: Lane Change Assist
+ Blind Spot Detect (4th Generation) 2015 Honda Accord: Global platform
for IBS product (4th Generation)
24 HELLA Company Presentation | Q1 FY 2017/18HELLA will benefit in its core business thanks to favorable
positioning along major automotive market trends
Business devisions – Electronic and Lighting
AUTONOMOUS EFFICIENCY & CONNECTIVITY & INDIVIDUALI-
DRIVING ELECTRIFICATION DIGITALIZATION ZATION
MAJOR
AUTOMOTIVE
MARKET
TRENDS
M
M
M
M
I
I
I
I
Selected
Examples
Electronic
portfolio
Camera 77 GHz 48V DC/DC- Battery Particulate Passive
Software Radar Sensor Converter Management Matter Sensor Entry System
System
Lighting
portfolio
Driving Status High Definition Ambient & Relaxing
LED Technology headlamp Interior lighting
Projections
25 HELLA Company Presentation | Q1 FY 2017/18Focus on advanced vision IP and development approaches
to enable roadmap towards autonomous driving
Autonomous Driving – Technology Highlights
Level 0 Level 1 Level 2 Level 3 Level 4 Level 5
Eyes on Eyes on Eyes on Eyes and hands Eyes off Eyes off
Hands on Hands on Hands temporarily off temporarily off Hands off Hands off
Driver Partial Conditional High Full
Only Assisted Automation Automation Automation Automation
Current Assistance Functions (NCAP 2018):
TECHNOLOGY Based on Deep Learning
Camera Software: Vision IP
Traffic Sign Lane Light Source Pedestrian Semantic Semantic Path Visual
Detection Detection Detection Detection Freespace Planning Localization
Conventional computer vision approach
26 HELLA Company Presentation | Q1 FY 2017/18New business model for camera software: Flexible, scalable
approach for realization of autonomous driving functionality
Autonomous Driving – Technology Highlights
TECHNOLOGY
Camera Software: „Software as Product“
Current Market Model HELLA Approach
CLOSED SYSTEM
▪ Proprietary microprocessor with
fixed software package
▪ System-on-chip and vision IP fixed
(„blackbox“ approach)
-
▪ Limited options for integration and
extension of system for customers
▪ No support for USP creation at
customer side
KEY BENEFITS
▪ Open systems supports various scalable hardware platforms and vision IP from different sources
(own IP, 3rd-party IP)
▪ Freedom of choice at customer side which vision IP and system-in-chip to integrate
creation of USPs possible
▪ Flexible, scalable approach enables cost-efficient solutions for volume markets
27 HELLA Company Presentation | Q1 FY 2017/18HELLA’s 77 GHz radar sensor solution enables efficient
360° environment recognition for the entire vehicle
Autonomous Driving – Technology Highlights
TECHNOLOGY
77 GHz Radar Sensor MAIN FUNCTIONALITIES
Intersection
Assistant
KEY FACTS
▪ Highly integrated RF-CMOS
Radar System Chip
▪ Higher functional object detection
performance
▪ Dimensions: 65 x 61 x 15 mm
Automated
Parking
KEY BENEFITS
▪ Reduced size & weight (significant package
reduction compared to previous sensors)
▪ Identifies & reacts to approaching vehicles
Automated
from front-side when entering a junction or
Driving
pulling out forward from parking space
▪ Identifies & warns of objects in blind spot
28 HELLA Company Presentation | Q1 FY 2017/18Consequent roll-out of 48V DC/DC converter in order to participate
in growing 48V market, especially in China
Efficiency & Electrification – Technology Highlights
TECHNOLOGY
48V DC/DC-Converter MAIN FUNCTIONALITIES
KEY FACTS
▪ Conversion efficiency
> 95%
▪ Power rating according to
alternator up to 3kW
Enhanced Start-Stop Engine-Off-Coasting
▪ Scalability thanks to multi-phase
approach
Awarded by
3 Customers
KEY BENEFITS
▪ Enables new applications such as stop/start
and idle cruising, whilst ensuring the supply of
fuel-efficient power loads such as electrical
Boosting High Power Braking
power-steering actuators
▪ Innovative vehicle applications, which support
fuel efficient drive concepts such as high power
regenerative braking or engine-off coasting
applications
Backup Energy Fuel Economy
29 HELLA Company Presentation | Q1 FY 2017/18HELLA offers the full electronics solution for lithium-ion battery
management system
Efficiency & Electrification – Technology Highlights
TECHNOLOGY
BATTERY MANAGEMENT SYSTEM MAIN FUNCTIONALITIES
CALCULATE PROTECT
KEY FACTS BATTERY BATTERY AND
STATE VEHICLE
BMS ECU: Battery state
calculation and control of safety
DRIVER
functions against
Cell Controller: Voltage and ▪ State of Charge ▪ Battery overheating
temperature measurements as ▪ State of Health ▪ Over voltage and
well as cell balancing current
▪ Power capability
High Voltage Current Sensor: ▪ Resistance ▪ Contactor State of
Measurement of battery current Health (SoH)
Insulation Monitoring Device:
Measurement of insulation
resistance between HV and LV
(Integrated) Relay Box:
Charge, pre-charge and main
relays packaged including
control electronics
KEY BENEFITS
▪ Modular and scalable platform for 12V, 48V and high voltage ▪ Current ▪ Contactor
lithium-ion batteries ▪ Cell voltages ▪ Communication
▪ Cell temperatures ▪ Limp home
▪ Best-in-class insulation monitoring device in exclusive ▪ Battery voltages ▪ Pre-charge
cooperation with BENDER
MEASURE CONTROL
30 HELLA Company Presentation | Q1 FY 2017/18The electrification of the drivetrain leads to a variety of vehicle
architectures with different costs and CO2 savings
Segment Electronics – Trend overview Efficiency & Electrification
EFFICENCY &
ELECTRIFICATION
Internal Combustion 48V Mild Hybrid Full-hybrid (FHEV) & Battery Electric
Engine (ICE) (MHV) Plug-in Hybrid (PHEV) Vehicle (BEV)
Combustion engine + Electric motor charged by
Conventional combustion Only one battery charged
electric motor which combustion engine or via
engine (gasoline or diesel) from grid or by fuel cell
helps share the load plug-in from grid
CO2 Reduction* -10% to -20% -30% -100%
Additional Costs** 5% to 10% 50% to 60% 30% to 50%
MARKET
PENETRATION*** Voltage 12V & 48V 12V &> 120V
share of light vehicle
production worldwide With
start/stop
today 69% 28% 0% 2% 0%
2020 34% 53% 5% 5% 2%
2025 24% 47% 18% 8% 3%
* CO2 reduction related to local emissions only
** Assumptions on technical concept for high volume car
*** Source: IHS Engine Forecast, December 2016
31 HELLA Company Presentation | Q1 FY 2017/18Innovative approach to optimize air quality in the vehicle based on
particulate sensor and cloud-based solutions
Connectivity & Digitalization – Technology Highlight
TECHNOLOGY
Cloud-Based Air Quality Management MAIN FUNCTIONALITIES
Pollution
Notifications
KEY FACTS
▪ Particulate Matter Sensor (PM2.5)
▪ For vehicles with automatic climate
control
▪ Measurement of air properties, in the
range of 25 µg / m³ - 500 µg / m³
▪ Particle size distribution detection Cloud-Based
by scattered light detection // Clean Routing
amplitude of diffractive light First to Option
depends on PM concentration market
KEY BENEFITS
▪ Detection of particulate matter < 2.5 µm
(fine dust) in the inner cabin & ambient air
▪ Greater driving comfort due to continual
Cloud-Based
optimization of the air quality in the vehicle
Health
▪ High particle concentration leads e.g. to: sensor Recommendations
function for ventilation flap controlling (lowers in-
cabin pollution level) or fine dust pollution level
display as warning feature
32 HELLA Company Presentation | Q1 FY 2017/18HELLA’s multi lens array improves comfort and safety by
supportive road projects for different driving situations
Autonomous Driving – Technology Highlights
TECHNOLOGY
Multi Lens Array MAIN FUNCTIONALITIES
First to Welcome
KEY FACTS market Light
▪ Generation of sharp, contrasting
and homogeneous images
▪ No loss of the graphic even by
partially dirty lens, 170 micro
projection lenses per Multi-Lens-
Array generating 1 image
▪ Integration of projections with car Future
sensors Driving Status
option
Projections
KEY BENEFITS
▪ Enhances safety through communication with
pedestrians and other vehicles
▪ Evokes emotions by dynamic / changing Future Safety
lighting option Projections
▪ Enables information about autonomous driving
status
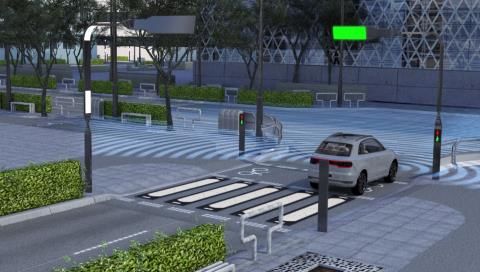
33 HELLA Company Presentation | Q1 FY 2017/18High definition headlamp accelerates functionalities and
customer benefits
Connectivity & Digitalization – Technology Highlights
TECHNOLOGY
High definition headlamp NEW FUNCTIONALITIES
Pedestrian
KEY FACTS marking
▪ High definition lighting system
▪ Liquid Crystal with >50.000 Pixel
Projection of
cross-walk
KEY BENEFITS
▪ State of the art functions, e.g. bend light,
glare-free high beam, etc. with optimized end-
user impact
▪ New functionalities, e.g. C2P (Car To
Pedestrian) and C2D (Car To Driver) Highlight the
▪ High end resolution walk way
34 HELLA Company Presentation | Q1 FY 2017/18Enhancing user experience and safety with HELLA’s dynamic
ambient lighting system
Individualization – Technology Highlights
TECHNOLOGY
Dynamic Ambient Lighting System MAIN FUNCTIONALITIES
Future Advanced
KEY FACTS option Welcome
▪ Competence in light & electronics Scenario
▪ Light as a complementary
information source for driving tasks
▪ Infinite number of high speed light
scenarios
Future Collision
option
Warning
KEY BENEFITS
▪ Integration in customer E/E architecture
▪ Supports partially and high automated driving
▪ Enhances safety in complex traffic situations
through warning function
▪ Improves driving comfort by Future Ambient &
personalization of light option Relaxing
35 HELLA Company Presentation | Q1 FY 2017/18LED competence as driver for HELLA Lighting
HELLA at a glance – Business Segment Automotive
LED to change the automotive market… …with penetration rates of LED to explode
■ Half of produced light vehicles equipped with LED
LED headlamp sets
in million units headlamps in 2027
+22.9%
CAGR ■ Driver:
58.4 Need for advanced lighting based assistance systems
537 646
31.6 Need for energy efficient lighting system
Need for designed parts and distinguishable lighting
7.4
CAGR elements
2017 2022 2027 2017-27
Value (EUR bn) 2.9 9.1 12.1 15,2%
Penetration (%) 7.8 29.9 51.8
Source: Strategy Analytics Aug. 2017
HELLA first-to-market applications & penetration into mass models
VW Polo
LED headlamp
Volume
BMW 3er Series ■ HELLA offers
Audi A3 Full-LED headlamp
Segment Full-LED headamps scalable
wit AFS functions BMW 1er Series
LED headlamp
solutions for
Audi A6
premium and
LED Matrix-Beam Headlamp volume
Premium Audi A7
segments
Segment LED Matrix-Beam Headlamp
MB E-Class Audi A8 Full-LED headlamp
1st full-AFS headlamp with AFS functions Audi A8
LED Matrix-Beam Headlamp
GM Escalade MB E-Class
Full-LED headlamp LED MULTIBEAM Headlamp
2005 2006 2007 2008 2009 2010 2011 2012 2013 2014 2015 2016 2017 2018 2019
36 HELLA Company Presentation | Q1 FY 2017/18Competitive advantage through complete aftermarket solutions
HELLA at a glance – Business Segment Aftermarket
BUSINESS OVERVIEW KEY FINANCIALS
Independent Aftermarket (IAM) in EUR millions and % of sales
▪ Sale of own and third-party spare parts to
IAM wholesalers FY 2015/16 FY 2016/17 Change
▪ Own sales presence in >25 countries Sales 1,179 1,222 +3.7%
▪ Strong position of sales network and brand
EBIT 76.9 73.0 -5.0%
presence in European market (#1-3)
-0.5%
EBIT margin 6.5% 6.0%
points
Wholesale Distribution
▪ Building holistic product portfolio from part Sales IAM 530 553 +4.4%
suppliers and offering to IAM garages Sales Wholesale 523 550 +5.2%
▪ Market position: #1 #2 #3 Sales Garage Equipment 58 66 +12.7%
▪ Synergies through HELLA wholesale
organization “Nordic Forum”
Manufacturer
Workshop Equipment Wholesaler
▪ Premium provider of workshop solutions, B2B
diagnostic tools and advanced equipment to Parts Information/
Diagnostic
garages Garages
▪ Offering of professional services, e.g. Routing Parts
technical data/hotline, trainings & financial and/or Service B2B
Parts+ E-commerce & Service Platform
services Services
Parts + B2C
▪ market position: #1 #3 Services
DIY & DIFM
End Consumer
37 HELLA Company Presentation | Q1 FY 2017/18IAM keeps strengthening its core product portfolio and seeks
further cooperation for third party OE competence
HELLA at a glance – Segment Aftermarket: Independent Aftermarket
Focus on 1 Strengthening of HELLA‘s 2 Partnership with strong
OE core products 3rd party OE suppliers for IAM
Products
Vehicle-specific
Electronics
lighting
Strategic ▪ Expand portfolio and leverage ▪ Enhancement of HELLA portfolio
directions own OE know-how with special by 3rd party OE products and
focus on E/E and more complex leverage of distribution network
products, e.g. radar sensors and proximity to customers
▪ Shift from crash to wear parts
▪ Roll-out of global portfolio into
regions and leverage of local
portfolio additions
38 HELLA Company Presentation | Q1 FY 2017/18HELLA’s integrated wholesale concept ensures broad and deep
customer reach in order to generate further growth
HELLA at a glance – Segment Aftermarket: Wholesale
POSITIONING ALONG VALUE CHAIN STRATEGIC DIRECTION
Capture chances from digitalization
Manufacturer
▪ Intensification of E-commerce
business in Denmark and Poland
▪ Further development of service
platform in first market Denmark
Wholesaler and roll-out to further wholesale
markets
B2B
Parts
Information/
▪ Increase in customer loyalty with
Diagnostic digital solutions, e.g. connected
Garages cars and telematics
▪ Strengthen B2C business and
Routing Parts
and/or Service B2B further end-user services
Parts+ E-commerce &
Services Service Platform
Parts + B2C DIY & DIFM
Services
End Consumer
39 HELLA Company Presentation | Q1 FY 2017/18HELLA enables workshops to conduct complex repair and
maintenance activities with innovative and cost efficient solutions
HELLA at a glance – Segment Aftermarket: Workshop Products
State of the art workshop equipment to New cloud-based workshop solutions to
address more complex car solve diagnostic problems
Existing diagnostics business model
Provide professional workshop equipment e.g. HELLA
multi-brand diagnostics, air-conditioning service as well ▪ Localized offline data base, not
Diagnostic
accessible for external parties
as testing and adjusting tools e.g. for camera and know-how
▪ Technical support offered by
sensor calibration hotline, e.g. for interpretation of
Example: Camera and sensor calibration complex failure codes into easy-to-
understand failure analysis
Cloud platform
Cloud Platform ▪ HELLA know-how is transferred to a
Provider cloud platform
API ▪ Third parties can access data base
through web services like API
▪ Predictive services become
▪ Growing importance of cameras and sensors due
possible
to automotive megatrends (e.g. autonomous
driving)
▪ Easy application for all brands, smart and cost- New Partners New applications
Booking Platforms ▪ New partners access the data base
efficient solution
Automotive Startups to offer innovative services and
▪ Tool offers independent workshops possibility to applications for car diagnostics
extend business activities beyond traditional (“micro services”)
scope ▪ Examples: driver logbooks, pay-per-
diagnosis
40 HELLA Company Presentation | Q1 FY 2017/18Diversification of business portfolio based on existing strengths
HELLA at a glance – Business Segment Special Applications
BUSINESS OVERVIEW KEY FINANCIALS
▪ Development, production and sale of lighting and electronics in EUR millions and % of sales
products for special vehicle manufacturers
FY 2015/16 FY 2016/17 Change
▪ “Fast follower” of technological innovations in automotive
segment along megatrends LED, energy efficiency and safety Sales 384 385 +0.3%
▪ Application of know-how through own research and EBIT 8.2 19.7 +140.3%
development resources and dedicated production footprint
+3.0%
▪ Strong market position in lighting product areas based on EBIT margin 2.1% 5.1%
points
long-standing experience, in particular in Europe
▪ Focusing on a variety of attractive target groups
TARGET GROUPS STRATEGIC FOCUS
1. Drive LEDfication in all customer segments
► Further focus on offering of LED solutions and participate in
LEDfication trend e.g. in recreational vehicles and trailers
Off-highway
► Invest into innovative product roadmap, e.g. Shapeline and
multi-function lamp platform
► Revitalize products e.g. modular work lamps and rear lamps
Highway & ► Drive advanced engineering e.g. light tunnel and matrix beam
Leisure Vehicles 2. Push further application of Electrics / Electronics
► Transfer and adaptation of electronic automotive know-how
to further participate in Electrification trend for special vehicles
► Focus on application of existing Automotive products e.g.
Premium &
pedal sensors
Special Vehicles
► Extension of Electronics scope e.g. radar solutions for
smart farming to avoid collision and to measure seeds
and speed
41 HELLA Company Presentation | Q1 FY 2017/18Thanks for your attention Dr. Kerstin Dodel, CFA Head of Investor Relations Office phone +49 2941 38 - 1349 Facsimile +49 2941 38 - 471349 Mobile phone +49 174 3343454 E-Mail kerstin.dodel@hella.com Internet www.hella.com
You can also read