2021 Full Year Results Presentation - 18 August 2021 - Bell Direct
←
→
Page content transcription
If your browser does not render page correctly, please read the page content below
Coles’ Together to Zero sustainability strategy set our ambitions including 100% renewable energy by FY25.

  2021 Full Year Results Presentation
  18 August 2021
Disclaimer
This presentation contains summary information about Coles Group Limited (ACN 004 089 936) and its controlled entities (collectively, ‘Coles’, ‘Coles Group’ or ‘the
Group’) and Coles’ activities as at the date of this presentation. It is information given in summary form only and does not purport to be complete. It should be read in
conjunction with Coles’ other periodic corporate reports and continuous disclosure announcements filed with the Australian Securities Exchange (ASX), available at
www.asx.com.au.

This presentation is for information purposes only and is not a prospectus or product disclosure statement, financial product or investment advice or a
recommendation to acquire Coles shares or other securities. It has been prepared without taking into account the investment objectives, financial situation or needs
of individuals. Before making an investment decision, prospective investors should consider the appropriateness of the information having regard to their own
investment objectives, financial situation and needs and seek legal, taxation, business and/or financial advice appropriate to their circumstances.

No representation or warranty, express or implied, is made as to the fairness, accuracy, completeness or correctness of the information, opinions and conclusions
contained in this presentation. To the maximum extent permitted by law, none of Coles or its directors, employees or agents, nor any other person, accepts liability for
any loss arising from the use of this presentation or its contents or otherwise arising in connection with it, including, without limitation, any liability from fault or
negligence on the part of Coles or its directors, employees, contractors or agents.

This presentation contains forward-looking statements in relation to Coles, including statements regarding Coles’ intent, belief, goals, objectives, initiatives,
commitments or current expectations with respect to Coles’ business and operations, market conditions, results of operations and financial conditions, and risk
management practices. This presentation also includes forward-looking statements regarding climate change and other environmental and energy transition
scenarios. Forward-looking statements can generally be identified by the use of words such as ‘forecast’, ‘estimate’, ‘plan’, ‘will’, ‘anticipate’, ‘may’, ‘believe’,
‘should’, ‘expect’, ‘intend’, ‘outlook’ and ‘guidance’ and other similar expressions.

The forward-looking statements are based on Coles’ good faith assumptions as to the financial, market, risk, regulatory and other relevant environments that will exist
and affect Coles’ business and operations in the future. Coles does not give any assurance that the assumptions will prove to be correct. The forward-looking
statements involve known and unknown risks, uncertainties and assumptions and other important factors, many of which are beyond the reasonable control of Coles,
that could cause the actual results, performance or achievements of Coles to be materially different from the relevant statements. There are also limitations with
respect to scenario analysis, and it is difficult to predict which, if any, of the scenarios might eventuate. Scenario analysis is not an indication of probable outcomes
and relies on assumptions that may or may not prove to be correct or eventuate.

Readers are cautioned not to place undue reliance on forward-looking statements, which speak only as at the date of the presentation. Except as required by
applicable laws or regulations, Coles does not undertake any obligation to publicly update or revise any of the forward-looking statements or to advise of any change
in assumptions on which any such statement is based. Past performance cannot be relied on as a guide for future performance.

Non-IFRS financial information
• This Results Presentation contains non-IFRS financial information which in the ordinary course, is not subject to audit or review.
• IFRS or Statutory financial information is financial information that is presented in accordance with all relevant accounting standards.
• Any non-IFRS financial information is clearly labelled to differentiate it from the Statutory/IFRS financial information.
• The use of non-IFRS information in the 2021 Full Year Results Presentation provides readers of these documents with meaningful insights into Coles’ financial
   performance.

Balance sheet and cash flow information presented in this 2021 Full Year Results Presentation is consistent with the underlying information disclosed in the Appendix 4E
Full Year Financial Report.

Due to rounding, numbers presented throughout this document may not add up precisely to the totals provided and percentages may not precisely reflect the
absolute figures.

                                                                                                                                                                            1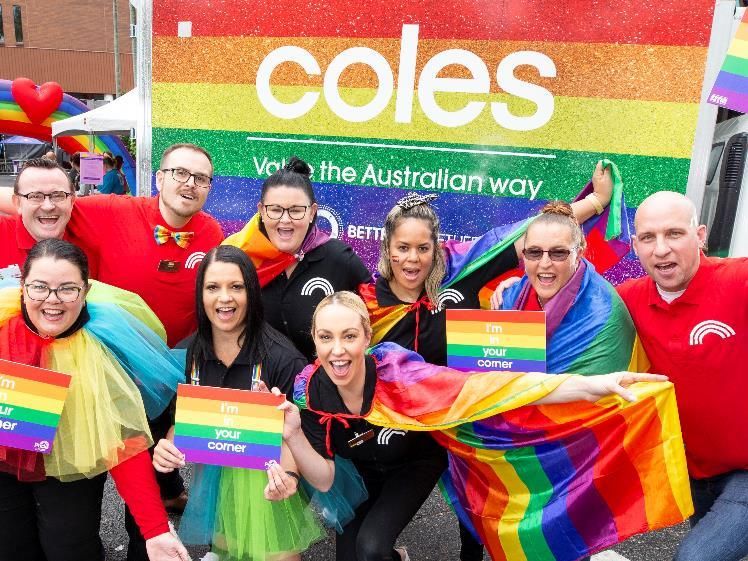
Coles, its customers and its pork farmers raised more than $6.7 million for FightMND(left), and also supported food rescue organisation SecondBite
(right). During FY21, Coles marked the milestone of donating the equivalent of 150 million meals to SecondBite since the partnership began in
2011, supporting our ambition of Together to zero hunger.

   FY21 summary
Whilst we have made significant strategic progress in the last two years, the majority
of our transformation and benefits are still to come over the next three years

                                      Our vision.
‘Become the most trusted retailer in Australia and grow long-term shareholder value.’

                                          Our strategic differentiators
                                           ✓   Win in online food and drinks with an optimised
                                               store and supply chain network

                                           ✓   Be a great value Own Brand powerhouse and
                                               destination for health

                                           ✓   Achieve long-term structural cost advantage
                                               through automation and technology partnerships

                                           ✓   Create Australia’s most sustainable supermarket

                                           ✓   Deliver through team engagement and pace of
                                               execution

                                                                                                 3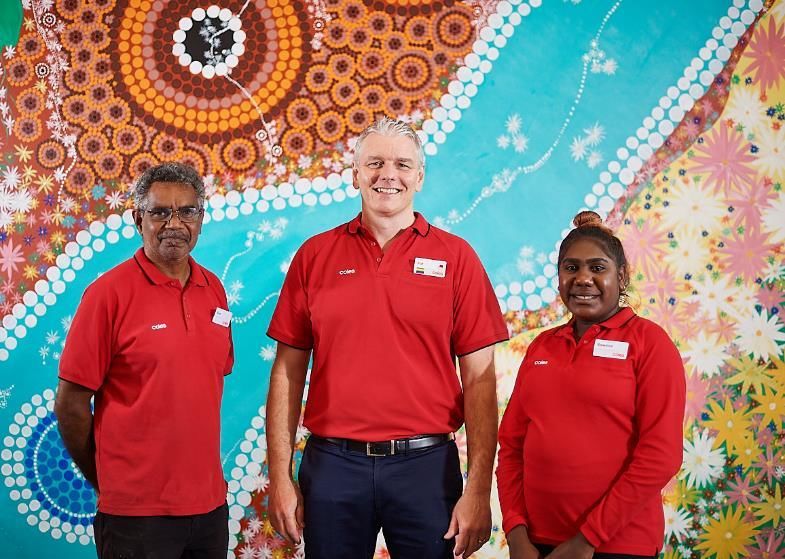
Strong progress on strategy execution over last two years
With more differentiation and benefits to come

    FY19                             FY20-21                                                FY22 onwards
    Post-demerger                    Delivered progress                                     More to come
    foundations                  •    Increased Coles customer satisfaction and         •    Grow ‘Exclusive to Coles’ to
                                      trust                                                  40% of sales focusing on
•    Successful demerger of                                                                  health and convenience
     ASX 20 company in           •    Improved ‘Exclusive to Coles’ contribution to
     November 2018                    32% (from 29% in FY19)                            •    Launch single app and
                                                                                             Ocado extended range to
•    Launched refreshed          •    Accelerated eCommerce strategy by
                                                                                             differentiate online offer
     strategy ‘Winning in our         doubling capacity in Supermarkets and
     2nd century’                     opening three dark stores in Liquor               •    Improve efficiencies with two
                                                                                             Witron automated DCs
•    Signed partnership          •    Delivered cumulative Smarter Selling benefits
     agreements with                  in excess of $550m                                •    $1bn of cumulative Smarter
     Ocado & Witron                                                                          Selling benefits by FY23
                                 •    Refreshed Liquor strategy to be a simpler, more
                                                                                             enabled by technology and
•    Established Smarter              accessible, locally relevant drinks specialist
                                                                                             AI throughout stores and
     Selling program             •    Trialled new and innovative store formats and          supply chain
•    Restructured Coles               tailored store ranges e.g. Coles Local and B&W
                                                                                        •    Continue to build Coles as a
     Express Alliance                 Liquorland
                                                                                             great place to work through
     agreement                   •    Recorded highest ever supplier engagement              greater team engagement
•    Established Queensland           score and rolled out pioneering direct long-
                                                                                        •    100% renewable electricity,
     Hotel joint venture              term Own Brand milk sourcing with farmers
                                                                                             reduced emissions and
                                 •    Launched Together to Zero sustainability               ultimately net zero
                                      strategy
                                                                                        •    Truly localise community
                                 •    Embedded safety culture with 31%                       partnerships
                                      improvement in TRIFR

                           Accelerating pace and investment for long-term growth
                                                                                                                             4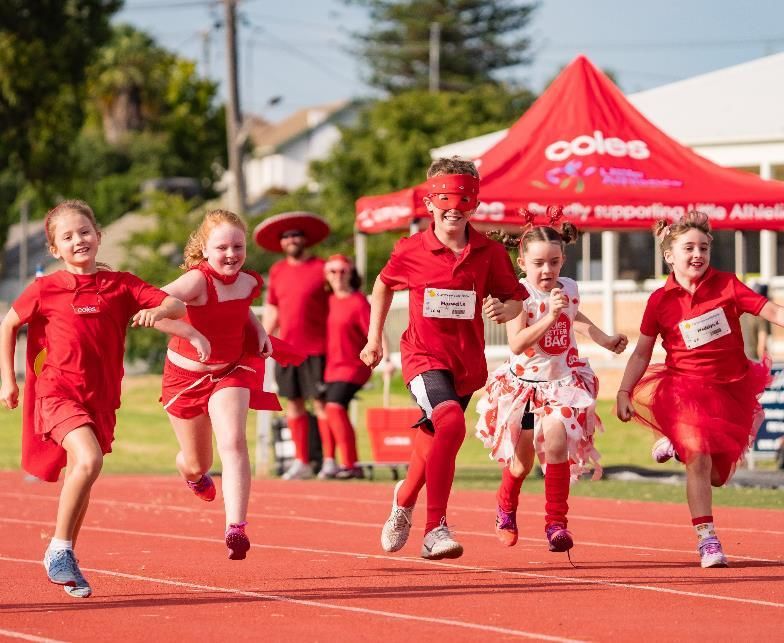
FY21 financial highlights
         Second year of strategy delivered to grow trust and long-term shareholder value

              Total sales revenue                                                                EBIT                                         Net profit after tax1
                                       $38.6bn                                                         $1,873m                                                        $1,005m
                                    3.1% vs. pcp;
                                                                                                      6.3% vs. pcp                                                  7.5% vs. pcp
                                   10.2% vs. FY19

                   Smarter Selling                                               Gross operating                                           Operating cash flow2
                                                                                     capex
                                  Delivered
                                                                                         $1.1bn                                                                       $3,628m
                                  benefits of                                                                                                                         106% cash
                                ~$300m in FY21                                                   on an accrued
                                                                                                                                                                      realisation
                                                                                                     basis

                   Final dividend3                                                         Net debt                                                           Safety
                                                                                                                                                               19.1 TRIFR4
                                      28 cents per                                                     $355m                                                        15.7%
                                       share fully-                                                pre-dividend
                                         franked                                                                                                                 improvement
                                                                                                     payment
                                                                                                                                                                   vs. FY20

1 Excludes significant items in FY20.
2 Excluding interest and tax.
3 The Coles Board has declared a fully-franked final dividend of 28 cents per share with a record date of 27 August 2021 and a payment date of 28 September 2021. Total FY21 dividends

   payable are a 6% increase on the prior year
4 Total Recordable Injury Frequency Rate.                                                                                                                                                5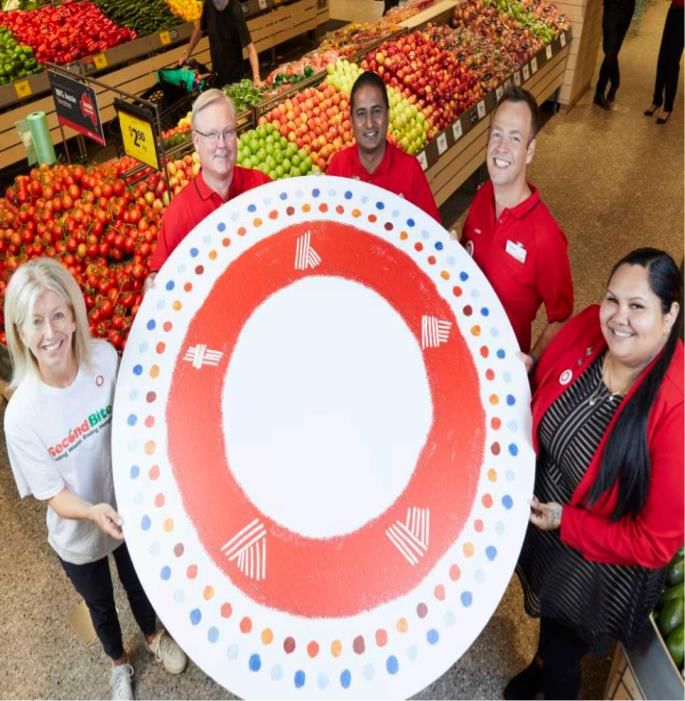
Progress against strategy: Inspire Customers
Customer advocacy (NPS)1 improved by 2.3 points in Supermarkets; 4.9 points in Liquor
                                                      •        Q4 exit market share restored to pre-COVID-19 levels as
                                                               shopping centres recovered

                                                      •        Now ranked as one of Australia’s most trusted consumer
                                                               brands in Roy Morgan survey

                                                      •        Removed door-to-door paper catalogues and launched
                                                               coles&co for more personalised experience

                                                      •        eCommerce sales growth of 52% for the year with Q4 growth
                                                               of 62% and Q4 penetration of 6%

                                                      •        Progressed trusted and targeted value strategy, placing a net
                                                               474 new products on everyday low prices
Coles helped lower the cost of dinner.                •        Exclusive to Coles products sales growth                                         of 5% with
                                                               penetration of 32% at Q4

                                                      •        Provided a tailored offer to meet the differing needs of
                                                               customers with 30% of store layouts tailored
      Update with pans                                •        Progressed convenience roll out now available in more than
      POS / flybuys card                                       300 stores

                                                      •        Accelerated      Liquor  eCommerce      and  omnichannel
                                                               capabilities through the opening of three eCommerce dark
                                                               stores

Coles provided more value for customers through the
MasterChef cookware and knives campaigns linked to        1   Going forward, NPS will be the metric used to measure customer advocacy. Liquor NPS is based
flybuys membership.                                           on Liquorland NPS results.                                                                     6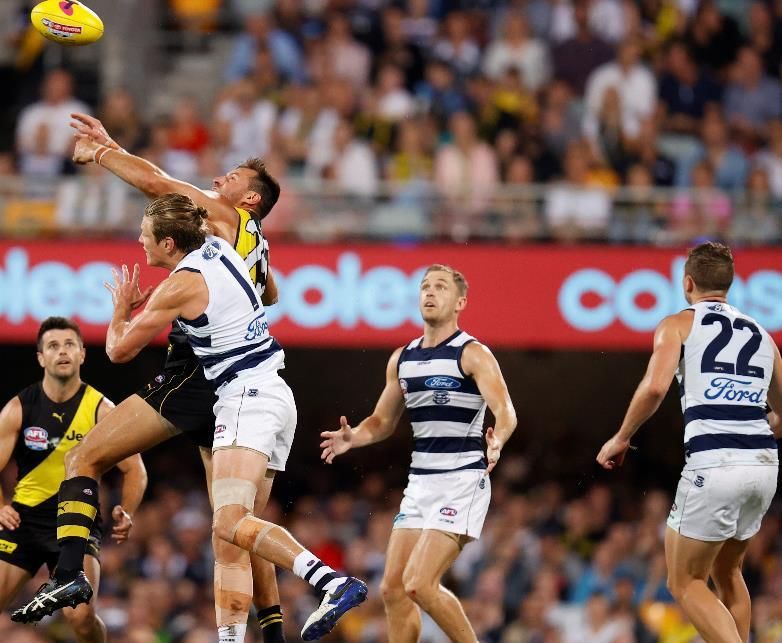
Supermarkets eCommerce key metrics
Q4 growth of 62% supported by investments in capacity and customer experience

    Monthly active                 eCommerce                Omnichannel
      shoppers                     penetration             customers spend
                +46%                     6% in Q4                    2.2x
                                          vs. 3.8% in Q4         vs. in-store only
                vs. pcp
                                               FY20              shoppers in Q4

      Coles Plus                 Perfect order rate          Online NPS
     subscription
              6x                              1.7x                   Almost
             increase in paid             improvement               doubled
           members since re-
           launch in Feb 2021
                                             in FY21                 vs. FY20

  Same-day home                   Click & Collect          Click & Collect
     delivery                   (to the boot of car)            Rapid
          available in                                             available in
                                         >500 sites              >400 stores
         >300 stores

                                                                                     7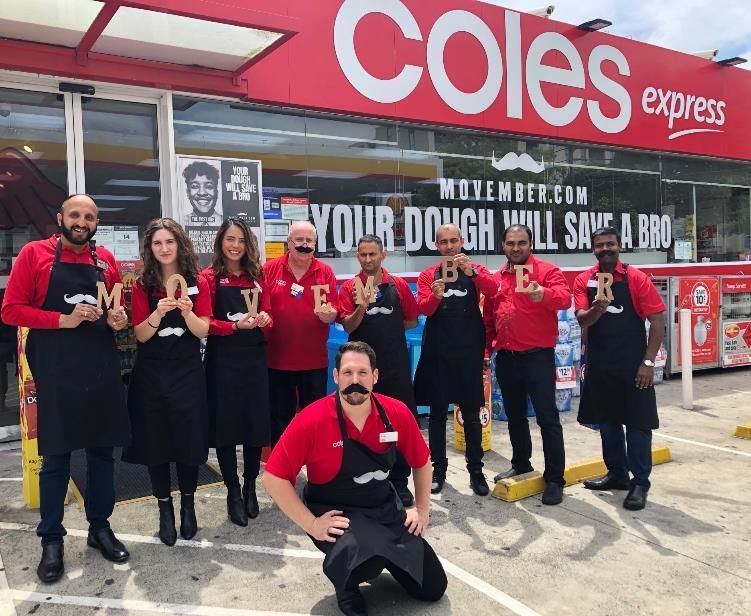
Progress against strategy: Smarter Selling
Achieved Smarter Selling benefits of approximately $300 million in FY21
                                                                    •   Delivered total cumulative benefits in excess of $550 million since
                                                                        commencement of program

                                                                    •   Despite challenging operating conditions presented by COVID-
                                                                        19, the following key initiatives were delivered:
                                                                        −    Data and technology-led solutions supporting store
                                                                             operations
                                                                        −    Measures to reduce loss through use of artificial intelligence
                                                                        −    Technology-led transport and logistics solutions improving
                                                                             the end-to-end flow of fresh goods
                                                                        −    Introduction of new customer self-service solutions at
                                                                             checkout
                                                                    •   Commenced implementation of Fresh Produce Easy Ordering

                                                                    •   Construction progressed at the Witron automated distribution
                                                                        centres in NSW and QLD – the Ocado CFCs in Melbourne and
                                                                        Sydney progressed well

                                                                    •   Launched myhub (people and payroll system), providing a ‘one-
                                                                        stop shop’ for team members

                                                                    •   Tailored    store   format     strategy        continued       with
                                                                        65 renewals completed during the year

Internal (bottom) and external (top) view of the Witron
automated distribution centre in Queensland. Consistent with
Coles’ sustainability commitments, solar panels will be installed
on the substantial roof surface during construction.                                                                                          8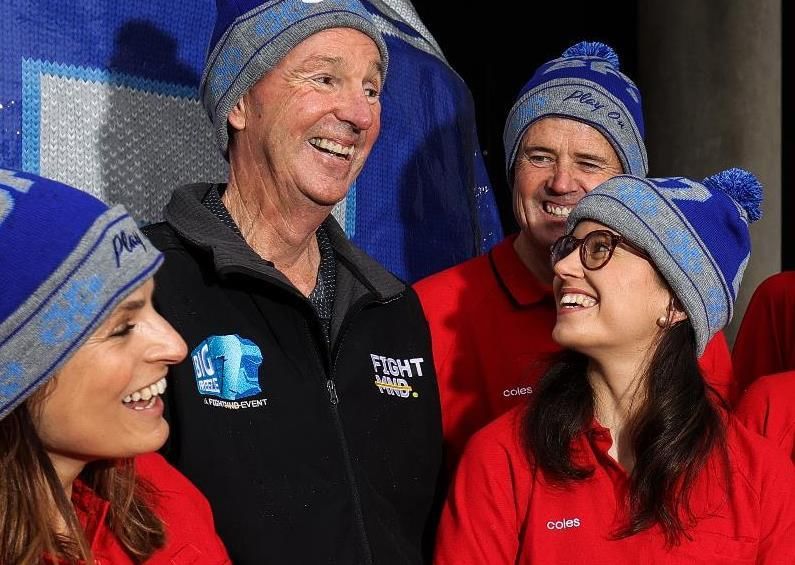
Progress against strategy: Smarter Selling
 In excess of $550m of Smarter Selling benefits achieved since commencement of
 program

          FY21 Smarter Selling benefits of                 On track to deliver $1bn of benefits
            ~40% in GP, ~60% in CODB                              by FY23 (ex-COGS)

   Admin remuneration,
    expenses and other
                                                                $1.0bn
                                     Logistics
                 15%
                                  20%                                     FY22/23e
     Store
expenses
& tenancy 10%
                                                                  $550m

                                                                            FY21
                                          18% Stock loss
                                                 & waste
                                                                  $250m

                                    2%
                 35%
                                         Other
                                                                           FY20
   Store remuneration

                       GP    CODB

                                                                                                  9
Progress against strategy: Win Together
Launched new sustainability strategy Together to Zero and Better Together
• Committed to reduce environmental impact through:
o Net zero greenhouse gas emissions by 2050
o 100% renewable electricity by the end of FY25
o Reduce combined Scope 1 and 2 greenhouse gas
emissions by more than 75% by the end of FY30 (from a
FY20 baseline)
o Divert 85% of waste from landfill by FY25 and continue
our focus on reducing food waste
• Improved safety with 15.7% improvement in TRIFR
• Invested in team member mental health, wellbeing and
learning and development
Coles’ sustainability icon created for Coles by Bundjalung/Biripi artist
Nikita Ridgeway.
• Supported diversity through increased gender balance;
recognised as a leader in LGBTQI+ inclusion, winning a Gold
Australian Workplace Equality Index award
• Improved relationships with suppliers - highest ever
engagement score in the 2021 Advantage supplier survey
• Announced direct milk sourcing model to Tas and further
expanded model in Vic, NSW and SA
• Significant contributions to community organisations and
charities in FY21, including FightMND and the Curing
Homesickness fundraising initiative
• Supported team members and communities through COVID-
19 lockdowns, floods and bushfires
Coles announced that it has extended its direct milk sourcing model to
Tasmania, allowing more dairy farmer suppliers to enter long-term 10
relationships with Coles.Coles’ market share has recovered to pre-COVID-19 levels
Supermarkets market share
Key COVID-19 Victoria
Refreshed strategy starting to National
events pantry lockdown Local shopping unwind
gaining traction lockdown
stocking
27.7%
27.2% 27.3%
27.1%
26.7% 26.7% 26.6%
26.4%
FY19 H1 FY20 Q3 FY20 Q4 FY20 Q1 FY21 Q2 FY21 Q3 FY21 Q4 FY21
Source: ABS releases: Retail Turnover 11Coles’ strategy tracker – 2nd year of strategy delivered
KPIs Progress
Reduced safety TRIFR • 15.7% reduction in TRIFR compared to FY20
Increased team member • Three percentage points lower in FY21, however improved since strategy
engagement refreshed in FY19
Improved customer
• Supermarkets NPS improved by 2.3 points; Liquor NPS improved by 4.9 points
satisfaction
• ABS total market growth of 5.0%1
• Supermarkets headline sales revenue growth of 2.6% in FY21
Sales growth at least in
line with the market • Supermarkets relative growth impacted by COVID-19 “local shopping”
trends. Coles’ share recovered as consumer behaviours normalised in-line
with pre-COVID-19 share
• Supermarket sales density increased by 1.7% YoY to $17,847/sqm
Increased sales density
• Liquor sales density increased by 5.5% YoY to $16,287/sqm
$1bn cost-out by FY23 • Achieved Smarter Selling benefits of ~$300 million in FY21
EBIT growth • Group EBIT growth of 6.3%
Cash realisation2 >100% • Cash realisation of 106%
1 Source: ABS Retail Trade Figures, Table 11. Retail Turnover, State by Industry Subgroup, Original. Total Food Retail excl. Liquor (Smkt & Grocery plus Other
Specialised Food Retailing).
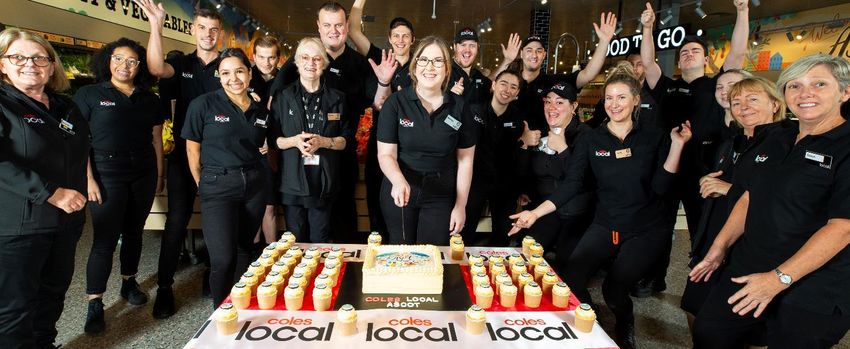
2 Cash realisation is calculated as operating cash flow excluding interest and tax, divided by EBITDA. 12Coles Local in Ascot was opened in June 2021, the first Coles Local store to open in Queensland .
Group financial overviewFY21 results – Group
Operating leverage delivered strong earnings growth in FY21
$m FY21 FY20 Change
Sales revenue 38,562 37,408 3.1%
EBITDA 3,432 3,257 5.4%
EBIT 1,873 1,762 6.3%
EBIT margin % 4.9 4.7 15bps
Net profit after tax1 1,005 935 7.5%
Basic earnings per share1 (cents) 75.3 70.1 7.5%
Interim dividend per share2 (cents) 33.0 30.0 10.0%
Final dividend per share2 (cents) 28.0 27.5 1.8%
Total dividend per share2 (cents) 61.0 57.5 6.1%
1 Net profit after tax and Basic earnings per share excludes significant items in FY20.
2 Dividends announced.
14FY21 results – segment financials
Sales revenue and EBIT growth across all segments
2-yr
$m FY21 FY20 Change change1
Sales revenue
Supermarkets 33,845 32,993 2.6% 9.6%
Liquor 3,525 3,308 6.6% 15.1%
Express 1,192 1,107 7.7% 13.8%
Group sales revenue 38,562 37,408 3.1% 10.2%
EBITDA
Supermarkets 3,001 2,867 4.7%
Liquor 276 242 14.0%
Express 207 167 24.0%
Other2 (52) (19) N/M
Group EBITDA 3,432 3,257 5.4%
- EBITDA margin (%) 8.9 8.7 19bps
EBIT
Supermarkets 1,702 1,618 5.2%
Liquor 165 138 19.6%
Express 67 33 103.0%
Other2 (61) (27) (125.9)%
Group EBIT 1,873 1,762 6.3%
- EBIT margin (%) 4.9 4.7 15bps
1Headline 2-year growth is calculated as growth between FY21 and FY19 (retail calendar basis).
2Includes corporate costs, Coles’ 50% share of flybuys’ net result, the net gain or loss generated by Coles’ property portfolio and self-insurance provisions. 15
N/M denotes not meaningful.Operating cash flow
Cash realisation of 106%
Cash flow Comments
• Working capital movement reflects lower
$m FY21 FY20 inventory and trade payables
EBIT 1,873 1,762 • Change in provisions as a result of higher
employee entitlements with fewer team
members taking leave during COVID-19 and
Depreciation and amortisation 1,559 1,495 increase in workers compensation
EBITDA 3,432 3,257 Cash realisation1
106% 107%
Change in working capital 48 60
Change in provisions and
148 168
other
Operating cash flow (excl.
3,628 3,485
interest and tax)
FY21 FY20
1 Cash realisation is calculated as operating cash flow excluding interest and tax, divided by EBITDA. 16Capital expenditure
Increased investment in renewals, growth and efficiency initiatives
Capital expenditure breakdown FY21 key capital expenditure initiatives
$m FY21 FY20 Store • Store renewals across
renewals Supermarkets (65)
Store renewals 245 161
• First Choice Liquor Market (17)
and B&W Liquorland renewals
Growth initiatives 267 151 (25)
Growth • New stores in Supermarkets (20)
Efficiency initiatives 375 275 initiatives and Liquor (31)
• Continued investment in
Maintenance 224 246 Ocado
Efficiency • Supply Chain Modernisation
Operating capital expenditure 1,111 833 initiatives • Investment in loss and front
end customer service initiatives
Property acquisitions and
161 78
development
Maintenance • Refrigeration and electrical
Property divestments (126) (245) • Lifecycle maintenance of
stores and technology
Net property capital
35 (167)
expenditure Property • FY21 net property outflow of
$35m
Net capital expenditure 1,146 666
17Increased investment capex is focused on driving long-term growth and efficiencies
Coles is expected to spend ~$1.4bn in FY22
Incremental capex Examples Rationale
Omnichannel offer • Click & collect (to boot of car), Customers preference to shop online,
expansion • Digital experience enhancements accelerated through COVID-19
(e.g. website, app)
Format acceleration • Coles Local and Liquorland Local shopping trends and shift to
and innovation convenience
Customer offer • Tailored range and category Increasing customer diversity
enhancements acceleration (e.g. international
cuisine, health in every aisle)
• Rapid innovation
Smarter Selling • Front end transformation (e.g. trolley Increased level of comfort of customers
assisted checkouts) to use self-serve options in store;
• Fresh Produce Easy Ordering advances in machine learning
Coles is investing in digital experience including A renewed Black and White Liquorland store. A trolley assisted checkout at Tooronga, Vic.
through the Coles Online app. 18Balance sheet
Investment grade credit metrics with flexibility for future growth
Balance sheet summary Comments
27 Jun 3 Jan 28 Jun • Net debt of $355 million and balance sheet
$m 2021 2021 2020 leverage ratio of 2.8x1
Inventories 2,107 2,423 2,166 • Working capital higher than the half year,
reflecting seasonally lower inventory and
Trade and other trade payables with both inventory and
368 415 434
receivables payable days stable
Trade and other
(3,660) (4,173) (3,737) • Trade and other receivables reduced
payables following the settlement of a one-off
Working capital (1,185) (1,335) (1,137) property development loan
PP&E and equity • PP&E and equity investments increased as a
4,683 4,496 4,344 result of investment in new stores, renewals,
investments
and milestone payments for the Supply
Right-of-use assets 7,288 7,703 7,660 Chain Modernisation Program and Ocado
Intangibles 1,698 1,620 1,597
Inventory and trade payable days
Provisions (1,408) (1,358) (1,333)
33 33
Other 35 (64) 38 29 29
Capital employed 11,111 11,062 11,169
Net cash / (debt) (355) 38 (362)
Lease liabilities (8,756) (9,168) (9,083)
Net tax balances 813 860 891
Inventory days Trade payable days
Total net assets 2,813 2,792 2,615
FY21 FY20
1 Calculated as gross debt less cash at bank and on deposit ($931m) add lease liabilities
($8,756m), divided by EBITDA for the 12 months ended 27 Jun 2021 ($3,432m).
19Capital management
Total FY21 dividends payable up 6% and a strong liquidity and debt maturity profile
Dividend Debt facility maturity profile ($m)
• Fully-franked FY21 final dividend of 28 cents per
share. Total FY21 dividends payable are a 6%
increase on the prior year
• Coles retains its industry-leading annual target
dividend payout ratio of 80% to 90%
1,004
1,389
Funding and liquidity
• Weighted average drawn down debt maturity of
6.9 years provides funding stability
286 ¹ 36 ¹ 250 300 300 300
‒ Undrawn facilities of $2.4bn, providing FY21 FY22 FY23 FY24 FY25 FY26 FY27 FY28 FY29 FY30 FY31
appropriate headroom
‒ Cash at bank and on deposit of $0.2bn Drawn Undrawn
• Strong access to bank and debt capital markets Leverage ratio²
throughout the pandemic
• Coles is committed to retaining diversified funding
sources and a staggered debt maturity profile
Credit ratings
3.1
• Coles is committed to solid investment grade credit 2.9 2.8³
ratings with S&P and Moody’s
1 Includes bank guarantees.
2 Leverage ratio post-AASB 16. FY20 1H21 FY21
³ FY21 leverage ratio calculated as Net financial debt ($931m), add lease liabilities
($8,756m), divided by EBITDA ($3,432m).
20Coles expanded its Click & Collect (to boot of car) to more than 500 stores (left) and re-launched its Coles Plus membership subscription offer (right)
during the year.
SupermarketsSupermarkets key metrics
Successful value campaigns and strength in eCommerce
Total sales revenue 2-year1 comp sales Sales per sqm
growth
$33.8bn 8.4% $17,847
+2.6% vs. pcp vs. pcp +1.7% vs. pcp
Exclusive to Coles eCommerce sales2 Customer satisfaction
sales
+5.3% +51.8% 89.7%
vs. pcp +2.6pp on FY20
vs. pcp
Gross margin EBIT EBIT margin
25.9% $1,702m 5.0%
+35bps vs. pcp +5.2% vs. pcp +13bps vs. pcp
1 Comparable 2-year growth is calculated as the aggregate of FY21 and FY20 growth rates.
2 eCommerce sales include Liquor sold through coles.com.au. 22Supermarkets FY21 results
Operating leverage with EBIT margin increasing to 5.0%
FY21 results Key commentary
• Sales growth supported by local shopping
$m FY21 FY20 Change
unwind, successful value campaigns,
Key P&L items execution across the MasterChef cookware
33,845 32,993 2.6%
and knives campaigns and continued strength
Sales revenue
in eCommerce
EBITDA 3,001 2,867 4.7%
• eCommerce contributed $2 billion of sales,
EBIT 1,702 1,618 5.2% growing by 52% as more consumers shifted
towards purchasing online, in part as a result
of lockdowns
Key metrics
• Gross margin increased by 35bps driven by
Comparable sales growth (%) 2.5 5.9 (337)bps strategic sourcing and Smarter Selling benefits,
despite additional COVID-19 costs and
Gross margin (%) 25.9 25.5 35bps business continuity costs at the Smeaton
CODB (%) (22)bps
Grange distribution centre
(20.8) (20.6)
EBIT margin (%) 5.0 4.9 13bps • CODB increased by 22bps largely due to
strategic investments in marketing and
Sales per square metre ($/m2) 17,847 17,547 1.7% technology initiatives and opex to support the
capex program, partially offset by Smarter
Price inflation (%) 0.8 2.4 (152)bps Selling benefits and lower COVID-19 costs
compared to the prior year
Price in/(de)flation excl.
(0.8) 1.5 (223)bps
tobacco and fresh (%)
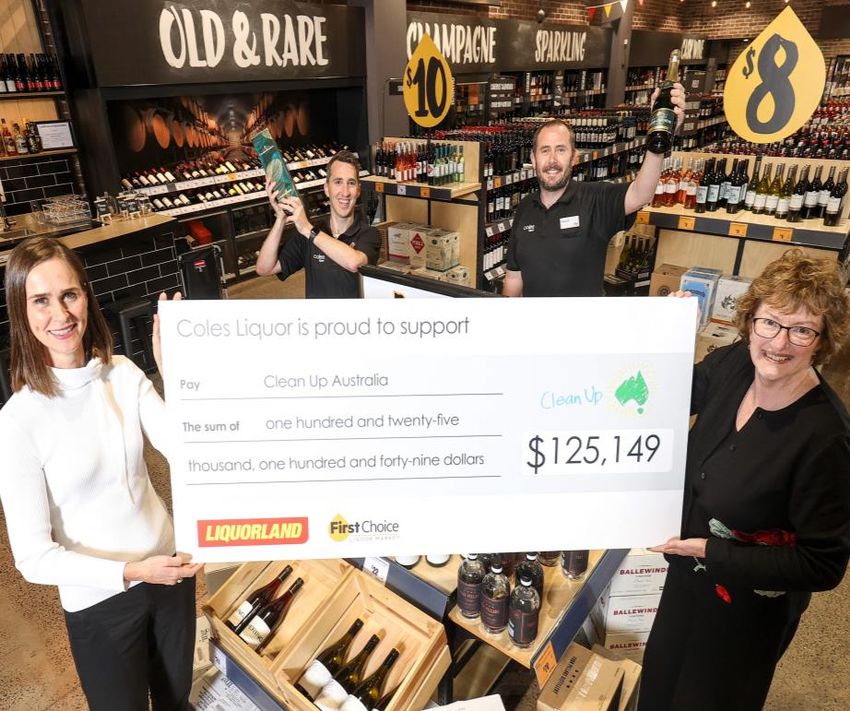
23Coles Liquor raised more than $125,000 in just two weeks to support Clean Up Australia in its mission to clean up, fix up and conserve the
environment (left). Investments were also made in eCommerce, including the roll out of Click & Collect (right).
LiquorLiquor key metrics
Sales growth driven by all banners, categories and states, underpinned by a
strong performance in eCommerce
Total sales revenue 2-year comp sales eCommerce sales2
growth1
$3.5bn 13.6% +78.6%
+6.6% vs. pcp vs. pcp vs. pcp
B&W Liquorland FCLM3 renewals Number of stores
format
79% 929
Moving from test of the fleet
to trial phase +19 vs. FY20
renewed
Gross margin EBIT EBIT margin
21.8% $165m 4.7%
23bps vs. pcp +19.6% vs. pcp +49bps vs. pcp
1 Comparable 2-year growth is calculated as the aggregate of FY21 and FY20 growth rates.
2 eCommerce sales exclude Liquor sold through coles.com.au which is reported in Supermarkets’ eCommerce sales.
3 First Choice Liquor Market.
25Liquor FY21 results
Progress made during the first year of Liquor’s refreshed strategy “to be a simpler,
more accessible, locally relevant drinks specialist”
FY21 results Key commentary
$m FY21 FY20 Change • Implemented a new customer focused
organisational structure, introduced simplified
Key P&L items operating model
Sales revenue 3,525 3,308 6.6%
• Investments in capacity, order fulfilment,
range and customer experience supported
EBITDA 276 242 14.0% eCommerce sales growth of 79%
EBIT 165 138 19.6% • Gross margin increased by 23bps largely due
to strategic sourcing benefits from improved
relationships with suppliers
Key metrics
• CODB improved by 26bps with strong cost
Comparable sales growth (%) 6.3 7.3 (99)bps control and volume growth from higher sales
fractionalising Liquor’s fixed cost base,
Gross margin (%) 21.8 21.6 23bps partially offset by strategic investments in
service
CODB (%) (17.1) (17.4) 26bps
EBIT margin (%) 4.7 4.2 49bps
26Coles Express self-serve coffee machine serving the award winning Urban Coffee Culture (left). Coles Express is also proud to support the Movember campaign for men’s health
(right).
ExpressExpress key metrics
Strong c-store sales driven by investments and range reviews
Total sales revenue 2-year comp sales EBIT
growth1
$1,192m 11.4% $67m
+7.7% vs. pcp vs. pcp +103.0% vs. pcp
FY21 weekly fuel Comp fuel volume Number of sites
volumes growth
57.1mL/wk (5.4)% 717
(4.0)% vs. pcp vs. pcp +4 vs. FY20
1 Comparable 2-year growth is calculated as the aggregate of FY21 and FY20 growth rates.
28Express FY21 results
Strong c-store sales and cost control supported an increase in Express EBIT
FY21 results Key commentary
$m FY21 FY20 Change
• Sales growth driven by food-to-go (inc
coffee) and cold drinks, supported by recent
Key P&L items investments in new self-serve coffee machines
C-store sale revenue 1,192 1,107 7.7% and fast-lane fridges
EBITDA 207 167 24.0% • Strategic investments made in the network,
including renewing over 80 sites together with
EBIT 67 33 103.0% our Alliance partner
• Average weekly fuel volumes of 57.1mL per
Key metrics week were recorded during the year
Comp c-store sales growth (%) 6.8 4.6 229bps • CODB improved by 404bps due to a strong
focus on cost control throughout the year
Weekly fuel volumes (mL) 57.1 59.5 (4.0)% and higher sales fractionalising Express’ fixed
Fuel volume growth (%) (4.0) (2.3) (165)bps cost base
Comp fuel volume growth (%) (5.4) (2.5) (292)bps • Gross margin decreased by 134bps largely
due to declining fuel volumes and lower fuel
Gross margin (%) 52.4 53.7 (134)bps
margin income
CODB (%) (46.7) (50.8) 404bps
EBIT margin (%) 5.7 3.0 270bps
29Coles is committed to supporting diversity through providing more opportunities for Indigenous peoples, suppliers and communities (left) and championing inclusion for our LGBTQI+
team members, customers and the community (right).
OutlookOutlook for FY22
▪ In Supermarkets, sales growth in the first 7 weeks of Q1 is approximately 1% on a headline basis and 12% on a two-year
headline basis as a result of the elevated sales from COVID-19. eCommerce penetration is approximately 8% in the first
quarter. In July, Supermarkets incurred around $15 million of COVID-19 costs .
▪ In Liquor, sales in the first 7 weeks of Q1 have remained strong as lockdowns continue, with headline growth flat and
approximately 19% on a two-year headline basis. Investments in the customer offer and capability as part of Liquor’s
refreshed strategy will also increase across the year, including the Liquorland renewal and new store program.
▪ In Express, fuel volumes continue to be impacted by lockdowns with average weekly fuel volumes of approximately
49mL in the first 7 weeks. In Q1, Express will be cycling elevated tobacco sales in the prior corresponding period, as well
as the impact of no increase in the tobacco excise in September 2021.
▪ In Other, FY22 corporate costs are expected to be approximately $75 million. Property earnings are expected to be
slightly below that achieved in FY21.
▪ Smarter Selling benefits are expected to be in excess of $200 million in FY22. Coles expects to renew approximately 50
stores and to open approximately 20 stores in FY22, subject to COVID-19 conditions.
▪ FY22 will be a significant year in both capital and operating expenditure as a result of Coles’ two major commitments
announced in FY19 focussed upon delivering world-class technology solutions to improve efficiencies and customer
experiences. For the two Witron centres, Coles continues to expect total capital investment of $950 million, of which
approximately $290 million will be incurred in FY22, along with increased levels of operating costs as Coles prepares for
start-up and double-running costs of the Queensland facility in 1HFY23. For the two Ocado CFCs, further project costs
will be incurred as Coles prepares to commence operations during FY23 in Melbourne and FY24 in Sydney, subject to
COVID-19 restrictions.
▪ Coles expects to incur one-off project operating costs of up to $75 million in FY22 and $160 million in FY23, across both
programmes, as previously advised. The longer term operational, customer and financial benefits of these new major
technology investments will be reflected in the Company’s financial performance, commencing in FY24 and beyond.
▪ Gross operating capital expenditure is expected to be up to $1.4 billion in FY22 as Coles invests in omnichannel offer
expansion for customers, Fresh Produce Easy Ordering, front end transformation, Coles Local and Liquorland renewals,
and new space. There is no change to current guidance of net property capital expenditure of +/-$100 million.
31Coles is proud to be the official Supermarket of the AFLW and AFL and to support grass roots athletics through Little Athletics.
Q&AYou can also read


