STABILITY, SECURITY & GROWTH - THROUGH QUALITY, DIVERSIFICATION & SCALE INVESTOR PRESENTATION - H&R REIT
←
→
Page content transcription
If your browser does not render page correctly, please read the page content below
STABILITY,
                                                SECURITY
                                                & GROWTH
                                                THROUGH QUALITY,
                                                DIVERSIFICATION & SCALE

INVESTOR
PRESENTATION
As at June 30, 2021
unless otherwise noted

H&R Real Estate Investment Trust (TSX: HR.UN)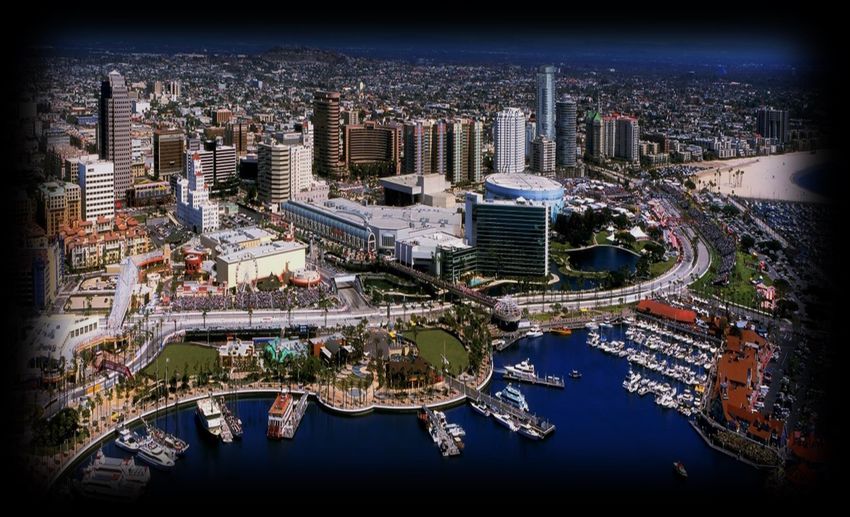
Caution Regarding Forward-looking
 Statements
                                                             Forward Looking Statements
Certain statements made in this presentation will contain forward‐looking information within the meaning of applicable securities laws (also known as forward‐looking
statements) including, among others, statements made or implied relating to H&R’s objectives, strategies to achieve those objectives, H&R’s beliefs, plans, estimates,
projections and intentions and statements with respect to H&R’s development activities, including planned future expansions, and building of new properties; the expected
yield on cost of H&R’s developments and other investments; the expected costs and timing of any of H&R’s projects; and the expected occupancy, management’s
expectations regarding future intensification opportunities including the timing of approvals for re-zoning and site plan applications, the impact of the COVID-19 virus on the
REIT and REIT’s tenants, the REIT’s bad debt and expected credit loss. Statements concerning forward‐looking information can be identified by words such as “outlook”,
“objective”, “may”, “will”, “expect”, “intend”, “estimate”, “anticipate”, “believe”, “should”, “plans”, “project”, “budget” or “continue” or similar expressions suggesting
future outcomes or events. Such forward‐looking statements reflect H&R’s current beliefs and are based on information currently available to management.
Forward‐looking statements are provided for the purpose of presenting information about management’s current expectations and plans relating to the future and readers
are cautioned that such statements may not be appropriate for other purposes. These statements are not guarantees of future performance and are based on H&R’s
estimates and assumptions that are subject to risks and uncertainties, including those discussed in H&R’s materials filed with the Canadian securities regulatory authorities
from time to time, including H&R’s MD&A for the quarter ended June 30, 2021, and H&R’s most recently filed annual information form, which could cause the actual results
and performance of H&R to differ materially from the forward‐looking statements made in this presentation. Although the forward‐looking statements made in this
presentation are based upon what H&R believes are reasonable assumptions, there can be no assurance that actual results will be consistent with these forward‐looking
statements. Readers are also urged to examine H&R’s materials filed with the Canadian securities regulatory authorities from time to time as they may contain discussions
on risks and uncertainties which could cause the actual results and performance of H&R to differ materially from the forward‐looking statements made in this presentation.
All forward‐looking statements made in this presentation are qualified by these cautionary statements. These forward‐looking statements are made as of August 12, 2021
and H&R, except as required by applicable law, assumes no obligation to update or revise them to reflect new information or the occurrence of future events or
circumstances.

                                                                    Non-GAAP Measures
The REIT’s Q2 2021 financial statements are prepared in accordance with International Accounting Standard (“IAS”) 34, Interim Financial Reporting. H&R’s management uses
a number of measures which do not have a meaning recognized or standardized under International Financial Reporting Standards (“IFRS”) or Canadian Generally Accepted
Accounting Principles (“GAAP”). The non-GAAP measures REIT’s proportionate share, property operating income (cash basis), Same-Asset property operating income (cash
basis), Funds from Operations (“FFO”), Adjusted Funds from Operations (“AFFO”), Payout Ratio per Unit as a % of AFFO, Interest Coverage ratio, Debt/Earnings before
interest, taxes, depreciation and amortization (“EBITDA”) and Net Asset Value (“NAV”), as well as other non-GAAP measures discussed elsewhere in this presentation,
should not be construed as an alternative to financial measures calculated in accordance with GAAP. Further, H&R’s method of calculating these supplemental non-GAAP
financial measures may differ from the methods of other real estate investment trusts or other issuers, and accordingly may not be comparable. H&R uses these measures
to better assess its underlying performance and provides these additional measures so that investors may do the same. These non-GAAP financial measures are more fully
defined and discussed in H&R’s MD&A as at and for the six months ended June 30, 2021, available at www.hr-reit.com and on www.sedar.com.

                                                                                  Other
All figures have been reported at H&R’s ownership interest unless otherwise stated.
Balance Sheet figures have been converted at $1.24 CAD for each U.S. $1.00.
Income Statement figures have been converted at $1.25 CAD for each U.S. $1.00.

 2                  STABILITY, SECURITY & GROWTH through QUALITY, DIVERSIFICATION & SCALE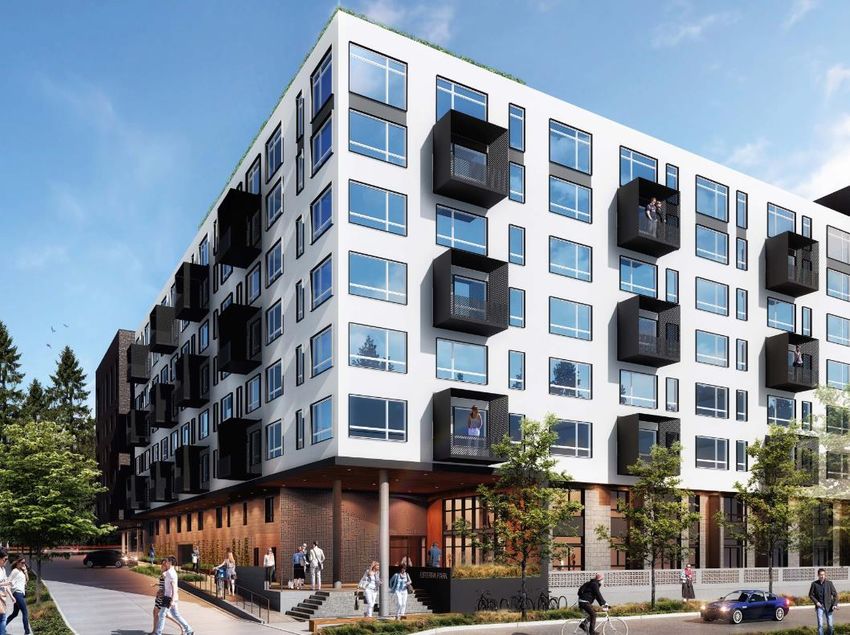
Stability, Security & Growth through
Quality, Diversification & Scale

     One of the Largest REITs in
                                                                                                                         Fully Internalized Management
     Canada with total assets of                                           H&R REIT                                              (Insiders own 6%)
            $13.1 billion

           Office(1)                                   Retail(1)                              Industrial(1)                            Residential(1)
                                                            (Primaris)                                                                 (Lantower Residential)

         32 Properties                               321 Properties                              80 Properties                           24 Properties
    ~10,567,000 Square Feet                     ~13,682,000 Square Feet                     ~8,984,000 Square Feet               8,359 Residential Rental Units

Gotham,     Front St.,   Corus Quay,        Orchard Park,            Dufferin Mall,    Purolator,           Unilever,            Grande Pines,           Legacy Lakes,
New York    Toronto        Toronto            Kelowna                  Toronto          Calgary            Mississauga             Orlando                  Dallas

      Long Term Leases                          Stable Performance                           Pension Fund JV                     High Growth Opportunity

(1) Figures above are at H&R’s ownership interest including equity accounted investments.

3                STABILITY, SECURITY & GROWTH through QUALITY, DIVERSIFICATION & SCALE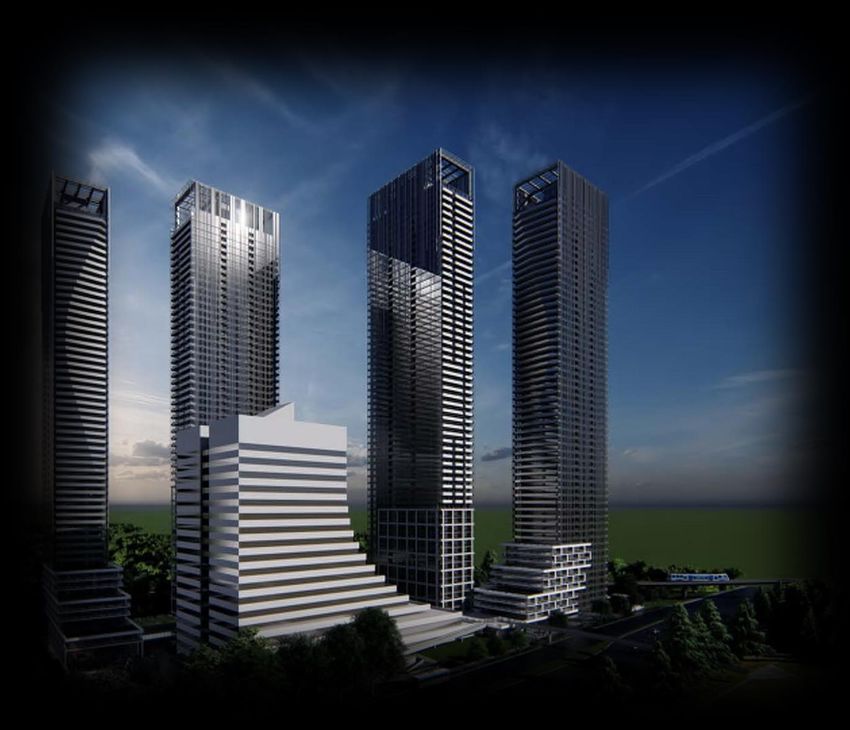
Executing on Strategic Initiatives

                                                        The Bow and Bell Campus                                      Materially
Commitment to our            Properties in                                                   Working towards a
                                                            Office Dispositions                                      enhance
  Environmental,            lease-up: River                                                    more simplified
                                                     Enhances financial and strategic                                the value
Social & Governance            Landing &                                                   structure to create and
                                                       flexibility, facilitating further                               of our
       policies              Jackson Park                                                     surface significant
  (Slides: 36 to 40)
                                                           significant next steps                                    company
                             (Slides: 5 to 7)                                               value for unitholders
                                                             (Slides 8, 10 to 13)

        We have laid the foundation for the next step in our strategic plan, enabling us to create

                                     and surface significant value for our unitholders.

 4              STABILITY, SECURITY & GROWTH through QUALITY, DIVERSIFICATION & SCALE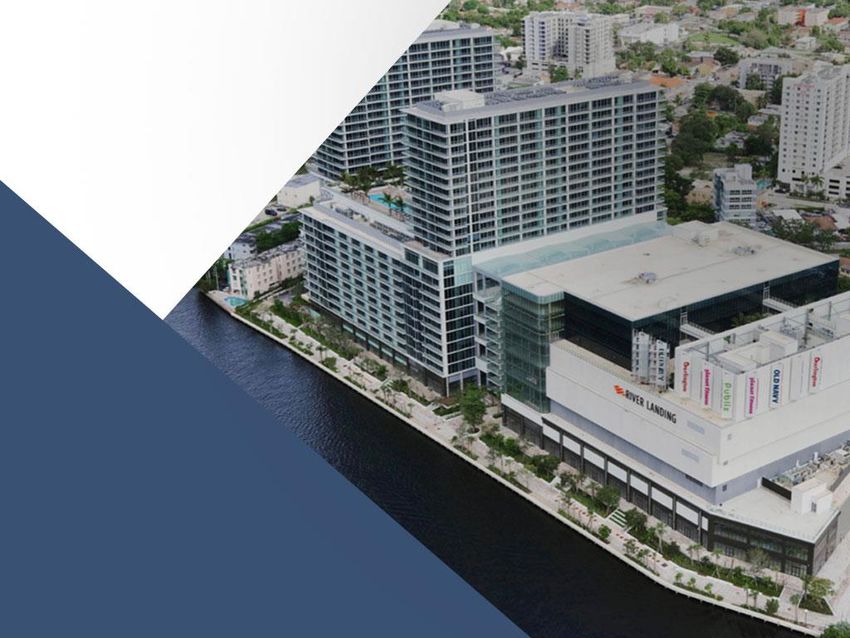
Significant Acceleration in Property Lease-up

▪ Lease-up is exceeding management expectations, offsetting almost all of the FFO per unit
  dilution from the announced office and industrial property sales.

                                           Property operating income (cash basis)
                                                                                                                               Committed
                                                Annualized               Stabilized         Expected      Occupancy as at    occupancy as at
    Property                Q2 2021                Q2 2021                 Year 1            Increase      June 30, 2021      August 2, 2021

                                                                                                            Retail 77.2%       Retail 87.8%

 River Landing,
                           U.S. $2.3M              U.S. $9.2M           U.S. $24.8M         U.S. $15.6M   Residential 59.1% Residential 86.6%
    Miami, FL

                                                                                                             Office 0%         Office 34.9%

 Jackson Park,
Long Island City,          U.S. $2.3M              U.S. $9.2M           U.S. $32.0M         U.S. $22.8M        61.6%              96.8%
      NY(1)

(1) Figures above are at H&R’s ownership interest including equity accounted investments.

5               STABILITY, SECURITY & GROWTH through QUALITY, DIVERSIFICATION & SCALE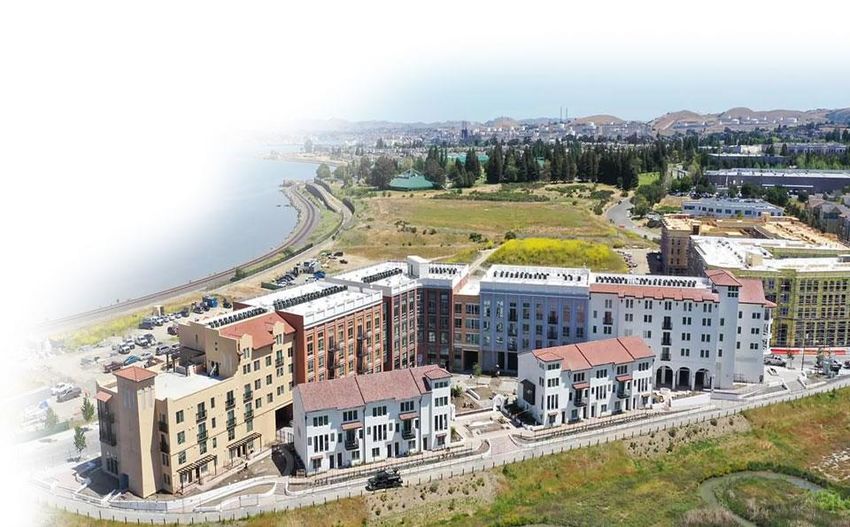
Properties in Lease-up:
 River Landing – Miami, FL
▪ Between Q4 2020 and Q2 2021, U.S. $495.9 million was transferred from properties under
  development to investment properties
▪ Annual property operating income (cash basis) once lease-up is complete is expected to be
  approximately U.S. $24.8 million
▪ Strong Leasing Progress:
     ▪ In Q2 2021, the REIT signed a lease with the Office of the State
       Attorney – Miami-Dade County, to occupy approximately 50,000
       square feet of office space
     ▪ Committed residential occupancy of 86.6% as at August 2, 2021
       represents 457 of 528 residential units leased, exceeding
       management’s expectations on leasing velocity

 6             STABILITY, SECURITY & GROWTH through QUALITY, DIVERSIFICATION & SCALE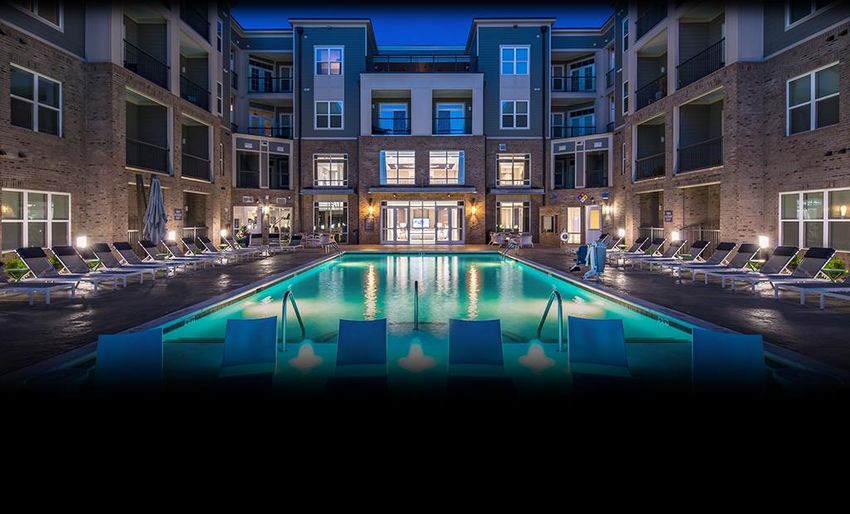
Properties in Lease-up:
 Jackson Park – Long Island City, NY(1)
▪ Annual property operating income (cash basis) once lease-up is complete is expected to be
  approximately U.S. $32.0 million
▪ Committed occupancy of 96.8% as at August 2, 2021 vs. June 30, 2021 occupancy of 61.6%
       ▪ Notably, 456 leases were signed in the month of June which represented the greatest number of leases signed
         in any single month at Jackson Park
▪ As a result of the significant leasing completed, H&R expects significant up-front leasing costs to
  negatively impact Jackson Park’s property operating income in Q3 2021. H&R expects property
  operating income (cash basis) to significantly increase commencing in Q4 2021

     (1) Figures above are at H&R’s ownership interest including equity accounted investments.

 7                STABILITY, SECURITY & GROWTH through QUALITY, DIVERSIFICATION & SCALE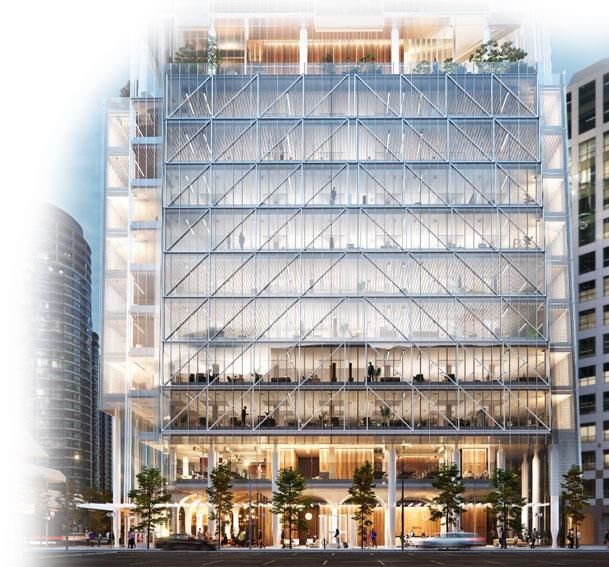
Subsequent Events: Office Dispositions

▪ The sales are subject to customary closing conditions, with closing targeted to be Q3 2021

                                                                          Retained                          Value
                                                             Per sq.ft.    Asset      Total                Relative
       Asset               Description            Proceeds    of Value      Value     Value    Q1 IFRS FV to IFRS FV                      Details
                    • Sale of 100% of the land                                                                         • H&R has an option to repurchase the land
                      and building                                                                                       and buildings for $735M at the end of the
                                                   $613M
                    • Sale of a 40% interest in                                                                          Ovintiv lease in 2038 (60% of total
                      the Ovintiv lease                                                                                  transaction value of $1.2 billion)
                                                                                                                       • H&R retains 15% interest in Ovintiv lease
       Bow                                                   ~$608/sf      $185M     $1,216M    $942M       $274M         net rent payable
                                                                                                                       • H&R retains 100% interest in South Block
                    • Sale of a 45% interest in                                                                           adjacent lands
                                                   $418M                                                               • H&R retains property management for
                      the Ovintiv lease
                                                                                                                         remaining lease term
                                                                                                                       • H&R to retain $18M of annual income from
                                                                                                                         the Bow with NPV of ~$177M
                                                                                                                       • H&R to continue property management for
                                                                                                                         the remainder of the leases, which expire
    Bell Campus     • Sale of 100% ownership       $439M      $400/sf      $18M      $457M      $525M       $(68)M       between 2035 and 2038
                                                                                                                       • $1.6M annually in management fees with
                                                                                                                          NPV of ~$18M
       Total                                      $1,470M                  $203M     $1,673M   $1,467M      $206M

8                 STABILITY, SECURITY & GROWTH through QUALITY, DIVERSIFICATION & SCALE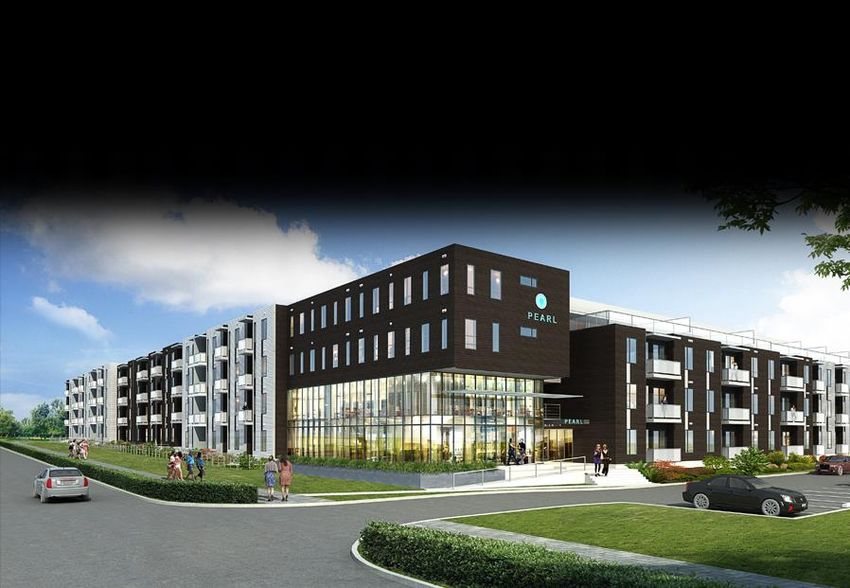
Q2 2021 and July 2021 Industrial Dispositions

    ▪ In July 2021, the REIT sold its 50% ownership interest in a portfolio of nine single tenanted
      cold storage properties for approximately $117.5M
    ▪ This transaction along with the six industrial properties sold in Q2 2021 resulted in H&R
      disposing a 50% ownership interest in 15 industrial properties for total proceeds of
      approximately $150.8 million, compared to H&R’s IFRS fair value of $121.3 million as at
      March 31, 2021
    ▪ The weighted average overall capitalization rate for these dispositions was approximately
      4.1%

9           STABILITY, SECURITY & GROWTH through QUALITY, DIVERSIFICATION & SCALE
Pro-Forma Impact of Dispositions & Lease-up

▪ These dispositions are aligned with H&R’s commitment to an ongoing evaluation of strategic
  initiatives and have a significantly positive impact on pro-forma credit metrics
                                                (1)                     (1)
                                     Q2 2021                Proforma
                                                                               • Reduces exposure to weak office
     Calgary Office exposure             9%                      3%
                                                                                 market
                                                                               • Reduces exposure to one of North
                                                                                 America’s largest oil and gas
             Ovintiv                    12%                      2%              producers
                                                                               • Enhances Top Tenant profile

          Bell Canada                    9%                      5%            • Enhances Top Tenant profile
                                                                               • Reduces exposure to largest
         Top 10 tenants                 44%                     34%              tenants and diversifies revenue
                                                                                 stream
         Debt(2)/EBITDA                 9.85x                   8.59x
           (2)
       Debt /Total Assets               50%                     44%            • Enhances credit metrics
     Unencumbered Assets/
                                        1.65x                   2.25x
        Unsecured Debt
                                                                               • FFO dilution offset by strong
          FFO per Unit                  $0.38                   $0.37                                                     Proforma quarterly
                                                                                 residential lease-up
                                                                                                                             FFO per Unit
                                                                                                                    Office transaction
                                                                                                                                         ($0.05)
1) Figures above are at H&R’s ownership interest including equity accounted investments.                                  impact
2) Debt includes mortgages payable, debentures payable, unsecured term loans and lines of credit.
                                                                                                                     Lease-up impact     $0.04

10                STABILITY, SECURITY & GROWTH through QUALITY, DIVERSIFICATION & SCALE                                    Net           ($0.01)
Pro-Forma Impact of Dispositions
Fair Value of Investment Properties by Segment(1)
As at June 30, 2021 Pro-Forma
Office Offi ce
38% 32%
Industrial
8%
$13.0 $11.5
Industrial
Billion 8% Billion
Retail
31% Retail Res idential
35% 25%
Residential
23%
457 Properties / 41 million sq.ft. 442 Properties / 37 million sq.ft.
Reduction in office; Strategic Review continues to focus on portfolio optimization
1) Figures above are at H&R’s ownership interest including equity accounted investments and excludes assets classified as held for sale.
11 STABILITY, SECURITY & GROWTH through QUALITY, DIVERSIFICATION & SCALEPro-Forma Impact of Dispositions
Fair Value of Investment Properties by Region(1)
As at June 30, 2021 Pro-Forma
Ontario Ontario
30% 29%
$13.0 Alberta
$11.5
Alberta
18%
Billion 13% Billion
United States
43%
United States
49%
Other Canadian
Provinces
Other Canadian Provinces 9%
9%
457 Properties / 41 million sq.ft. 442 Properties / 37 million sq.ft.
Reduction in Alberta exposure from 18% to 13%
1) Figures above are at H&R’s ownership interest including equity accounted investments and excludes assets classified as held for sale.
12 STABILITY, SECURITY & GROWTH through QUALITY, DIVERSIFICATION & SCALEPro-Forma Impact of Dispositions: Top 10 Tenants
As at June 30, 2021(1) Pro-Forma(1)
Average Average
% of H&R % of H&R
Number Lease Credit Number Lease Credit
Rental Owned Rental Owned
Tenant of Term to Ratings Tenant of Term to Ratings
from sq.ft. (in from sq.ft. (in
Locations Maturity (S&P) Locations Maturity (S&P)
IP 000’s) IP 000’s)
(in Years) (in Years)
1. 12.4% 1 1,997 16.9 BBB- Stable 1. 6.6% 1 845 11.7 BBB- Stable
2. 8.8% 23 2,536 13.2 BBB+ Stable 2. 4.9% 20 1,396 10.8 BBB+ Stable
3. 5.6% 1 845 11.7 BBB- Stable 3. 4.8% 1 660 9.4 A+ Negative
4. 4.1% 1 660 9.4 A+ Negative 4. 3.9% 195 1,610 10.2 Not Rated
5. 3.3% 195 1,610 10.2 Not Rated 5. 3.6% 19 2,682 5.7 BBB Stable
6. 3.0% 19 2,682 5.7 BBB Stable 6. 2.4% 1 466 9.8 BBB+ Stable
7. 2.1% 1 466 9.8 BBB+ Stable 7. 2.3% 1 472 11.7 BB Stable
8. 2.0% 1 472 11.7 BB Stable 8. 2.2% - - 16.9 BBB- Stable
9. 1.7% 13 1,346 12.8 BBB+ Stable 9. 2.0% 13 1,346 12.8 BBB+ Stable
BBB+
10. 1.2% 17 356 4.1 10. 1.4% 17 356 4.1 BBB+ Negative
Negative
Total 44.2% 272 12,970 12.2 Total 34.1% 268 9,833 10.3
Reduction in Ovintiv exposure from 12% to 2% of rental income
1) Figures above are at H&R’s ownership interest including equity accounted investments.
13 STABILITY, SECURITY & GROWTH through QUALITY, DIVERSIFICATION & SCALEOffice Portfolio
▪ Fair value of investment properties: $5.0 billion (weighted average cap rate: 6.57%)
▪ Mortgages payable: $1.4 billion with a weighted average interest rate (“WAIR”) of 4.0%
and a weighted average term of maturity (“WATM”) of 2.7 years
▪ Average remaining lease term to maturity: 12.0 years
▪ Occupancy: 99.1%
▪ Revenue from tenants with investment grade ratings: 85.7%
Canada United
Ontario Alberta Other Subtotal Total
States
Number of properties 20 4 4 28 4 32
Square feet (in thousands) 5,374 2,607 893 8,874 1,693 10,567
310-320-330 Front St.| Toronto Corus Quay | Toronto Hess Tower | Houston 2 Gotham Centre | New York
14 STABILITY, SECURITY & GROWTH through QUALITY, DIVERSIFICATION & SCALERetail Portfolio(1)
▪ Fair value of investment properties: $4.0 billion (weighted average cap rate: 6.78%)
▪ Mortgages payable: $745.9 million with a WAIR of 3.4% and a WATM of 3.5 years
▪ Average remaining lease term to maturity: 6.7 years
▪ Occupancy: 90.0%
Canada United States
Total
Ontario Alberta Other Subtotal ECHO Other Subtotal
Number of properties 36 17 14 67 237 17 254 321
Square feet (in thousands) 3,459 3,947 2,720 10,126 2,856 700 3,556 13,682
Enclosed Grocery
Shopping Centre Anchored ECHO Other Total
Number of properties 17 22 237 45 321
Square feet (in thousands) 6,882 1,007 2,856 2,937 13,682
Weighted average cap rates 7.14% 6.36% 6.58% 6.22% 6.78%
Orchard Park | Kelowna Dufferin Mall | Toronto Stone Road Mall | Guelph
1) Figures above are at H&R’s ownership interest including equity accounted investments.
15 STABILITY, SECURITY & GROWTH through QUALITY, DIVERSIFICATION & SCALERetail Tenant Sales Mix(1)
By Gross Rent(2)
Full Service Restaurants
2% HBC
Entertainment (Casino & Theatre) 2%
Automotive 3% Fashion
4% 16%
Office/Financial
Institutions
5%
Food
7% Walmart/
Grocery/
Liquor/
Cannibis
15%
General
Merchandise
9%
Large format Large format
fashion non-fashion
12% 13%
Personal Care/Service (including fitness)
12%
(1) Excluding ECHO.
(2) Gross Rent is based on estimated annualized gross revenue for retail tenants only, excluding straight-lining of contractual rent, rent amortization of tenant
inducements and capital expenditure recoveries. Retail revenue as a percentage of total revenue was 32.2% for the quarter ended June 30, 2021.
16 STABILITY, SECURITY & GROWTH through QUALITY, DIVERSIFICATION & SCALE(1)
Top 15 Retail Tenants by Revenue
% of rental income from Number of H&R owned Average lease term Credit Ratings
(2) (3)
Tenant investment properties locations sq.ft. (in 000’s) to maturity (years) (S&P)
1. Giant Eagle, Inc. 3.3% 195 1,610 10.2 Not Rated
(4)
2. Lowe's Companies, Inc. 1.7% 13 1,346 12.8 BBB+ Stable
(5)
3. Canadian Tire Corporation 1.3% 17 578 5.8 BBB Stable
(6)
4. Loblaw Companies Limited 0.9% 18 262 7.5 BBB Stable
(7)
5. Empire Company Limited 0.9% 14 492 9.8 BBB- Stable
(8)
6. The TJX Companies Inc. 0.9% 17 429 6.2 A Stable
(9)
7. Walmart Inc. 0.8% 9 751 8.9 AA Stable
8. Shell Oil Products 0.8% 12 152 2.2 A+ Stable
9. Metro Inc. 0.7% 12 420 5.5 BBB Stable
10. Bell Canada 0.5% 17 52 1.8 BBB+ Stable
11. Hudson's Bay Company 0.5% 6 589 6.0 Not Rated
(10)
12. YM Inc. 0.5% 14 216 4.6 Not Rated
(11)
13. Gap Inc. 0.4% 9 121 4.2 BB- Positive
14. Best Buy Co. Inc. 0.4% 8 142 4.2 BBB+ Stable
15. Indigo Books & Music 0.3% 11 112 5.5 Not Rated
13.9% 372 7,272 9.5
1) Figures above are at H&R’s ownership interest including equity accounted investments.
(1) The percentage of rentals from investment properties is based on estimated annualized gross revenue excluding straight-lining of contractual rent, rent
amortization of tenant inducements and capital expenditure recoveries.
(2) Average lease term to maturity is weighted based on net rent.
(3) Lowe’s Companies, Inc. includes Rona.
(4) Canadian Tire Corporation includes Canadian Tire, Mark’s, Sport Chek, Atmosphere, Sports Experts and Party City.
(5) Loblaw Companies Limited includes Loblaw, No Frills and Shoppers Drug Mart.
(6) Empire Company Limited includes Sobeys Capital Inc., Safeway and Lawtons Drugs.
(7) The TJX Companies Inc. includes Winners, T.J. Maxx, Marshalls and Home Sense.
(8) Walmart Inc. includes Sam's Club.
(9) YM Inc. includes Amnesia, Bluenotes, Sirens, Suzy Shier, Urban Planet, Urban Kids and West 49.
(10) Gap Inc. includes Old Navy.
17 STABILITY, SECURITY & GROWTH through QUALITY, DIVERSIFICATION & SCALEIndustrial Portfolio(1)
▪ Fair value of investment properties: $1.1 billion (weighted average cap rate: 5.27%)
▪ Mortgages payable: $297.8 million with a WAIR of 4.3% and a WATM of 4.7 years
▪ Average remaining lease term to maturity: 6.5 years
▪ Occupancy: 96.7%
Canada United
Total(1)
Ontario Alberta Other Subtotal States
Number of properties 35 19 23 77 3 80
Square feet (in thousands) 4,821 2,030 1,433 8,284 700 8,984
▪ H&R has a 50% ownership interest in 71 of the 80 properties
through a joint venture partnership with PSP Investment Board
and Crestpoint Real Estate Investments Ltd.
Sleep Country
GTA
1) Figures above are at H&R’s ownership interest including equity accounted investments. Canadian Tire
GTA
18 STABILITY, SECURITY & GROWTH through QUALITY, DIVERSIFICATION & SCALEResidential Portfolio(1)
▪ Fair value of investment properties: U.S. $2.3 billion (weighted average cap rate: 4.55%)
▪ Mortgages payable: U.S. $1.3 billion with a WAIR of 3.6% and a WATM of 6.9 years
▪ Average age of properties: 6.3 years
▪ Occupancy: 89.2%
North
Texas Florida Carolina New York California Total
Number of properties 9 8 5 1 1 24
Number of residential rental units 2,776 2,961 1,632 936 54 8,359
Ambrosio | Texas Jackson Park | New York Westshore | Florida
1) Figures above are at H&R’s ownership interest including equity accounted investments.
19 STABILITY, SECURITY & GROWTH through QUALITY, DIVERSIFICATION & SCALE▪ Our strategy is to acquire or develop class A properties in U.S. Sun Belt cities where there is strong population and employment growth and to develop properties with partners in Gateway cities 20 STABILITY, SECURITY & GROWTH through QUALITY, DIVERSIFICATION & SCALE
Limited Lease Rollover (1)

     ▪ Low-risk rollover schedule
     ▪ Well diversified by property and geography
     ▪ Average remaining lease term of 9.4 years, one of the longest in the industry

 Canadian Portfolio
                                                            2,022                                        2,113                          Industrial
 (in 000’s sq.ft.)                                                                                                              1,684
                                                                                                                                        Retail
                                                                                   1,221
                                                                                                                                        Office
                                      455

                                     2021                   2022                  2023                   2024                   2025
 % of the REIT‘s GLA                 1.4%                   6.1%                   3.7%                   6.4%                   5.1%

 U.S. Portfolio
 (in 000’s sq.ft.)
                                                                                                                                        Industrial
                                                                                                                                        Retail
                                                                                   690
                                      107                    219                                          290                    294    Office

                                     2021                   2022                  2023                   2024                   2025
 % of the REIT’s GLA                 0.3%                   0.7%                   2.1%                   0.9%                   0.9%

     (1) Figures above are at H&R’s ownership interest including equity accounted investments and excludes residential properties.

21                  STABILITY, SECURITY & GROWTH through QUALITY, DIVERSIFICATION & SCALE
Q2 2021 Financial Highlights
▪ FFO was $0.38 per Unit vs. $0.38 per Unit in Q2 2020
▪ AFFO was $0.30 per Unit vs. $0.30 per Unit in Q2 2020
▪ Payout ratio as a % of AFFO was 57.7%
▪ River Landing in Miami, FL achieved final completion and the second residential tower was
transferred from properties under development to investment properties
▪ H&R sold its 50% ownership interest in six industrial properties totalling 251,641 square
feet for approximately $33.3M
▪ H&R currently has two properties in lease-up: River Landing and Jackson Park
▪ $989.5 million of undrawn credit facilities available under H&R’s lines of credit
▪ Unencumbered asset pool of $4.0 billion
▪ Debt to total assets was 46.3% compared to 47.7% as at December 31, 2020
22 STABILITY, SECURITY & GROWTH through QUALITY, DIVERSIFICATION & SCALEStrong Balance Sheet
BBB (High) Unencumbered Available under Interest WAIR(1) WATM(1)
Negative Trend Assets Lines of Credit Coverage
by DBRS $4.0B $989.5M 3.5% 3.5 years
2.8x
Unsecured Debt(1) to Total Assets
Mortgages 27% 50%
Debentures 15% 47.7% (2)
46.3%
44.6% 44.6% 44.4%
45%
Unsecured Term
Total Loans 4%
Capitalization 40%
$12.5 Billion Lines of Credit
3%
35%
Unitholders' Equity and
Exchangeable Units 30%
51% 2017 2018 2019 2020 Q2 2021
Other Disclosures on this slide
DBRS rating
(1) Debt includes mortgages payable, debentures payable, unsecured term loans and lines of credit.
(2) The increase in debt to total assets from 2019 to 2020 is primarily due to fair value adjustments to certain office and retail properties totaling $1.2 billion.
23 STABILITY, SECURITY & GROWTH through QUALITY, DIVERSIFICATION & SCALECanadian Properties Under Development
(in thousands of Canadian Dollars)
At H&R's Ownership Interest
As at June 30, 2021 (in thousands of Canadian dollars)
Total Properties Costs Expected Expected
Ownership Number of Development Under Remaining Yield Completion
Interest Acres Budget Development to Complete on Cost Date
Current Developments:
34 Speirs Giffen Ave., Caledon, ON (1) 100.0% 4.9 $16,342 $6,193 $10,149 7.0% Q2 2022
140 Speirs Giffen Ave., Caledon, ON 100.0% 4.7 14,358 5,561 8,797 6.0% Q2 2022
9.6 30,700 11,754 18,946
Future Developments:
Industrial Lands (Remaining lands), Caledon, ON 100.0% 117.6 - 74,871 -
(2)
7333 Mississauga Rd. N., Mississauga, ON 100.0% 15.4 - 20,975 -
(3)
Slate Dr., Mississauga, ON 50.0% 24.6 - 19,971 -
(4)
3791 Kingsway, Burnaby, BC 50.0% 0.6 - 7,908 -
158.2 - 123,725 -
Total 167.8 $30,700 $135,479 $18,946
(1) In April 2021, H&R entered into a 10-year lease with an industrial tenant to occupy the entire property totaling 105,014 square feet.
(2) Expected to be developed into two industrial buildings totalling approximately 329,000 square feet.
(3) Expected to be developed into industrial property.
(4) Excess lands held for future-redevelopment. These lands are adjacent to the REIT’s 3777 Kingsway office tower of which it also has a 50% ownership interest.
24 STABILITY, SECURITY & GROWTH through QUALITY, DIVERSIFICATION & SCALEU.S. Properties Under Development
(in thousands of U.S. Dollars)
At H&R Ownership Interest
As at June 30, 2021 (in thousands of U.S. dollars)
Total Properties Costs Construction Expected Expected
Ownership Number Development Under Remaining to Financing Yield Completion
Development Name Interest of Acres Budget Development Complete Available on Cost Date
Current Developments:
Shoreline, Long Beach, CA(1) 31.2% 0.9 $71,097 $60,035 $11,062 $11,108 6.2% Q1 2022
(2)
Hercules Project (Phase 2), Hercules, CA 31.7% 2.8 31,633 28,282 3,351 5,180 6.0% Q4 2021
(3)
The Pearl, Austin, TX 33.3% 5.0 24,398 22,844 1,554 1,761 6.2% Q4 2021
(4)
Esterra Park, Seattle, WA 33.3% 1.1 32,537 32,131 406 1,554 6.0% Q4 2021
9.8 159,665 143,292 16,373 19,603
Future Developments:
Jersey City Lands, Jersey City, NJ 100.0% 12.4 - 162,857 - -
(5)
Other Remaining Future Developments 99.0 - 104,303 - -
111.4 - 267,160 - -
Total (excluding ECHO) 121.2 $159,665 $410,452 $16,373 $19,603
(1) 35-storey residential tower consisting of 315 luxury residential rental units and 6,450 square feet of retail space.
(2) Total project spans 38.4 acres. Construction commenced in June 2018 on Phase 1 of this project which was substantially completed and transferred to
investment properties in Q4 2020. Construction commenced in March 2019 on Phase 2 of this project which will consist of 232 residential rental units.
Future phases will be announced as further development information becomes available.
(3) Residential development consisting of 383 residential rental units which is close to major technology employers including Apple, IBM, Oracle and Samsung
as well as the University of Texas at Austin and downtown Austin.
(4) Seven-storey residential tower consisting of 263 residential rental units, which is part of a larger master planned community and is adjacent to transit,
Microsoft Corporation’s headquarters, and future light rail which is expected to be completed in 2023.
(5) Consists of seven separate parcels of land in the United States totalling 99.0 acres. H&R has a 31.7% interest in one of the parcels amounting to U.S. $12.2
million at H&R’s ownership interest. H&R is the sole owner of the remaining six parcels.
25 STABILITY, SECURITY & GROWTH through QUALITY, DIVERSIFICATION & SCALEShoreline Gateway - Long Beach, CA
FACT SHEET
Residential development site
H&R Ownership: 31.2%
35-storey residential tower
consisting of 315 residential rental
units and 6,450 sf of retail space
Will become the tallest residential
tower in Long Beach with views
overlooking the Pacific Ocean
Development budget of U.S.
$71.1M and construction financing
of U.S. $41.1M has been secured,
both at H&R’s ownership interest
Expected to be completed in Q1
2022
26 STABILITY, SECURITY & GROWTH through QUALITY, DIVERSIFICATION & SCALEHercules Bayfront – San Francisco, CA
PHASE 1: PHASE 2:
“The Exchange at Bayfront” “The Grand at Bayfront”
In Q4 2020, The Exchange at Bayfront 232 residential rental units, including a state-of-
consisted of 172 residential rental units, the-art fitness center, bike shop, residents lounge
including lofts and townhomes and 13,762 and sporting club. Total development budget of
square feet of ground level retail space, U.S. $31.6 million and construction financing of
reached substantial completion and was U.S. $20.7 million has been secured, both at H&R’s
transferred from properties under ownership interest. Expected to be completed in
development to investment properties. Q4 2021.
H&R OWNERSHIP: 31.7%
38.4 acres of land to be
developed into a
waterfront master
planned community
which will be surrounded
by a future intermodal
transit centre.
27 STABILITY, SECURITY & GROWTH through QUALITY, DIVERSIFICATION & SCALEThe Pearl - Austin, TX
FACT SHEET
Residential development site
H&R Ownership: 33.3%
383 residential rental units
Close to major technology
employers, including Apple, IBM,
Oracle and Samsung, as well as the
University of Texas at Austin and
downtown Austin
Development budget of U.S.
$24.4M and construction financing
of U.S. $16.0M has been secured,
both at H&R’s ownership interest
Expected completion: Q4 2021
28 STABILITY, SECURITY & GROWTH through QUALITY, DIVERSIFICATION & SCALEEsterra Park - Seattle, WA
FACT SHEET
Residential development site
H&R Ownership: 33.3%
263 residential rental units
Part of a larger master planned
community and is adjacent to
Microsoft Corporation’s headquarters,
bus transit and future light rail, which
is expected to be completed in 2023
Development budget of U.S. $32.5M
and construction financing of U.S.
$22.2M has been secured, both at
H&R’s ownership interest
Expected completion: Q4 2021
29 STABILITY, SECURITY & GROWTH through QUALITY, DIVERSIFICATION & SCALEFuture Intensification Opportunities
Office Opportunities: Retail Opportunities:
▪ 3777 & 3791 Kingsway Street, Burnaby, BC ▪ Dufferin Mall, Toronto, ON
▪ 145 Wellington Street W., Toronto, ON ▪ Grant Park, Winnipeg, MB
▪ 53 & 55 Yonge Street, Toronto, ON ▪ Kildonan Place, Winnipeg, MB
▪ 310-320-330 Front Street W., Toronto, ON ▪ Northland Village, Calgary, AB
▪ Orchard Park Shopping Centre, Kelowna, BC
▪ Place d’Orleans, Orleans, ON
▪ Sunridge Mall, Calgary, AB
30 STABILITY, SECURITY & GROWTH through QUALITY, DIVERSIFICATION & SCALE3777 & 3791 Kingsway – Burnaby, BC
LOCATION
3777 & 3791 Kingsway is located along
the Kingsway at the intersection with
Boundary Rd., directly across from
Central Park. The park is 220-acres of
green space including walking trails,
playgrounds, and other outdoor
activities.
THE PROJECT
• In June 2020, H&R along with its
partner, submitted a re-zoning
application for the east and north
portions of its 3777 & 3791
Kingsway sites
• The proposal will add approximately
2,000 residential rental units in four
mixed-use high-density towers
including retail and residential uses
with approximately 1,900,000
square feet of residential area and
47,000 square feet of commercial
area
• The REIT expects to obtain approval
for its re-zoning and site plan
applications in Q1 2023
31 STABILITY, SECURITY & GROWTH through QUALITY, DIVERSIFICATION & SCALE145 Wellington St. W. – Toronto, ON
LOCATION
145 Wellington St. W. is located at the
junction of Toronto’s Financial and
Entertainment Districts
THE PROJECT
In August 2019, H&R submitted a re-
zoning and site plan approval application
for the redevelopment of 145 Wellington
St. W., which is currently a 13-storey office
building
The project will redevelop the subject site
with a full office replacement in a new
modern 13-storey podium, topped with a
47-storey residential tower, for an overall
building height of 60 storeys
A total of 156,000 square feet of office
space and 1,709 square feet of grade-
related retail and 432 new residential
rental units is proposed
Re-zoning and site plan approval is
expected in Q4 2021
32 STABILITY, SECURITY & GROWTH through QUALITY, DIVERSIFICATION & SCALE53 & 55 Yonge St. – Toronto, ON
LOCATION
53 & 55 Yonge St., are located in the
heart of Toronto’s Financial District
THE PROJECT
In November 2020, the REIT acquired
53 Yonge St., a five-storey 11,110
square foot office property, for $11.5
million
The two properties encompass
approximately 0.37 acres and the REIT
submitted a re-zoning application in
March 2021 to replace the existing 13-
storey and five-storey office buildings
with a 66-storey residential and office
tower with retail uses on the first two
floors
This breaks down further into
approximately 12,000 square feet of
retail space, 146,000 square feet of
office space and 320,000 square feet
of residential space (approximately
500 residential rental units)
The REIT expects to obtain approval
for its re-zoning and site plan
applications in Q4 2022
33 STABILITY, SECURITY & GROWTH through QUALITY, DIVERSIFICATION & SCALE310 Front St. – Toronto, ON
LOCATION
310 Front St. is located at the junction
between Toronto’s Financial and
Entertainment Districts
THE PROJECT
In April 2021, H&R submitted a
combined a re-zoning application and
official plan amendment application
for a 69-storey mixed use
development including retail,
residential and office uses
The development will replace the
existing eight-storey office building at
310 Front St., and will integrate into
H&R’s larger office block which
incudes 320 and 330 Front St.
The project will include approximately
118,000 square feet of office, 2,000
square feet of retail and 428,000
square feet of residential space
The REIT expects to obtain approval
for re-zoning and site plan
applications in Q4 2022
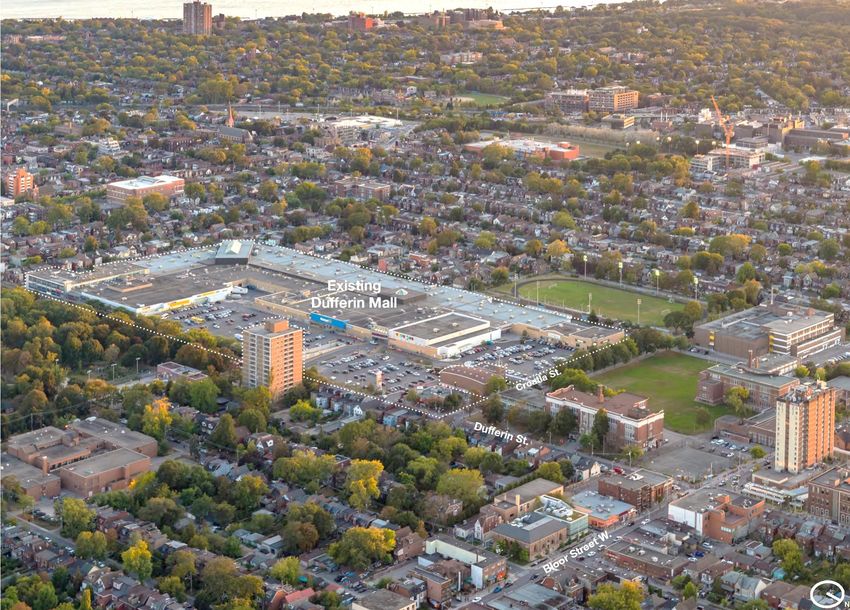
34 STABILITY, SECURITY & GROWTH through QUALITY, DIVERSIFICATION & SCALEDufferin Grove Village – Toronto, ON
LOCATION
New community is in direct proximity to
Dufferin Station on the TTC’s Bloor Line,
and it introduces a mix of residential and
commercial uses including, a new public park
THE PROJECT
In July 2019, H&R submitted combined
applications for re-zoning and for the
redevelopment of the surface parking lots,
drive-through restaurants and strip plaza that
currently occupy the north end of Dufferin Mall
to create “Dufferin Grove Village”
The project will replace the surface parking with
three residential buildings over two blocks
The west block will support two residential
buildings of 20 and 36 storeys, and the east
block will support a 16 storey tower with a 10
storey podium
Combined, they will introduce approximately
1,300 residential rental units (including 120
affordable units) to the site as well as 130,000
square feet of retail space
The REIT expects to obtain approval for its re-
zoning application in Q4 2021
35 STABILITY, SECURITY & GROWTH through QUALITY, DIVERSIFICATION & SCALESustainability at H&R REIT
Environmental Social Governance
The Environmental section The Social Factors section With a diverse and
provides an overview and focuses on our personal experienced Board of
highlights of the environ- interactions with our Trustees, high disclosure
mental impact of our employees, tenants and standards, and strong
business activities as asset customers in the governance practices, we are
and property managers. For communities in which we committed to maintaining
greater detail please refer to operate. the highest ethical standards
the Supplement found on our as one of Canada’s leading
website. real estate companies.
Sustainability at H&R REIT, encompasses the Environmental, Social and Governance (ESG) features
that can materially affect the long-term value of our company. We at H&R REIT believe that
tracking both building performance and corporate metrics provides a better indication of overall
achievement and contributes to our exceptional culture.
36 STABILITY, SECURITY & GROWTH through QUALITY, DIVERSIFICATION & SCALEOur Approach to Sustainability
Integrate sustainability priorities into decision making across all stages of an asset’s lifecycle.
Strategic Planning Asset Management
In line with our strategic planning By applying Sustainability and
processes, H&R REIT’s Executive Environmental guidelines for
team identifies and assesses Operations, our Property
material environmental, social Operations and Asset Management
and governance risks. Annually, departments integrate
the Executive team reviews the sustainability opportunities into
key environmental, social and their daily management and
governance factors for the tracking processes.
upcoming years.
Acquisitions Development
H&R REIT has well established Sustainability goals are established
governance structures such as for our assets that are selected for
the Board Investment Committee renovation or redevelopment.
to oversee and approve
acquisitions inline with the
REIT’s strategic plan. H&R
conducts environmental due
diligence prior to acquiring a
property, and if recommended,
undertakes further remedial
action and monitoring.
37 STABILITY, SECURITY & GROWTH through QUALITY, DIVERSIFICATION & SCALEClimate and Resource Efficiency
Properties tracked by Energy Profiles H&R REIT’s like-for-like Greenhouse 4.1 %
Gas (GHG) market-based emissions
Limited on H&R Utility Tracker (making decreased by over 10% in 2020 Reduction in normalized
emissions intensity in 2019
up approximately 22% of H&R’s compared to 2019; equivalent to
vs. 2018 for H&R Utility
taking 2,093 passenger vehicles off Tracker properties.
portfolio) achieved a 4.1% reduction in the road2.
normalized emissions intensity 1 Complete or partial, as per Sustainability Accounting Standards Board (SASB) definitions
(2019 vs. 2018). 2 Greenhouse Gas Emissions from a Typical Passenger Vehicle (United States Environmental Protection Agency, 2018)
2,920 homes
In 2020, H&R expanded our reporting H&R REIT’s like-for-like electricity
boundary to report utility consumption use decreased by 9% in 2020
and emissions wherever H&R compared to 2019; this reduction
is equivalent to the electricity use 9%
has control over utility use and/or is of 2,920 single-family homes in
able to access utility data. The result Ontario1.
was an increase in data coverage1 1 OEB Report: Defining Ontario’s Typical Electricity Customer (Ontario Energy Board, 2018)
from 22% of 2018 usage (CDP 2019
Reporting) to 62% of 2019 usage (CDP
2020 Reporting). This year, (upcoming 1,398 people
CDP 2021 Reporting) data coverage has H&R REIT’s like-for-like water use
been further increased to 65%. decreased by 9.6% in 2020
compared to 2019; equivalent to
the annual household water use 9.6%
of 1,398 people2.
2 How much water do I use at home each day? (U.S. Geological Survey)
38 STABILITY, SECURITY & GROWTH through QUALITY, DIVERSIFICATION & SCALEDiversity and Inclusion
H&R REIT is guided by our Diversity Policy. We recognize that
to be successful in a multi-cultural world, we must embrace
and adopt diversity outside of gender, including disability,
age, ethnicity, business experience and sexual orientation.
Such diversity is important to ensure that H&R REIT can
draw on a broad range of approaches, backgrounds, skills
and experience to achieve effective stewardship and
management.
As at H&R’s 2021 Annual General Meeting, 30% of the
Board of Trustees self-identify as female.
We are proud to share that WOMEN represent the
following percentages of our team:
2020 2019
Senior Executives 45% 33%
All Executives 42% 40%
Overall Workforce 47% 47%
Board of Trustees 25% 12.5%
39 STABILITY, SECURITY & GROWTH through QUALITY, DIVERSIFICATION & SCALEGovernance Practices
H&R REIT has established policies governing the tenure and constitution of our Board of Trustees which will enhance
the diversity and reduce risk for our organization. Management and the Board will review H&R REIT’s corporate
governance practices regularly to ensure that they align with best practice and provide strong transparency to our
unitholders.
• Tenure for all new trustees is limited to 10 years
• Since 2016, the REIT has undertaken a comprehensive board renewal
process, expanding from 5 members to 10 members, with 8 of the 10
candidates at the 2021 AGM added over the past five years, including 4 who
are new additions in 2021
• Board renewal process executed in a thoughtful and prudent manner,
satisfying the need for change and new perspectives, while also allowing for
continuity and retention of institutional memory
• Women currently represent 30% of our Board, marking progress on the
Board’s diversity commitment and achieving the Canada Club’s aim for better
gender balance at the Board level
• Independent Board Chairperson
• Say on Pay vote (95% support for 2021) strongly supports executive
compensation
• Expanded the minimum unit ownership to Trustees and all Executive Officers
• Clawback policy applicable to all incentive compensation
40 STABILITY, SECURITY & GROWTH through QUALITY, DIVERSIFICATION & SCALESummary
▪ One of the largest REITs in Canada with total assets of $13.1 Billion
▪ High quality real estate
▪ Predictable income
▪ Creditworthy tenants
▪ Long-term leases, with contractual rent escalations
▪ High, stable occupancy
▪ Minimal near term lease expiries and debt maturities
▪ Development pipeline expected to create significant value
and enhance cash flows
▪ Solid balance sheet with a conservative payout ratio
▪ Fully internalized and aligned management
▪ CEO, founders and trustees own approximately
6% of the REIT (including exchangeable units)
▪ NAV per unit is $22.29(1)
(1) Refer to the June 30, 2021 MD&A for a detailed calculation.
41 STABILITY, SECURITY & GROWTH through QUALITY, DIVERSIFICATION & SCALEYou can also read