Covid-19 scenarios July 2020 - Prepared by Experian for West Yorkshire Combined Authority - West Yorkshire ...
←
→
Page content transcription
If your browser does not render page correctly, please read the page content below

Covid-19 scenarios
July 2020
Prepared by Experian for

West Yorkshire Combined Authority

Contents
        1.        Introduction
        2.        Executive Summary
        3.        Modelling Approach
        4.        Scenarios Compared
        5.        Review of local indicators
        6.        Scenario 1: V-shape recovery
                       a.   Macro assumptions
                       b.   UK impact
                       c.   Sector results
                       d.   Local results
        7.        Scenario 2: Delayed V-shape recovery
                       a.   Macro assumptions
                       b.   UK impact
                       c.   Sector results
                       d.   Local results
        8.        Scenario 3: W-shape recovery
                       a.   Macro assumptions
                       b.   UK impact
                       c.   Sector results
                       d.   Local results
        9.        Sensitivity Analysis
        Annex 1 - Pre-Covid baseline forecasts
 2   © Experian
Introduction: the project
 Given the current economic uncertainty around Covid-19, key questions are at the forefront of our minds:

 •       How can we assess the impact of various COVID-19 scenarios on the key sectors that drive an area’s economic growth?
 •       What is the exposure to unemployment risks and what could this mean for our residents/households’ incomes?
 •       How could we support the evidence based strategies and local plans?
 •       Can we model different COVID19 scenarios?

 The varying nature of businesses and demographics across the UK means it is inevitable that some regions, businesses and
 households will be impacted in different ways.

 The project is jointly commissioned by Sheffield City Region and West Yorkshire Combined Authority to develop a consistent
 approach and to use scenarios to support recovery planning and policy work.

 Experian have been commissioned to build a model that tests different economic scenarios and quantify the impact at the local
 level within West Yorkshire: Bradford, Calderdale, Kirklees, Leeds and Wakefield; and Barnsley, Doncaster, Rotherham and
 Sheffield within Sheffield City Region.

 The scope of this project is to lay out the assumptions behind 3 scenarios: V-Shaped recovery, Delayed V-shaped recovery and
 W-shaped recovery. The UK scenarios have been agreed by the client and this has then been run through our econometric
 models to generate the local outcomes for GVA, workforce jobs, unemployment rates and household disposable incomes.
 .

     3   © Experian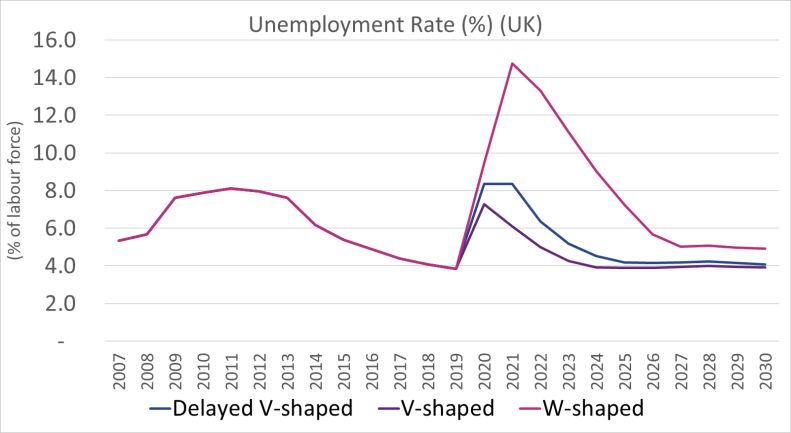
Introduction: Covid-19 impacts
COVID-19 is having wide ranging effects on the UK economy:
          Market uncertainty                 Rise in unemployment             Higher expected credit loss
       Markets fluctuate daily on             Unemployment to rise              Banks are responding with
          Covid-19 updates                       dramatically                 increased loan-loss provisions

                          Recessionary outlook                Consumer spend changes                Scenarios
                        GDP to shrink by over 20% in       Consumer spending has declined           Scenarios are being deployed to
                       2020Q2, unemployment to rise          and made dramatic shifts to            plan for the future as we emerge
                                above 9%                          digital channels                  from this crisis
  4   © Experian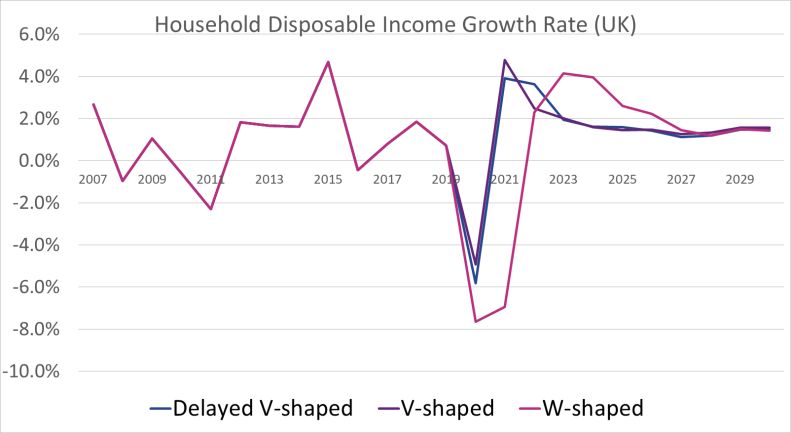
Executive Summary
     Highlights

  V Shape: . A sharp reduction in output in 2020Q2 is followed by an rapid V-shaped rebound that begins in 2020Q3 and, in line with the
  OBR’s reference scenario assumption, returns activity to pre-Covid levels by the end of 2020.
  Sector summary: Retail, Accommodation, Transport, Recreation and Transport Equipment are particularly exposed. Least exposed include
  Health and Pharmaceuticals, Telecoms, Computing and Information Services and Agriculture & Food Production.
  Local summary: Kirklees to be one of the hard hit area in term of GVA growth while Leeds is slightly less impacted.

  Delayed V Shape: Suppression policies and the associated enforced lockdown triggers a sharp drop in output in 2020Q2 as non-
  essential businesses and activities temporarily close. As restrictions are eased gradually, the economic recovery is modest in 2020Q3 but
  picks up momentum by 2020Q4
  Sector summary: Retail, Accommodation, Transport and Recreation endure the greatest losses in the short term. Construction and
  Manufacturing suffer from a scaling back in investment projects. Least exposed include Health and Pharmaceuticals, Telecoms, Computing
  and Information Services and Agriculture & Food Production.
  Local summary: Bradford, Leeds and Wakefield are expected to fare slightly better than the region as a whole while Kirklees performs worst.

     W Shape: A second lockdown leads to a sharp drop in GDP in 2020Q4. The reduction reflects the impact of the renewed closure of
     businesses, confidence impacts as business and households rein back spending, increased business insolvencies and further dis ruptions to
     supply chains.
     Sector summary: Retail, Accommodation, Transport and Recreation suffer the most, along with Construction and Manufacturing. Health and
     Pharmaceuticals will be protected by demand for health products and services
     Local summary: Bradford ’s economy is more resilient in the short term, Wakefield is expected to be more vulnerable to the longer term

 5     © Experian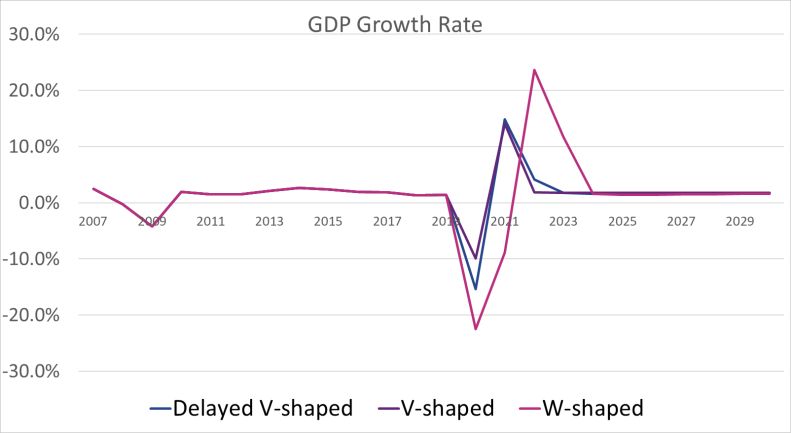
Modelling approach to quantify local economic impacts of Covid-19

                     Sector level                                      Local
                      analysis                                        impacts
                                               UK Macro
•   Identify sectors which are vulnerable to
    Covid-19 pandemic and the suppression      Scenario   •   Analyse the economic resilience of local
                                                              area facing Covid-19 pandemic across key
    measures
                                                              components including local economic and
•   Sectoral analysis related to the                          labour market structure
    Government’s policy response
                                                          •   Factor in longer term trends and historic
•   Sector performance when the UK emerges                    relationships
    from lockdown and begins to reopen its
    economy
•   Short to medium term impacts of Covid-19
    pandemic

    6   © Experian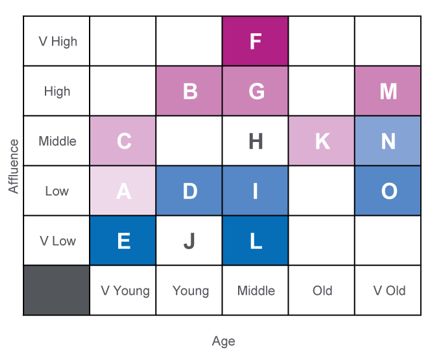
Scenario Results Comparisons - UK
                              GDP          Unemployment      Real disposable   Employment
                             growth            rate        household incomes     growth
  1
                            2020: -9.9%      2020: 7.3%       2020: -4.9%      2020: -2.6%
              V-Shape
                            2021: +14.1%     2021: 6.1%       2021: +4.8%      2021: +1.4%

 2
                            2020: -15.4%     2020: 8.3%       2020: -5.8%      2020: -3.7%
          Delayed V-Shape
                            2021: +14.9%     2021: 8.3%       2021: +3.9%      2021: +0.2%

 3
                            2020: -22.5%     2020: 9.5%       2020: -7.7%      2020: -5.0%
            W-Shape
                            2021: -8.9%      2021: 14.7%      2021: -6.9%      2021: -6.0%

Source: Experian

      7    © Experian
Key local information
Sector composition: As the economic impacts of Covid-19 are filtered down to the local area level, there are a number of factors to consider when
thinking about the scale and duration. A key contributing factor is the sectoral makeup of each area. The below table outlines the proportion of GVA
concentrated in each sector. The colour scale shows which locals have more or less of a presence of a particular industry. If the cell is green, this
shows it the industry has a large presence in the local area and red shows it has less of a presence. This is crucial as if an area has a large presence
of a particularly vulnerable sector, this could result in a more harsh impact.
Bra dford Ca l derda l e Ki rkl ees Leeds Wa kefi el d WY YH UK
Agri cul ture, Fores try & Fi s hi ng 0.0 0.1 0.3 0.0 0.1 0.1 0.8 0.6
Extra ction & Mi ni ng 0.0 0.1 0.1 0.0 0.1 0.1 0.1 0.7
Ma nufa cturi ng 14.9 21.8 25.2 6.4 15.4 12.9 14.2 10.0
Util i ties 5.5 0.6 1.1 5.0 3.7 4.0 3.3 2.6
Cons truction 4.0 4.7 6.5 5.5 8.4 5.7 6.1 6.3
Whol es a l e 5.0 4.9 4.9 5.1 6.9 5.3 5.6 5.4
Retai l 7.5 4.9 8.2 4.8 6.1 5.9 6.0 5.4
La nd Tra ns port, Stora ge & Pos t 3.7 2.7 4.5 3.6 7.7 4.2 4.4 3.6
Ai r & Wa ter Tra ns port 0.3 0.4 0.5 0.4 0.4 0.4 0.3 0.6
Accomoda tion & Food Servi ces 2.0 2.2 2.2 2.1 2.3 2.1 2.7 2.9
Recrea tion 1.0 0.9 1.7 1.9 0.9 1.5 1.3 1.6
Medi a Activi ties 1.2 0.5 0.5 1.0 0.2 0.8 0.6 1.9
Tel ecoms 1.2 0.3 0.3 3.9 1.2 2.3 1.7 1.7
Computing & Informa tion Servi ces 1.2 1.9 1.8 3.9 1.2 2.6 2.0 3.6
Fi na nce 3.2 14.0 0.4 8.6 0.6 6.0 4.1 5.1
Ins ura nce & Pens i ons 0.0 4.8 0.0 1.2 0.0 1.0 0.7 1.5
Rea l Es tate 13.1 10.0 12.8 9.8 12.7 11.2 12.0 13.4
Profes s i ona l Servi ces 7.0 2.7 3.4 8.9 3.2 6.5 5.5 8.0
Admi n. & Supportive Servi ces 2.5 3.1 3.8 7.4 5.0 5.4 5.1 5.3
Other Pri va te Servi ces 0.9 2.8 1.0 2.2 1.0 1.7 1.7 1.9
Publ i c Admi ni s tra tion & Defence 6.3 4.4 4.7 3.8 8.0 5.0 5.2 4.8
Educa tion 8.9 6.4 8.4 6.3 6.1 7.0 7.6 5.7
Hea l th 7.2 4.0 5.4 4.8 7.0 5.5 5.8 5.1
Res i dentia l Ca re & Soci a l Work 3.3 1.6 2.3 3.2 1.8 2.8 3.1 2.3
8 © Experian
Source: Experian, ONSKey local information
Occupation mix: The working patterns across the UK have changed dramatically and for some occupations, working from home is a viable
arrangement, while for other occupations this is impossible. When looking at the occupation mix across the UK you can build up a picture of if there are
opportunities or vulnerabilities in terms of remote working.
The table below outlines the proportion of employment focused in each occupation. The colour scale shows the concentration of occupations within a
local area. If the cell is green it shows a high concentration of an occupation and red has a low representation. The first three occupations are deemed
to have a greater ability to remotely work. Across the locals in question, Leeds and Sheffield have the highest proportion in these occupation and are
more concentrated than the UK average.
Bradford Calderdale Kirklees Leeds Wakefield WY YH UK
Managers , directors and s enior officials 8.7 12 10 8.9 6.7 9 10.1 11.3
Profes s ional occupations 16.9 19.8 19.8 23.2 15.9 19.9 19.3 21.3
As s ociate prof & tech occupations 12.4 14.7 14.3 16.2 13.1 14.5 13.7 14.5
Adminis trative and s ecretarial occupations 6.3 11.3 10.2 8.2 9.4 8.7 9 9.6
Skilled trades occupations 11.1 8.8 10.9 9.1 11.7 10.2 10.3 10.1
Caring, leis ure and other s ervice occupations 11.1 11.9 7.9 9.1 9.6 9.6 9.8 9.1
Sales and cus tomer s ervice occupations 11.9 6.6 9 7.6 9.8 9 8.5 7.3
Proces s , plant and machine operatives 10.3 6.4 7.4 5.4 9.4 7.5 7.5 6.2
Elementary occupations 10.5 7.9 9.9 11.5 13.9 11 11.5 10.2
Source: ONS, NOMIS
9 © ExperianKey local information
Household groups: The mix of household groups is also an interesting viewpoint to review. This analysis draws on Experian’s FSS (Financial
Strategy Segment) segmentation tool, which utilises demographic information to split the UK population into a set of broad and detailed groups. It uses
socio–demographic characteristics such as age, affluence, property tenure type and credit history to classify households into groups. The dataset
below outlines how the groups are distributed across the local areas. If the cell is green it shows that this group is well represented in the local area,
red shows a low concentration. This is crucial as if an area has a large presence of a particularly vulnerable household group, this could result in a
more harsh impact. When we have analysed the Covid-19 impacts across the different household groups, the most at risk groups are L:Cash
Economy, E: Family Pressures, A: Earning Potential and D: Deal Seekers.
Bra dford Ca l derda l e Ki rkl ees Leeds Wa kefi el d WY UK
A : Ea rni ng Potentia l 8.2 8.8 8.5 15.2 10.4 10.9 7.9
B : Money Ma kers 3.7 4.5 4.3 9.7 3.2 5.7 8.6
C : Growth Pha s e 4.4 5.3 6.0 5.4 5.3 5.3 6.3
D : Dea l Seekers 4.1 2.8 3.6 3.8 5.6 4.0 4.1
E : Fa mi l y Pres s ures 15.4 5.8 9.2 8.2 6.7 9.6 5.2
F : Es tabl i s hed Inves tors 5.7 7.5 6.5 6.5 3.0 5.9 10.5
G : Ca reer Experi ence 4.5 7.5 6.3 5.6 3.3 5.4 5.5
H : Sma l l -s ca l e Sa vers 5.4 8.2 5.9 3.6 5.9 5.4 3.2
I : Mutua l Res ources 11.5 4.4 6.0 2.5 2.5 5.5 7.4
J : Si ngl e Ea rners 12.5 18.8 14.1 10.4 13.3 13.0 9.8
K : Res pectabl e Res erves 6.5 7.9 9.7 8.2 12.0 8.6 8.2
L : Ca s h Economy 5.9 4.4 6.6 8.3 14.9 7.9 7.0
M : Gol den Age 3.4 3.9 3.3 3.6 2.4 3.4 7.6 The above FSS matrix sets out the groups we
N : Home-equi ty El ders 3.8 4.5 5.1 4.7 6.2 4.8 4.0 classify and the shading shows household income,
O : Decl i ni ng Yea rs 4.8 5.6 4.8 4.2 5.3 4.8 4.6 with purple being the highest and blue the lowest.
Source: Experian
10 © ExperianKey local information - summary
Weakness
Sector composition (%) Occupation profile (%) FSS profile (%)
Most impacted Least impacted Higher occupation groups Lower occupation groups Vulnerable household groups
Bradford 14.8 13.6 25.6 32.7 29.6
Calderdale 11.6 9.0 31.8 20.9 19.0
Kirklees 18.0 10.2 29.8 26.3 24.3
Leeds 12.9 14.2 32.1 24.5 31.7
Wakefield 17.5 16.5 22.6 33.1 31.9
WY 14.4 13.4 28.9 27.5 28.4
YH 15.2 14.0 29.4 27.5 25.7
UK 15.4 13.5 32.6 23.7 20.2
11 © ExperianScenario 1: V-shape recovery – key assumptions
The following sets out a scenario narrative for a ‘V-shaped recovery’:
Government measures effectively
safeguard the majority of jobs, companies
A steady unwinding of Government moves the able to rapidly restore output via return to
restrictions results in a swift Coronavirus alert to level two normal working hours. Unemployment
rebound in activity in Q3 and by the end of 2020. peaks in 2020Q2 and begins to reverse in
any resurgence of cases 2020H2.
remains well controlled.
The enforced lockdown triggers a
Intensive global efforts No lasting economic hit.
sharp drop in output in early 2020Q2.
Virus is successfully secure a vaccine and Unemployment returns to
Activity rebounds swiftly in 2020Q3
contained in Q2 and the sufficient stockpiles are built pre-Covid levels. No
and returns to pre-COVID levels by
government moves the to begin rollout to the ‘at- scarring to GDP.
end 2020.
Coronavirus alert to level 3. risk’ population group in late
2020/early 2021.
Government’s support packages and a V-shaped economic recovery result in minimal scarring effects to the UK’s longer term economic potential. The assumption is that
the current mix of fiscal and monetary packages will continue for as long as needed and the unwind will be tapered to avoid p otential cliff-edges which could disrupt the
recovery. No additional measures above what has been already announced have been explicitly factored in.
12 © ExperianScenario 1 V-shape recovery – UK results
GDP: As suppression policies are unwound, well contained virus cases and a swift bounce back in
confidence help to support a fast paced recovery. A sharp reduction in output in 2020Q2 is followed
by an rapid V-shaped rebound that begins in 2020Q3 and, in line with the OBR’s reference scenario
assumption, returns activity to pre-Covid levels by the end of 2020. The economy contracts by 9.9%
in 2021, followed by a rebound of 14% in 2021. There is no long term scarring to output.
Consumer demand rebounds swiftly in 2020Q3 as retail, leisure and hospitality businesses reopen.
Alongside this confidence is buoyed as incomes begin to gain from furloughed workers returning to
work and a resumption in employment growth in the second half of the year. The drop in real
household incomes is limited to 4% in 2020, followed by a strong rebound in 2021. Consumer
spending recovers to pre-Covid levels by the end of 2020.
Investment drops abruptly during the lockdown in 2020Q2. However, the relatively short period
within which the crisis is contained, together with government support, helps to limit the damage to
company balance sheets and confidence. This leaves businesses better positioned to restore
investment plans over the second half of the year as economic conditions improve. Private sector
investment returns to pre-Covid levels in 2021H1.
Labour Market: The unemployment rate jumps to 9.7% in 2020Q2 as business react to the
challenges of lockdown. This proves to be the peak as economic conditions improve in 2020Q3 but
unemployment lags the rebound in GDP. Around a quarter of the rise in unemployment unwinds in
2020Q3 and 2020Q4. Beyond this the reduction is more gradual. The unemployment rate falls to 7%
by end-2020 and below 6% by mid-2021. The swift turnaround in economic conditions means all
furloughed staff return to employment and there is no rise in structural unemployment.
International Trade: The UK’s trade partners are assumed to also reopen successfully over
2020H2, triggering a rise in global demand and an easing in supply chain issues. This enables
exports to bounceback rapidly from the severe contraction in 2020Q2. Alongside this, imports
enjoy a sharp improvement in line with the pick up in domestic demand.
Productivity suffers during the lockdown as output falls more than employment and hours
worked. Changes in working patterns and supply chain disruptions also exert a drag. These
impacts quickly reverse as the recovery sets in. The successful resolution to the crisis in a
relatively short period prevents any lasting impact to productivity. Source: Experian
13 © ExperianScenario 1 V-shape recovery – sector results
GVA growth
2019 2020 2021 2022 2023
Highlights Agriculture, Forestry & Fishing -1.1% 6.9% -5.6% -0.5% 0.2%
Extraction & Mining -0.2% -21.3% 25.3% 1.5% -1.1%
Food, Drink & Tobacco 1.3% 4.7% -3.4% -0.8% -0.1%
Most impacted : Textiles & Clothing -1.8% -20.2% 25.7% 0.2% -0.6% The colour code in
Retail, Accommodation, Transport, Recreation and Transport Equipment are
Wood & Paper -1.8% -11.8% 13.9% -1.7% -1.4% the accompanying
Printing and RR Media -0.6% -15.5% 15.5% -1.7% -1.4% table outlines how
particularly exposed to the drop in social consumption and closure of non- Fuel Refining -0.1% -9.1% 2.8% -1.6% -1.3%
essential businesses during full lockdown. In addition, transport equipment sectors will fare in
Chemicals -2.5% 5.8% -5.3% -0.3% 0.0%
manufacturers are very vulnerable to supply chain disruptions and the drop in Pharmaceuticals 5.6% 9.3% 1.9% 1.3% 1.6% each year. The dark
demand for motor vehicles. Non-Metallic Products -3.6% -13.4% 16.9% 0.5% 0.6% red illustrates the
Metal Products -0.3% -12.1% 15.6% -0.1% 0.2% weakest sectors in
This group initially takes longer to recover – returning to pre-Covid levels in Computer & Electronic Products 0.7% -12.6% 14.1% 0.1% 0.5% that particular year
2021H2 compared with 2020Q4 for the overall economy – but catch up over Machinery & Equipment -6.7% -22.5% 28.7% 2.7% 1.4%
the medium term as more typical trends reassert. Transport equipment reverts Transport Equipment -6.4% -32.0% 45.6% 7.4% 1.8%
and the lighter shade
back to its position as one of the strongest performing manufacturing sectors. Other Manufacturing -2.9% -18.8% 22.3% 1.2% 0.3% reveals the stronger
Output scarring over the long term is minimal. Utilities -0.7% -5.7% 7.6% 0.4% 0.8% sectors. For
Construction of Buildings 2.4% -13.9% 19.3% 1.3% 1.7% example, in 2020 the
Civil Engineering 2.4% -13.9% 19.3% 1.2% 1.6% accommodation and
Least impacted: Specialised Construction Activities 2.4% -13.9% 19.5% 1.4% 1.7%
Wholesale 2.9% -16.7% 23.1% 1.9% 1.6%
food service sector is
Health and Pharmaceuticals output is boosted by greater demand for health Retail 3.0% -27.9% 35.8% 6.4% 1.7% expected to be the
products and services during the escalation in Covid cases. There is a Land Transport, Storage & Post 3.0% -12.0% 17.2% 1.8% 2.1% weakest sector and
correction lower once the health crisis turns a corner. The pace of expansion in Air & Water Transport -1.2% -30.9% 39.6% 6.9% 2.0% therefore has the
the long term is little changed. Accommodation & Food Services 2.1% -34.7% 41.8% 10.9% 1.5%
darkest shade of red.
Recreation 0.7% -33.3% 40.0% 11.6% 2.0%
Telecoms, Computing and Information Services gain from greater spending on Media Activities 6.1% -2.5% 11.5% 0.8% 1.8% At the other end of
technology related to the shift to home working and online activities during Telecoms -2.0% -2.9% 8.9% 1.1% 2.6% the scale, we expect
lockdown. Maintain position as one of the stronger performers over the long Computing & Information Services 9.3% -2.4% 10.0% 1.1% 2.3% growth to be
term. Finance -3.0% -4.4% 11.8% 1.5% 3.2% strongest in 2020 is
Insurance & Pensions -3.2% -8.1% 10.1% -0.2% 0.3%
Agriculture and Food Production benefits in the short term as spending on Real Estate 0.6% -8.8% 13.4% 0.7% 1.5%
the pharmaceuticals
essential products such as food is less sensitive to the squeeze on household Professional Services 2.4% -4.2% 8.4% 0.8% 2.1% sector.
incomes. Output then corrects back to more modest trends typical for this Admine & Supportive Services 3.0% -6.4% 11.2% 1.2% 2.8%
group. Other Private Services -1.6% -11.5% 18.1% 0.4% 1.0%
Public Administration & Defence 2.1% 2.0% -0.5% -0.2% 0.2%
Education 2.7% -19.8% 21.2% 2.9% 2.5%
14 © Experian Health 1.7% 8.5% 7.1% 2.0% 3.3%
Residential Care & Social Work 1.9% 5.8% -2.3% 2.5% 1.9%Scenario 1 V-shape recovery – Local results
GVA Workforce jobs
Within West Yorkshire, we expect Kirklees to Job growth across West Yorkshire had
be one of the hard hit area in term of GVA been weak prior to the Covid19 pandemic
growth while Leeds is slightly less impacted. and sees a further decline in employment
All areas are likely to experience a dramatic this year. Calderdale and Kirklees are
knock to growth with most areas close to a expected to be worst hit in terms of jobs
double digits decline in output from -9.2% in growth, at -2.8% this year. Leeds is likely
Leeds to -12% in Kirklees. The UK economy to weather the storm better than most in
will return to normality in 2021, led by part supported by larger public sector and
stronger rebound from the most affected a favourable occupation profile. The
sectors during the lockdown, which is health sector at the UK level is expected
expected to boost GVA growth in Kirklees and to marginally increase employment this
Calderdale slightly above the UK averages. year, and such trends will help aid areas
with notably larger presence of health
and the wider public sector.
Unemployment Incomes
Unemployment rates at the UK level are The performance of household incomes will
expected to rise from 3.8% in 2019 to 7.3% in be a key factor of how durable the recovery
2020. The combination of government’s fiscal will be when it finally emerges. Incomes will
and monetary support is preventing masses suffer a squeeze in the months ahead from
of unemployment and business bankruptcies, a combination of a sharp rise in
which provides the basis for full economic unemployment, furloughed workers and
recovery. Unemployment rates are expected weakening wages. This scenario assumes
to be highest in Bradford this year, averaged incomes return to recovery later this year.
8.7% followed by Kirklees at 7.8% and these The drop in incomes is likely to be felt quite
two areas also expected to have the biggest uniformly across the locals. Bradford and
fall in unemployment in 2021 aided by sharp Leeds may fare a little better, in part
rebound in the sectors most impacted by the explained by a lower implied rate of
Covid pandemic. furlough and the large public sector
presence.
Source: Experian
15 © ExperianScenario 1 V-shape recovery – Local results
Annual GVA growth (%) Annual workforce jobs growth (%)
2019 2020 2021 2022 2023 2024 2025 2019 2020 2021 2022 2023 2024 2025
Bradford 0.6 -9.6 13.4 1.6 1.5 1.5 1.5 Bradford 0.0 -2.3 1.5 1.3 1.0 0.8 0.7
Calderdale 0.8 -10.3 14.5 1.5 1.5 1.5 1.4 Calderdale -0.6 -2.8 1.5 1.7 1.2 0.9 0.8
Kirklees 0.9 -12.0 16.4 2.1 1.5 1.5 1.5 Kirklees -0.6 -2.8 1.7 1.5 1.1 0.8 0.7
Leeds 1.5 -9.2 13.3 1.7 1.8 1.8 1.8 Leeds 0.7 -2.4 1.5 1.9 1.4 1.1 1.0
Wakefield 0.8 -9.4 12.9 1.4 1.3 1.4 1.4 Wakefield -0.2 -2.7 1.4 1.2 0.9 0.7 0.6
YH 0.9 -9.8 13.6 1.7 1.5 1.5 1.5 YH -0.2 -2.5 1.5 1.5 1.1 0.8 0.7
UK 1.4 -9.9 14.1 1.9 1.8 1.7 1.7 UK 1.7 -2.6 1.4 1.6 1.2 0.9 0.8
ILO unemployment rate (%) Real incomes growth (%)
2019 2020 2021 2022 2023 2024 2025 2019 2020 2021 2022 2023 2024 2025
Bradford 5.6 8.7 7.3 6.4 6.0 5.8 5.6 Bradford 0.6 -5.1 3.9 1.9 1.8 1.6 1.6
Calderdale 4.0 7.5 6.2 5.0 4.3 3.9 3.6 Calderdale 0.2 -5.8 3.9 2.0 1.7 1.4 1.3
Kirklees 4.3 7.8 6.5 5.3 4.7 4.3 4.1 Kirklees 0.4 -5.5 4.1 2.2 1.9 1.5 1.5
Leeds 4.1 7.6 6.5 5.2 4.4 4.1 3.9 Leeds 0.4 -5.5 4.7 2.4 2.1 1.7 1.6
Wakefield 4.6 7.7 6.4 5.4 4.8 4.4 4.2 Wakefield 0.2 -5.2 3.8 1.6 1.4 1.1 1.1
YH 4.4 7.6 6.3 5.2 4.5 4.1 3.9 YH 0.4 -5.2 4.3 2.2 1.9 1.5 1.4
UK 3.8 7.3 6.1 5.0 4.3 3.9 3.9 UK 0.7 -4.9 4.8 2.5 2.0 1.6 1.5
Source: Experian
16 © ExperianScenario 2: Delayed V-shaped recovery – key assumptions
The following sets out a scenario narrative for a ‘Delayed-V shaped recovery’:
The rebound in activity from the Government support measures not as
unwind of suppression Government moves the effective as in case 1 due to slower recovery,
measures is initially gradual, but Coronavirus alert to level two resulting in a greater squeeze to household
gathers pace from late 2020Q3 during 2021. and business finances. Unemployment peaks
and the resurgence of cases in 2020Q3 and remains elevated into 2021.
remains controlled.
Intensive global efforts The enforced lockdown triggers a The delayed recovery
Virus is successfully secure a vaccine and sharp drop in output in early 2020Q2. intensifies the short term
contained in 2020Q2 and sufficient stockpiles are built Activity recovers slowly in 2020Q3 but pain and results in modest
the government moves the to begin rollout to the ‘at- gathers momentum in 2020Q4. long term scarring to GDP
Coronavirus alert to level 3. risk’ population group in Output returns to pre-COVID levels in and unemployment.
2021H1. 2022.
Government’s support packages and a delayed V-shaped economic recovery help to limit scarring effects to the UK’s longer term economic potential. The assumption is
that the current mix of fiscal and monetary packages will continue for as long as needed and the unwind will be tapered to avoid potential cliff-edges which could disrupt the
recovery. No additional measures above what has been already announced have been explicitly factored in.
17 © ExperianScenario 2 Delayed V recovery– UK results
GDP: Suppression policies and the associated enforced lockdown triggers a sharp drop in output
in 2020Q2 as non-essential businesses and activities temporarily close. As restrictions are eased
gradually, the economic recovery is modest in 2020Q3 but picks up momentum by 2020Q4. The
economy is expected to contract around 15% in 2020 followed by a sharp rebound in 2021.
Output returns to pre-Covid levels by early 2022.
Consumer demand suffers as social distancing, squeezed incomes and low confidence trigger a
big drop in discretionary spending in 2020Q2 and weigh on the emerging recovery in 2020Q3.
Household incomes fall by 5% in 2020 from a combination of higher unemployment, weaker
wage growth and furloughing. Sales of some essential items rise sharply over this period due to
stockpiling, but this is not sufficient to offset the decline in other areas, leading to an overall fall
in spending. The recovery picks up momentum in 2020Q4, but consumer spending does not
return to pre-Covid levels until the second half of 2022.
Investment declines as hits to business confidence and financial positions leads to the
postponement/cancellation of projects. The recovery will lag behind other areas as companies
emerge from the recession focused on repairing weakened balance sheets. A return to pre-Covid
levels is delayed until late 2023.
Labour Market: UK government’s response to the economic threat from the Covid-19 crisis has
been aimed at helping companies of all sizes retain staff and prevent insolvencies. These
measures help rein in the rate of job shedding as staff as furloughed instead. The unemployment
rate rises above 9% in 2020 and remains elevated in 2021, before gradually falling below 6% in
2022.
International Trade: Exports are undermined by a fall in international demand for UK goods and
services, as other countries also enforce lockdown measures against the pandemic. Supply side
factors reinforce this trend, such as the temporary closure of factories and businesses and
disruptions to supply chains. Imports mirror these trends.
.
Productivity falls in the short term due to supply chains disruptions and changes in working
patterns (over 40% of employees working from home). It recovers back to previous levels once
conditions normalize. Longer term impacts related to the drop in investment are relatively mild.
Hence, GDP scarring is modest.
Source: Experian
18 © ExperianScenario 2 Delayed V recovery – sector results
GVA growth
2019 2020 2021 2022 2023
Highlights Agriculture, Forestry & Fishing -1.1% 5.8% -5.3% -0.2% 0.2%
Extraction & Mining -0.2% -27.1% 27.7% 4.3% -1.1%
Food, Drink & Tobacco 1.3% 3.0% -2.1% -0.2% -0.1%
Most impacted : Textiles & Clothing -1.8% -26.2% 28.3% 2.9% -0.6% The colour code in
Wood & Paper -1.8% -18.3% 16.1% 1.0% -1.4% the accompanying
Retail, Accommodation, Transport, Recreation and Transport Equipment Printing and RR Media -0.6% -21.9% 17.9% 1.1% -1.4% table outlines how
suffer the most from the drop in social consumption and closure of non- Fuel Refining -0.1% -13.4% 5.1% -0.1% -1.3%
sectors will fare in
essential businesses during full lockdown. Chemicals -2.5% 4.1% -4.1% 0.2% 0.0%
Pharmaceuticals 5.6% 7.6% 3.2% 1.8% 1.6% each year. The dark
This group of businesses also take longer to return to pre-Covid levels Non-Metallic Products -3.6% -19.8% 19.1% 3.3% 0.6% red illustrates the
during the recovery phase, between 1 -2 years later than the overall Metal Products -0.3% -18.7% 17.9% 2.6% 0.2% weakest sectors in
economy. There is a partial catch up in output levels, with relatively Computer & Electronic Products 0.7% -19.0% 17.6% 2.8% 0.5% that particular year
higher levels of scarring over the long term: between 5-8% by 2030, Machinery & Equipment -6.7% -28.3% 29.5% 5.1% 1.4%
Transport Equipment -6.4% -38.6% 43.7% 10.3% 1.8%
and the lighter shade
compared to 4% for the UK overall. reveals the stronger
Other Manufacturing -2.9% -24.8% 24.2% 3.9% 0.3%
Utilities -0.7% -11.5% 11.4% 2.3% 0.8% sectors. For
Least impacted: Construction of Buildings 2.4% -20.5% 19.9% 4.1% 1.7% example, in 2020 the
Civil Engineering 2.4% -20.5% 19.8% 4.0% 1.6% accommodation and
Health and Pharmaceuticals output is boosted temporarily by greater Specialised Construction Activities 2.4% -20.5% 20.0% 4.1% 1.7%
demand for health products and services. The stand out performer is Wholesale 2.9% -22.9% 25.5% 4.6% 1.6%
food service sector is
Pharmaceuticals, which remains on a growth trajectory throughout the Retail 3.0% -32.9% 34.0% 9.3% 1.7% expected to be the
forecast. The long term growth outlook is unaffected. Land Transport, Storage & Post 3.0% -18.6% 19.5% 4.6% 2.1% weakest sector and
Air & Water Transport -1.2% -35.9% 39.4% 9.4% 2.0% therefore has the
Telecoms, Computing and Information Services gain from higher Accommodation & Food Services 2.1% -39.4% 42.7% 13.8% 1.5%
spending on technology related to the shift to home working and online darkest shade of red.
Recreation 0.7% -38.0% 38.0% 14.0% 2.0%
activities. These sectors return to pre-Covid levels in 2021, slight ahead Media Activities 6.1% -9.4% 12.1% 3.2% 1.8% At the other end of
of the UK average. Telecoms -2.0% -9.3% 10.2% 3.4% 2.6% the scale, we expect
Computing & Information Services 9.3% -8.8% 11.5% 3.3% 2.3% growth to be
Agriculture and Food Production benefit as spending on essential Finance -3.0% -11.4% 12.0% 3.7% 3.2% strongest in 2020 is
products such as food is less sensitive to the squeeze on household Insurance & Pensions -3.2% -15.0% 11.0% 2.1% 0.3%
the pharmaceuticals
incomes during the crisis. Output then corrects back to more modest Real Estate 0.6% -15.6% 14.6% 3.1% 1.5%
Professional Services 2.4% -10.8% 10.8% 3.2% 2.1% sector.
trends typical for this group.
Admine & Supportive Services 3.0% -12.1% 13.2% 3.5% 2.8%
Other Private Services -1.6% -18.0% 21.0% 3.1% 1.0%
Public Administration & Defence 2.1% 1.0% 0.2% 0.3% 0.2%
Education 2.7% -25.6% 23.3% 5.7% 2.5%
19 © Experian Health 1.7% 6.5% 3.0% 4.8% 3.3%
Residential Care & Social Work 1.9% 4.2% -1.0% 3.0% 1.9%Scenario 2 Delayed V recovery – Local results
GVA Workforce jobs
GVA growth across West Yorkshire is likely to Despite the severe contraction in output,
be severely impacted by the Covid pandemic employment has held up well as a result of a
and the enforced lockdown. However, its mixture of government’s fiscal and monetary
diverse economy base means each local policies. Leeds is expected to fare slightly
authority faces varying degrees of adverse better than most because of its exposure to
economic challenges. Bradford, Leeds and business services sector and close to a third of
Wakefield are expected to fare slightly better its workforce is in managerial and professional
than the region as a whole while Kirklees’ occupations with greater flexibility to work
economy has the highest exposure to most remotely. By 2021, the economic recovery is
impacted sectors and therefore the hardest well underway, jobs creation is likely to be
hit area. We expect the GVA in all local subdue at first as workers previously
districts within West Yorkshire to rebound furloughed return to work, therefore we
strongly in 2021 and returns to pre-Covid expect meaningful employment growth to
level by 2022. start in 2022 led by Leeds and Calderdale.
Unemployment Incomes
Within West Yorkshire the unemployment Household income within West Yorkshire is
is expected to be higher than the regional likely to suffer steep fall of around 6% this
and national averages particularly in places year from a combination of higher
like Bradford and Kirklees, and remain high unemployment, weaker wage growth and
through 2021 above the levels seen after furloughing. Within West Yorkshire, the drop
the 2008-09 financial crisis. Calderdale and in incomes is likely to be felt quite uniformly
Leeds are expected to see unemployment across the area, Calderdale and Leeds are
fall more quickly boosted by employment likely to see hardest hit in income this year as
gains in the services sectors, while Bradford followed by a strong bounce back in 2021
and Wakefield lagging behind as a result of while Wakefield may see persistent income
weak jobs growth. growth in the next few years. Overall, most
areas will see household income return to
pre-Covid levels by late 2022.
Source: Experian
20 © ExperianScenario 2 Delayed V recovery – Local results summary
Annual GVA growth (%) Annual workforce jobs growth (%)
2019 2020 2021 2022 2023 2024 2025 2019 2020 2021 2022 2023 2024 2025
Bradford 0.6 -14.8 13.9 3.6 1.4 1.3 1.4 Bradford 0.0 -3.6 0.1 2.1 1.3 1.0 0.8
Calderdale 0.8 -16.0 15.3 3.8 1.5 1.3 1.3 Calderdale -0.6 -3.9 0.3 2.7 1.7 1.2 0.9
Kirklees 0.9 -17.5 17.2 4.4 1.5 1.3 1.4 Kirklees -0.6 -3.9 0.4 2.5 1.6 1.1 0.8
Leeds 1.5 -14.8 14.2 4.0 1.8 1.6 1.7 Leeds 0.7 -3.5 0.3 2.9 2.0 1.4 1.0
Wakefield 0.8 -14.5 13.4 3.4 1.3 1.2 1.3 Wakefield -0.2 -3.9 0.0 2.1 1.4 0.9 0.7
YH 0.9 -15.1 14.4 3.9 1.5 1.3 1.4 YH -0.2 -3.6 0.2 2.5 1.6 1.1 0.8
UK 1.4 -15.4 14.9 4.1 1.8 1.6 1.6 UK 1.7 -3.7 0.2 2.6 1.7 1.2 0.9
ILO unemployment rate (%) Real incomes growth (%)
2019 2020 2021 2022 2023 2024 2025 2019 2020 2021 2022 2023 2024 2025
Bradford 5.6 9.8 9.7 8.2 7.4 6.9 6.7 Bradford 0.6 -6.0 3.0 2.8 1.6 1.6 1.7
Calderdale 4.0 8.6 8.4 6.3 5.1 4.5 4.1 Calderdale 0.2 -6.6 3.2 3.1 1.6 1.5 1.4
Kirklees 4.3 8.8 8.6 6.6 5.5 4.8 4.5 Kirklees 0.4 -6.3 3.4 3.3 1.8 1.6 1.6
Leeds 4.1 8.7 8.7 6.5 5.3 4.6 4.3 Leeds 0.4 -6.4 3.9 3.6 2.0 1.7 1.7
Wakefield 4.6 8.9 8.8 7.1 6.1 5.5 5.3 Wakefield 0.2 -6.1 2.9 2.5 1.1 1.1 1.2
YH 4.4 8.6 8.5 6.5 5.3 4.7 4.4 YH 0.4 -6.1 3.5 3.3 1.8 1.5 1.5
UK 3.8 8.3 8.3 6.4 5.2 4.5 4.2 UK 0.7 -5.8 3.9 3.6 2.0 1.6 1.6
Source: Experian
21 © ExperianScenario 3: W-shape recovery – key assumptions
The following sets out a scenario narrative for a ‘W-shaped recovery’:
Confidence is harder hit and takes longer to
recover. Businesses are left with significantly
The easing of restrictions is The second lockdown sends greater debts and financial challenges than
followed by an escalation in the economy back into the other cases. Job creation and investment
virus cases during the autumn, recession, triggering a are subdued for longer.
leading to a return to lockdown renewed wave of job losses.
conditions in 2020Q4.
This is followed by a 12 Meaningful recovery
This case starts in a similar month period of fluctuating Government support is extended but postponed until 2022.
way to case 2: the virus is easing and tightening of less generous and does not prevent Long period of stagnation
contained in 2020Q2 and restrictions until a vaccine is an upward spike in job shedding and results in greater long
suppression measures finally in place at the end of insolvencies. terms effects on the
begin to unwind. 2021. economy.
Fiscal and monetary support measures are extended in this scenario, but the generosity of these schemes is reduced as government finances are increasingly stretched.
These are insufficient to prevent a spike higher in unemployment and business insolvencies. Also, the reintroduction of auste rity measures over the medium term will be a
further constraint on the economic outlook. The protracted period of economic weakness leads to greater long term effects on the economy’s growth potential.
22 © ExperianScenario 3 W-shape recovery – UK results
GDP: A second lockdown leads to a sharp drop in GDP in 2020Q4. The reduction reflects the
impact of the renewed closure of businesses, confidence impacts as business and households
rein back spending, increased business insolvencies and further disruptions to supply chains.
Social distancing measures and subdued confidence keep the recovery subdued until 2022. The
economy does not return to pre-Covid levels until 2025.
Consumer demand falls again in 2020Q4 and the pattern of spending is similar to before with
social consumption hit hard as non-essential businesses close and social distancing tightened.
The combination of squeezed household incomes, stubbornly high unemployment and tepid
confidence leaves households with limited ability or appetite for spending throughout 2021. A
recovery in spending emerges from 2022 as restrictions ease and unemployment begins to fall.
Investment suffers as companies cash flows come under renewed stress. The confidence
impacts are deeper and more long lasting than in the other scenarios. Surviving businesses are
saddled with greater debts and focused on balance sheet repair. This leaves investment remains
very subdued and the recovery that eventually emerges lags behind the rest of the economy.
Labour Market: The second lockdown triggers a renewed wave of job shedding and business
insolvencies which push the unemployment rate up to 14%. Government measures to safeguard
jobs are extended but companies are expected to make some contribution to the costs of
furloughed employees. Unlike the other cases, not all furloughed staff return to employment.
Unemployment remains elevated through 2021, leading to an rise in structural unemployment.
The unemployment rate settles at around 5% over the long term.
International Trade: We assume the UK’s export partners also suffer a second wave of virus
cases and enact lockdown measures. Hence, trade would face a similar pattern of decline to
2020Q2, with both exports and imports falling markedly due to demand and supply side
disruptions.
Productivity Economic stagnation and persistently weak investment over much of 2021 leads to
greater long term effects on the economy’s productive capacity. Potential GDP growth is 0.2
percentage points lower. The economy is around 10% lower in 2030 than levels forecast before
the Covid crisis.
Source: Experian
23 © ExperianScenario 3 W-shape recovery – sector results
GVA growth
2019 2020 2021 2022 2023
Highlights Agriculture, Forestry & Fishing -1.1% 4.9% -6.3% 0.3% 1.1%
Extraction & Mining -0.2% -34.8% -5.2% 30.5% 11.9%
Food, Drink & Tobacco 1.3% 1.5% -5.0% 2.6% 1.7%
Most impacted : Textiles & Clothing -1.8% -34.3% -4.4% 28.8% 12.4% The colour code in
Wood & Paper -1.8% -26.9% -13.9% 26.5% 11.5% the accompanying
Retail, Accommodation, Transport and Recreation endure the greatest Printing and RR Media -0.6% -30.2% -12.4% 26.5% 11.5%
losses in the short term due to drop in social consumption. These table outlines how
Fuel Refining -0.1% -22.5% -22.2% 25.1% 11.6%
businesses take longer to return to pre-Covid levels during the recovery sectors will fare in
Chemicals -2.5% 1.7% -9.6% 4.7% 2.7%
phase and suffer the greatest long term scarring. Pharmaceuticals 5.6% 4.8% -3.3% 6.4% 4.4% each year. The dark
Non-Metallic Products -3.6% -28.2% -11.7% 29.3% 13.8% red illustrates the
Construction and manufacturing suffer from a scaling back in investment Metal Products -0.3% -27.3% -12.5% 28.5% 13.3% weakest sectors in
projects, supply chain disruptions and drop in domestic and external Computer & Electronic Products 0.7% -27.5% -12.8% 28.8% 13.6% that particular year
demand. The pace of recovery is also restricted by the protracted Machinery & Equipment -6.7% -36.1% -3.6% 31.5% 14.6%
and the lighter shade
weakness in investment. This compounds already poor longer term Transport Equipment -6.4% -45.0% 6.6% 37.9% 15.0%
prospects for some of these manufacturing sectors. Some of the Other Manufacturing -2.9% -32.8% -7.8% 30.1% 13.4% reveals the stronger
weakness is offset by import substitution opportunities. Utilities -0.7% -20.8% -17.5% 28.1% 13.9% sectors. For
Construction of Buildings 2.4% -29.0% -10.9% 30.3% 14.9% example, in 2020 the
Civil Engineering 2.4% -29.0% -11.0% 30.2% 14.8% accommodation and
Least impacted: Specialised Construction Activities 2.4% -29.0% -10.9% 30.4% 15.0%
food service sector is
Wholesale 2.9% -31.2% -6.7% 31.0% 14.8%
Health and Pharmaceuticals protected by demand for health products Retail 3.0% -41.0% -9.0% 42.3% 17.3% expected to be the
and services. Medium term growth in Health, along with the other Land Transport, Storage & Post 3.0% -27.4% -12.0% 31.0% 15.4% weakest sector and
public services, is curbed by government austerity measures. Air & Water Transport -1.2% -42.6% 3.6% 36.8% 15.2% therefore has the
Accommodation & Food Services 2.1% -46.9% -3.1% 47.8% 16.9%
darkest shade of red.
Telecoms, Computing and Information Services hit less hard during the Recreation 0.7% -44.2% 2.0% 42.5% 15.3%
At the other end of
crisis period as spending on technology falls by less than on other Media Activities 6.1% -19.0% -16.8% 29.3% 15.1%
products & services. Amongst the first to return to pre-Covid levels. Telecoms -2.0% -18.8% -18.4% 29.6% 15.9% the scale, we expect
Maintain position as one of the stronger performers over the long term. Computing & Information Services 9.3% -18.3% -17.4% 29.4% 15.6% growth to be
Finance -3.0% -20.7% -17.0% 29.9% 16.6% strongest in 2020 is
Agriculture and Food Production suffers relatively less during 2021 as Insurance & Pensions -3.2% -23.8% -17.9% 27.9% 13.4%
Real Estate 0.6% -24.4% -15.1% 29.1% 14.7%
the health sector.
food spending holds up. Medium term growth prospects helped by
Professional Services 2.4% -19.9% -18.1% 29.3% 15.4%
import substitution. Admine & Supportive Services 3.0% -21.4% -16.1% 29.7% 16.1%
Other Private Services -1.6% -27.0% -10.1% 29.1% 14.1%
Public Administration & Defence 2.1% 0.6% -0.6% 0.8% 0.0%
Education 2.7% -31.4% 2.4% 28.6% 7.8%
24 © Experian Health 1.7% 5.2% 4.4% 6.2% 2.1%
Residential Care & Social Work 1.9% 2.4% -2.3% 3.5% 1.3%Scenario 3 W-shape recovery – Local results
GVA Workforce jobs
A second lockdown leads to a sharp drop in The second lockdown triggers a renewed
GVA of more than 20% across West Yorkshire wave of job shedding and business
this year. In an area like Kirklees in which insolvencies lead to significant job losses
construction and manufacturing – the two across West Yorkshire. Unlike the other
sectors expected to be hit hardest in the cases, with less financial support from the
second lockdown – accounts more for 30% of government, not all furloughed staff return
GVA is more exposed to scaling back in to employment and therefore areas with
investment and therefore expected to suffer higher concentration of the most vulnerable
disproportionately worse than the rest. sectors are likely to see permanent job
Economic recovery is likely to more uneven losses range between 4.4% and 5.5% of
across sectors due to varying scarring effects employment in 2020. Wakefield is expected
resulting from weakness in investment and to have the largest job loses this year
disruptions in supply chain, which is likely to followed by Kirklees. Employment levels in
have more adverse impact in Kirklees. most areas are unlikely to return to pre-
Covid before 2026.
Unemployment Incomes
The second lockdown triggers a second round Household income is expected to suffer
of mass redundancies which push the from a steep fall in 2020 and 2021 weight
unemployment rate more than 15% in Kirklees down by stubbornly high unemployment
and Wakefield in 2021. Leeds and Calderdale and lack of business confidence. In the
are expected to fare better than most as short term, household income in Bradford
business services sector is better place during appears to be more resilient. Once the
the crisis period as spending on technology economy recovery is firmly entrenched, a
and services has fallen less than others. Unlike recovery in household income emerges
the other cases, not all furloughed staff return from 2022 as restrictions ease and
to employment. Unemployment remains unemployment begins to fall we are
elevated through 2021, leading to an rise in expected to see stronger household income
structural unemployment; areas such as growth in Leeds and Calderdale
Bradford and Wakefield are more likely to see
persistent high unemployment.
Source: Experian
25 © ExperianScenario 3 W-shape recovery – Local results
Annual GVA growth (%) Annual workforce jobs growth (%)
2019 2020 2021 2022 2023 2024 2025 2019 2020 2021 2022 2023 2024 2025
Bradford 0.6 -21.3 -7.1 22.1 10.2 0.8 0.9 Bradford 0.0 -4.4 -3.9 1.6 1.9 1.9 1.8
Calderdale 0.8 -23.3 -9.3 25.0 12.1 1.3 1.1 Calderdale -0.6 -5.0 -5.4 2.3 3.1 2.8 2.4
Kirklees 0.9 -24.5 -7.6 24.8 11.6 1.3 1.2 Kirklees -0.6 -5.2 -5.8 2.2 2.9 2.6 2.2
Leeds 1.5 -22.2 -8.9 23.5 12.4 1.6 1.5 Leeds 0.7 -4.6 -5.3 2.4 3.3 3.0 2.6
Wakefield 0.8 -21.2 -8.8 20.8 10.0 0.9 0.9 Wakefield -0.2 -5.5 -6.4 1.7 2.2 2.0 1.8
YH 0.9 -22.1 -8.9 23.2 11.2 1.3 1.2 YH -0.2 -4.9 -5.8 2.1 2.8 2.6 2.3
UK 1.4 -22.5 -8.9 23.7 11.7 1.6 1.5 UK 1.7 -5.0 -6.0 2.1 3.0 2.8 2.4
ILO unemployment rate (%) Real incomes growth (%)
2019 2020 2021 2022 2023 2024 2025 2019 2020 2021 2022 2023 2024 2025
Bradford 5.6 10.4 13.7 12.6 11.3 10.1 9.0 Bradford 0.6 -7.2 -4.8 1.5 2.8 3.0 2.2
Calderdale 4.0 9.6 14.2 12.5 10.2 8.2 6.5 Calderdale 0.2 -8.1 -6.4 1.7 3.5 3.5 2.4
Kirklees 4.3 10.0 15.1 13.5 11.4 9.5 7.9 Kirklees 0.4 -8.0 -6.7 1.9 3.6 3.6 2.5
Leeds 4.1 9.6 14.3 12.7 10.4 8.3 6.6 Leeds 0.4 -8.0 -6.3 2.2 3.9 3.9 2.7
Wakefield 4.6 10.3 15.6 14.3 12.7 11.3 10.0 Wakefield 0.2 -8.0 -6.9 1.2 2.4 2.6 1.9
YH 4.4 9.7 14.7 13.2 11.1 9.2 7.6 YH 0.4 -7.8 -6.7 2.0 3.7 3.6 2.5
UK 3.8 9.5 14.7 13.3 11.1 9.0 7.3 UK 0.7 -7.7 -6.9 2.3 4.1 4.0 2.6
Source: Experian
26 © ExperianSummary local results
Unemployment
GDP Rate (%) Income Employment
2020 2021 2022 2020 2021 2022 2020 2021 2022 2020 2021 2022
V-Shape Scenario
Bradford -10% 13% 2% 8.7 7.3 6.4 -5% 4% 2% -2% 2% 1%
Calderdale -10% 15% 2% 7.5 6.2 5.0 -6% 4% 2% -3% 2% 2%
Kirklees -12% 16% 2% 7.8 6.5 5.3 -6% 4% 2% -3% 2% 2%
Leeds -9% 13% 2% 7.6 6.5 5.2 -6% 5% 2% -2% 2% 2%
Wakefield -9% 13% 1% 7.7 6.4 5.4 -5% 4% 2% -3% 1% 1%
Delayed V Scenario
Bradford -15% 14% 4% 9.8 9.7 8.2 -6% 3% 3% -4% 0% 2%
Calderdale -16% 15% 4% 8.6 8.4 6.3 -7% 3% 3% -4% 0% 3%
Kirklees -17% 17% 4% 8.8 8.6 6.6 -6% 3% 3% -4% 0% 3%
Leeds -15% 14% 4% 8.7 8.7 6.5 -6% 4% 4% -4% 0% 3%
Wakefield -14% 13% 3% 8.9 8.8 7.1 -6% 3% 3% -4% 0% 2%
W-Shape Scenario
Bradford -21% -7% 22% 10.4 13.7 12.6 -7% -5% 1% -4% -4% 2%
Calderdale -23% -9% 25% 9.6 14.2 12.5 -8% -6% 2% -5% -5% 2%
Kirklees -25% -8% 25% 10.0 15.1 13.5 -8% -7% 2% -5% -6% 2%
Leeds -22% -9% 24% 9.6 14.3 12.7 -8% -6% 2% -5% -5% 2%
Wakefield -21% -9% 21% 10.3 15.6 14.3 -8% -7% 1% -5% -6% 2%
27 © Experian
Source: ExperianSensitivity analysis
The scenarios help to illustrate the channels through which the impact of Covid is felt
across the economy. The variables highlighted below are the most important drivers of
Scenario 1: Scenario 2: Scenario 3:
the outlook. The table opposite shows estimates of the sensitivity of the economy to V Delayed V W
changes in these key drivers across the 3 scenarios.
Covid assumptions
1. Global economic outlook: the scenarios assume that the evolution of the
pandemic and measures to contain it are similar in other countries. An earlier 12-18
easing abroad compared to the UK would mean global demand for UK exports Strict social distancing measures in place 3 months 5 months months
recovers faster. Also, UK exports would benefit from spillovers as supply chain
Working vaccine timescales Early 2021 Mid 2021 End 2021
disruptions ease.
GDP
2. Persistence of a fall in UK activity
Peak to trough hit to output 26% 26% 39%
a. How long social distancing and support measures are in place. These factors
Number of quarters to return to pre-covid
progressively increase across each scenario.
level 2020Q4 2022Q1 2025Q2
b. How households & businesses respond once measures are lifted. Persistent LT scarring vs precovid forecast – levels* 0% 4% 10%
uncertainty in case 3 weighs on confidence and increases voluntary social distancing.
This undermines spending and hiring compared to cases 1 & 2. In contrast, these LT scarring vs precovid forecast - growth
impacts are short-lived and unwind rapidly in case 1. rates** 0 0 -0.2
3. Degree of long lasting scarring in the economy: the prolonged period of crisis Unemployment Rate
and weaker recovery in case 3 weighs heavily on investment and spending on training Peak to trough hit to unemployment rate*** 5.9 6.3 11.1
and innovation. This results in a reduction in the economy’s productive potential and
hence greater scarring outcomes than the other cases. Number of quarters to return below 5% 10 15 37
Latest evidence has been encouraging and point to a V shape recovery in the
LT scarring (vs precovid forecast)** 0 0.2 1
near term. High frequency data show some improvement in the UK’s main trade Source: Experian * Percentage loss in level of GDP by 2030 **Percentage point difference in 2030 *** percentage points
partners since April as restrictions have been rolled back. UK data suggest the While these developments are encouraging, maintaining the momentum over the medium term will be difficult for a
economy troughed in April, with a recovery emerging thereafter. Suppression number of reasons. The squeeze on consumer incomes due to job shedding and lower earnings is unlikely to turnaround
measures have been gradually unwound since May. In June, retail stores reopened, quickly and the tapering of the furlough scheme from August risks triggering further increases in unemployment. Alongside
from July some hospitality and leisure businesses are set to resume trading and this, the relatively swift timetable for rolling back suppression measures has raised the risk of a resurgence in Covid cases
planned reductions in travel restrictions have also been announced. Alongside this, and a potential W type scenario. Even if the government is able to contain these locally, the likely response (local lockdown s)
business surveys have improvded, retail sales rebounded in May and anecdotal will weigh on the recovery. This backdrop will keep businesses and consumers cautious, which could drive behaviours such
evidence of advance bookings suggest pent up demand will add impetus to the as voluntary social distancing and reduced appetite to spend.
recovery.
28 © ExperianAnnex 1: Pre-Covid baseline forecasts
Annual GVA growth (%) Annual workforce jobs growth (%)
2019 2020 2021 2022 2023 2024 2025 2019 2020 2021 2022 2023 2024 2025
Bradford 0.6 0.9 1.4 1.6 1.6 1.6 1.6 Bradford 0.0 0.6 0.7 0.7 0.5 0.5 0.5
Calderdale 0.8 0.7 1.3 1.5 1.5 1.5 1.4 Calderdale -0.6 0.6 0.6 0.5 0.5 0.5 0.4
Kirklees 0.9 0.8 1.3 1.5 1.5 1.5 1.5 Kirklees -0.7 0.6 0.5 0.5 0.5 0.4 0.4
Leeds 1.5 1.0 1.6 1.8 1.8 1.8 1.8 Leeds 0.7 0.9 0.7 0.7 0.7 0.6 0.6
Wakefield 0.8 0.6 1.2 1.4 1.4 1.5 1.4 Wakefield -0.2 0.6 0.5 0.5 0.5 0.4 0.4
YH 0.9 0.8 1.3 1.5 1.5 1.5 1.5 YH -0.2 0.6 0.5 0.5 0.5 0.4 0.4
UK 1.3 1.1 1.6 1.7 1.8 1.8 1.8 UK 1.7 0.7 0.6 0.6 0.5 0.5 0.5
ILO unemployment rate (%) Real incomes growth (%)
2019 2020 2021 2022 2023 2024 2025 2019 2020 2021 2022 2023 2024 2025
Bradford 5.6 5.6 5.4 5.2 5.1 5.1 5.1 Bradford 0.8 0.7 1.2 1.5 1.6 1.7 1.8
Calderdale 4.0 4.0 3.9 3.8 3.7 3.7 3.8 Calderdale 0.6 0.6 1.1 1.3 1.5 1.5 1.5
Kirklees 4.3 4.3 4.4 4.2 4.2 4.2 4.3 Kirklees 0.9 0.9 1.3 1.5 1.7 1.7 1.8
Leeds 4.1 4.2 4.2 4.0 3.9 3.9 4.2 Leeds 1.0 1.2 1.5 1.8 2.0 2.0 2.1
Wakefield 4.6 4.4 4.3 4.0 3.8 3.8 3.9 Wakefield 0.7 0.9 1.3 1.4 1.5 1.5 1.7
YH 4.4 4.4 4.3 4.2 4.1 4.1 4.2 YH 0.8 0.9 1.3 1.5 1.7 1.7 1.7
UK 3.8 3.9 3.9 3.9 3.8 3.8 3.8 UK 1.0 1.3 1.6 1.8 1.9 2.0 1.9
Source: Experian
29 © ExperianYou can also read


