Oil Price Paths in 2018: The Interplay bertween OPEC, US Shale and Supply Interruptions - Oxford Institute for Energy Studies
←
→
Page content transcription
If your browser does not render page correctly, please read the page content below

February 2018
Oil Price Paths in 2018:
The Interplay bertween OPEC, US Shale
and Supply Interruptions
Abstract
2018 started on a positive note for oil markets with Brent prices breaking through $70 a barrel for a
few days and all the key international crude oil benchmarks flipping into backwardation. Yet, there is
still a wide uncertainty engulfing the oil market, with very divergent views among market observers
about how the oil price path could evolve in 2018, with some revising upwards their forecasts to
higher than $80/b while others are less convinced that the market fundamentals can sustainably
support a price above $70/b, expecting a lower path in the mid $60/b. The key uncertainties behind
these divergent views mainly pertain to different views about:
The OPEC/NOPEC exit strategy from the output cut agreement reached in November 2016;
US shale supply response to the recent oil price rise;
The potential impact of higher oil prices on global oil demand;
The extent of supply disruptions amid a fragile geopolitical environment.
In this Energy Insight, we analyse how the oil price path could evolve in 2018 by evaluating the
aforementioned risks underlying the world oil market using a structural model of the oil market and
considering various forecast scenarios. Forecast scenarios are not predictions of what will happen,
but rather modelled projections of various oil price risks conditional on certain events that are known
at the time of the forecast or some other hypothetical events. Our reference forecast scenario projects
for Brent to trade within a narrow price range, with a price floor at above $60/b and a ceiling of below
$75/b, with a 2018 average price of $67/b. The baseline forecast suggests that the momentum of
stronger than expected oil demand and the OPEC/NOPEC output cuts have tightened the oil market
in 2017 and even with no change in current market dynamics, the oil price will continue to be
supported at around $65/b. Our results show that for 2018, US shale output growth will be the key
factor putting a ceiling on the oil price, while supply disruptions could provide some support to the oil
price, with a sharp fall in Venezuelan output constituting the biggest geopolitical risk that could push
prices well above our baseline or reference forecasts. The results also show the paramount
importance for the strong oil demand momentum experienced in 2017 to carry on into 2018 for
rebalancing the market and supporting the oil price. Finally, our results show that for OPEC/NOPEC
to maintain the recent price gains, they have to extend their output cut until the end of 2018; releasing
the withheld barrels under the current agreement would result in a sharp fall in oil prices, suggesting
that OPEC/NOPEC should be very wary about unwinding the output cut agreement when they next
meet in June 2018.
Energy Insight: 28 Bassam Fattouh, Director OIES &
Andreas Economou, Research Associate, OIES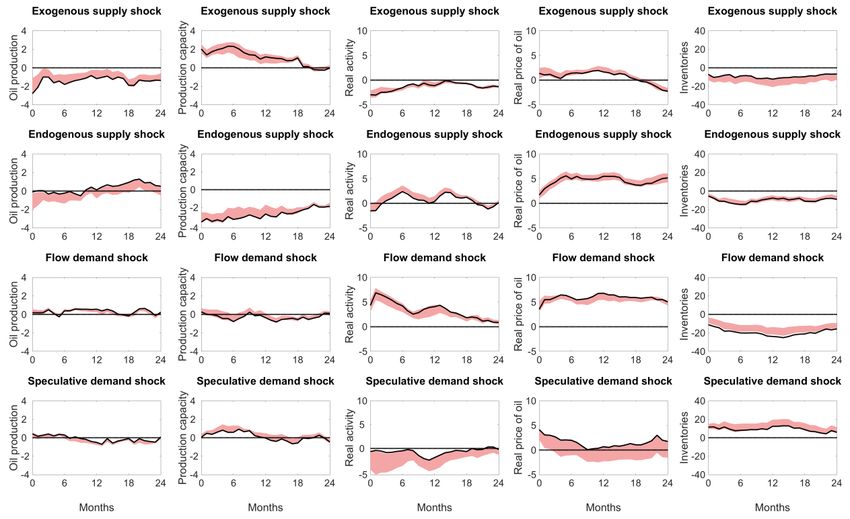
1. Introduction
In 2017, the Brent price1 averaged at $54.5/b, an increase of around $10/b from the 2016 average of
$44.7/b. Another strong year of global oil demand growth estimated at 1.6%, driven by a synchronised
global growth upsurge in economic activity last seen in 2010, 2 and the unexpectedly high OPEC/Non-
OPEC compliance to the joint production cut of 1.8 mb/d agreed in November 2016 have led to tighter
oil market balances, as well as a substantial drop in OECD oil stocks by about 110 mb year-end.
Preliminary IEA data show that as of December 2017, OECD oil inventories stood only 55 mb above
the five-year average, down from the peak of 366 mb in July 2016. This robust oil market performance
occurred despite the unexpectedly strong recovery in US shale oil production that returned to growth
by nearly 1.0 mb/d year-end, surpassing the previous peak of 4.7 mb/d in March 2015 and reaching
5.1 mb/d as of December 2017. In addition, crude oil production from Libya and Nigeria has also
unexpectedly recovered by 0.38 and 0.27 mb/d year-on-year, though in the second half of 2017 the
geopolitical context in the MENA region deteriorated sharply due to a variety of armed conflicts and
intra-regional tensions.
Figure 1: Oil market indicators for 2017

Notes: The global real economic activity index is due to Kilian (2009, ‘Not All Oil Price Shocks Are Alike:
Disentangling Demand and Supply Shocks in the Crude Oil Market’, American Economic Review, 99(3), pp.
1053-1069). The data on OECD oil inventories are based on IEA’s Oil Market Report. The measures of oil supply
balances and geopolitical supply disruptions are based on Economou (2016, ‘Oil Price Shocks: A Measure of the
Exogenous and Endogenous Supply Shocks of Crude Oil’, OIES Paper WPM 68, Oxford: Oxford Institute for
Energy Studies). US shale oil production estimates are based on EIA. Real-time data for November and
December, but the real Brent price and the US shale production, have been extrapolated using nowcasting
techniques based on preliminary estimates by the IEA and EIA.

1
  The Brent (or oil) price in this Energy Insight refers to the monthly Brent price benchmark expressed in real terms, deflated by
the US consumer price index in December 2017 USD, unless otherwise stated.
2
  IMF, ‘Brighter Prospects, Optimistic Markets, Challenges Ahead’, WEO Update, 22 January 2018. Available at:
https://www.imf.org/en/Publications/WEO/Issues/2018/01/11/world-economic-outlook-update-january-2018

The contents of this paper are the authors’ sole responsibility. They do not necessarily represent the views of                  2
the Oxford Institute for Energy Studies or any of its Members.
As we enter 2018, the year started on a positive note with Brent prices breaking the $70/b threshold for a few days and all the key international crude oil benchmarks flipping into backwardation. Yet, there is still a wide uncertainty engulfing the oil market, with very divergent views among market observers about how the oil price path could evolve in 2018, with some revising upwards their forecasts to higher than $80/b while others remain less convinced that the market fundamentals can sustainably support a price above $70/b, expecting a lower path in the mid $60/b. The key uncertainties behind these divergent views mainly pertain to different views about: The OPEC/NOPEC exit strategy from the output cut deal reached in November 2016; US shale supply response to the recent oil price rise; The potential impact of higher oil prices on the growth of global oil demand; The extent of supply disruptions amid a fragile geopolitical environment. In this Energy Insight, we analyse how the oil price path could evolve in 2018 by evaluating the aforementioned risks underlying the world oil market, with the help of forecast scenarios of the real Brent price pioneered by Baumeister and Kilian (2014) 3. Forecast scenarios are not predictions of what will happen, but rather modelled projections of various oil price risks conditional on certain events that are known at the time of the forecast or some other hypothetical events. In practice, such conditional forecasts allow us to assess by how many dollars per barrel the expected real price of oil would change under alternative scenarios about future oil supply and oil demand conditions, relative to a baseline (or unconditional) forecast where expected oil market conditions remain unchanged; in that all future structural shocks are zero in expectation. Our oil price forecasts are constructed from a structural VAR world oil market model in the tradition of Kilian and Murphy (2014)4, which has been extended by Economou et al. (2017a) 5 to decompose the oil supply determinant into its exogenously- and endogenously-driven components. This distinction is important in understanding historical oil price fluctuations, as it has been recently shown that the relative importance of oil supply shocks to the real price of oil differs greatly, depending on the nature of the shock. Indeed, Economou et al. (2017a) demonstrate that endogenous supply shocks associated with the supply decisions of the oil market participants have produced larger and more persistent fluctuations in the real price of oil over the past three decades, rather than supply shocks that are strictly exogenously-driven. Furthermore, the authors demonstrate that forecasting models that are able to distinguish between oil supply shocks that are different in nature are important in gauging realistic future oil supply and oil demand shock sequences and hence, enjoy superior out-of- sample predictive accuracy as compared to traditional forecasting models that incorporate shocks to the flow supply of oil collectively. As our baseline model, we consider the five-variable structural VAR model of the world oil market due to Economou et al. (2017) that incorporates 24 lags, an intercept and seasonal dummies. The model is re-estimated based on data extending to December 2017. The model contains the real Brent price, a measure of oil production shortfalls in OPEC producing countries due to exogenous geopolitical events, a newly constructed index designed to capture any positive and negative deviations of production capacity from the equilibrium production path, a measure of global real economic activity 3 Baumeister, C. and Kilian, L. (2014), ‘Real-Time Analysis of Oil Price Risks Using Forecast Scenarios’, IMF Economic Review, 62(1), pp. 119-145. 4 Kilian, L. and Murphy, D. P. (2014), ‘The Role of Inventories and Speculative Trading in the Global Market of Crude Oil’, Journal of Applied Econometrics, Vol. 29, pp. 454-478. 5 Economou, A., Agnolucci, P., Fattouh, B. and De Lipsis, V. (2017a). ‘A Structural Model of the World Oil Market: The Role of Investment Dynamics and Capacity Constraints in Explaining the Evolution of the Real Price of Oil’, OIES Energy Insight No. 23, Oxford: Oxford Institute for Energy Studies. The contents of this paper are the authors’ sole responsibility. They do not necessarily represent the views of 3 the Oxford Institute for Energy Studies or any of its Members.

due to Kilian (2009a) and a proxy for changes in global crude oil inventories using OECD oil stocks
held by industry.6 The model is designed to distinguish between five structural shocks:
Shocks to oil supply that are caused by exogenous geopolitical events in oil-producing countries,
referred to as exogenous supply shocks;
Shocks to oil supply that arise by the output decisions of the oil market participants and can lead
to supply-driven market imbalances due to risks of either under- or over-investment in new
productive capacity, referred to as endogenous supply shocks;
Shocks to oil demand for immediate consumption associated with fluctuations in the global
business cycle, referred to as flow demand shocks;
Shocks to stock demand arising from the forward-looking behaviour of the market participants,
referred to as speculative demand shocks;
Other idiosyncratic oil demand shocks not otherwise captured by the preceding structural shocks,
referred to as other demand shocks.
The structural oil supply and oil demand shocks in the model are jointly identified based on a
combination of sign restrictions on the structural impulse responses and bounds on the impact price
elasticities of oil supply and oil demand, motivated by economic theory. For a detailed discussion of
the identifying assumptions the reader is referred to Economou et al. (2017a). 7 Changes in the
composition of these structural shocks underlying the price of oil are not only important in explaining
past price movements, but they are also important in interpreting our forecasts of the real Brent price.
2. A review of the oil price path in 2017
In Economou et al. (2017b)8 we explored how the oil price path could evolve in 2017, by assessing
various oil price risks known to us at the time of the forecasting exercise. We considered a range of
alternative assumptions about market conditions in 2017 pertaining to the implementation of the
OPEC/NOPEC output cut agreement, the extent of the US shale supply response to the anticipated
price increase due to the OPEC/NOPEC output cutbacks, a set of different scenarios about the
growth of global economic activity, as well as the relative impact of various hypothetical geopolitical
episodes on the real price of oil. Now that 2017 is behind us, it is useful to review how our real-time
forecasting model did perform. Although the full range of our final forecast scenarios considers three
principal cases (namely the reference, the optimistic and the pessimistic) we will focus on the
reference and OPEC/NOPEC agreement extension scenarios. It is important to recall that as of
December 2016 it was announced that the duration of the OPEC/NOPEC output cut agreement was
only for six months (till June 2017) and extendable as of July 2017 only after careful consideration of
the market conditions during OPEC’s mid-year ministerial meeting in May.9 The key assumptions for
each principal case under consideration are displayed in Table 1, along the actual outcome of the
prevailing oil market conditions in 2017.
6
For details on the definition and construction of the supply-based measures, the reader is referred to Economou (2016).
Further details on the construction of the real economic activity index are found in Kilian (2009), while the rationale for using
OECD oil stocks as a proxy for global oil inventories is discussed in Kilian and Murphy (2014).
7
The estimates of the responses of each model variable to each oil supply and oil demand shock, and the historical
decomposition of the real price of oil based on each structural shock are shown in Appendix A.
8
Economou, A., Fattouh, B., Agnolucci, P. and De Lipsis, V. (2017b). ‘Oil Price Paths in 2017: Is a Sustained Recovery of the
Oil Price Looming?’, OIES Energy Insight No. 23, Oxford: Oxford Institute for Energy Studies.
9
OPEC, ‘OPEC and non-OPEC Ministerial Meeting’, Press Release, 10 December 2016. Available at:
http://www.opec.org/opec_web/en/press_room/3944.htm
The contents of this paper are the authors’ sole responsibility. They do not necessarily represent the views of 4
the Oxford Institute for Energy Studies or any of its Members.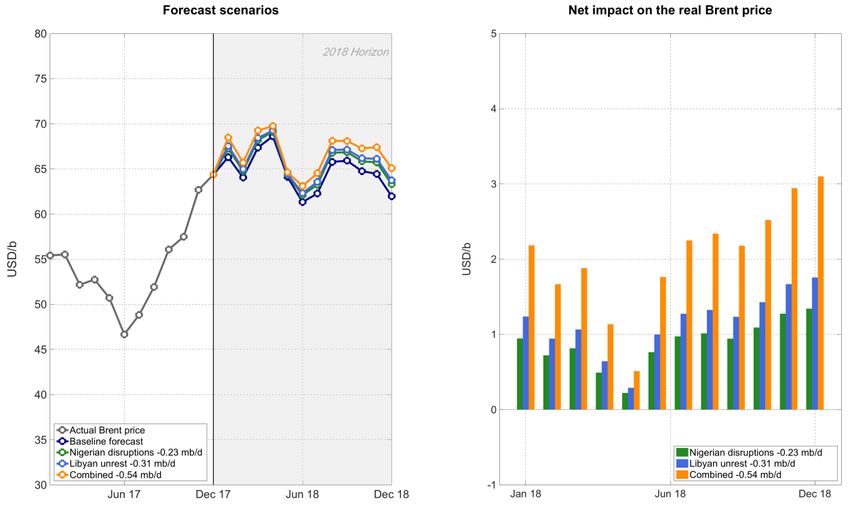
Table 1: Actual vs key assumptions of the principal forecasting scenarios for 2017
Assumptions              Reference case           OPEC/NOPEC                    Actual
                                              extension in the 2H17
  OPEC/NOPEC                                                                                           82% - 1H2017
                                          75%                              75%
  compliance                                                                                           100% - 2H2017

  US shale supply                     + 0.2 mb/d                       + 0.2 mb/d                         + 0.41 mb/d
  response (y-o-y)

  Growth of global oil                  + 1.4%                            + 1.4%                             + 1.6%
  demand

  OPEC/NOPEC
  agreement                               NO                               YES                                YES
  extension
Source: Economou et al. (2017b).

Figure 2: Actual vs projected oil price paths in 2017, in 2016.8 USD/b

Source: Economou et al. (2017b).

Figure 2 compares the actual and selected projected paths of the real Brent price in 2017, expressed
in August 2016 USD/b. For the reference case (dark blue line), our model projected a moderate
increase in the real oil price towards $55/b in the first half of 2017 and then stabilises at that level for
the remainder of the year, which is about $8/b below the realised Brent price of $63/b year-end (grey

The contents of this paper are the authors’ sole responsibility. They do not necessarily represent the views of         5
the Oxford Institute for Energy Studies or any of its Members.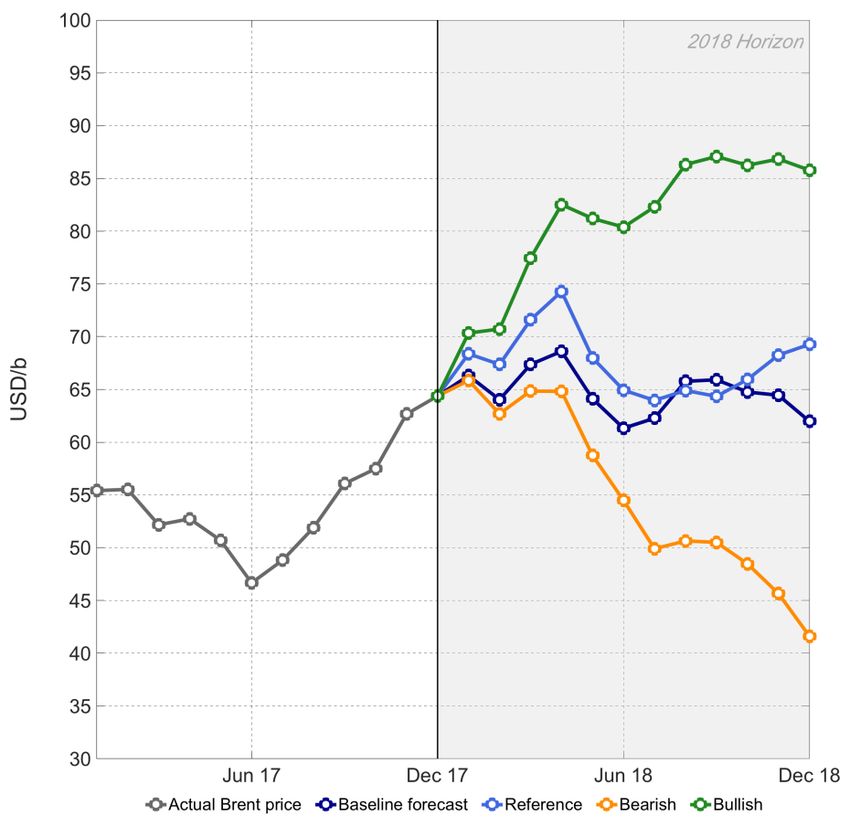
line). For the OPEC/NOPEC extension case (light blue line) which involves an additional discrete
endogenous supply shock as of July 2017, the forecast performs remarkably well as it predicts a price
increase towards $64/b year-end, which is very close to the realised price. There are two instances
where the actual and modelled oil price paths diverge significantly, both of which are observed in the
first half of 2017. The first instance relates to the first quarter of the forecasts and is associated with
the fact that the bulk of the oil price gains due to the anticipated OPEC/NOPEC output cutback as of
January 2017, had already been priced in since December 2016. This is shown in the left panel of
Figure 3 that shows that out of the cumulative $8.7/b increase in the December 2016 price, about
$7/b are attributed to a speculative demand shock and only less than $2/b can be attributed to actual
changes in oil supply conditions. This point is consistent with several empirical studies in the literature
that demonstrate news about future oil production and/or future oil demand can have large immediate
effects on the real price of oil through their effect on oil inventories and not actual changes in crude oil
production. 10 With this in mind, the right panel of Figure 3 illustrates that considering the
implementation of the OPEC/NOPEC agreement as of January 2017, our model did a stellar job in
predicting the cumulative impact of the output cutback on the real price of oil over the first quarter, by
forecasting a cumulative price increase of $9.6/b compared to the actual increase of $9.8/b over the
same period. The second instance of large divergence between the actual and projected oil price
paths relates to the unexpected decline in the Brent price observed in the second quarter of 2017.
Insights into the nature of this price shock may be obtained by evaluating the cumulative effect of
each supply and demand shock on the real price of oil, as obtained by our baseline structural model
extended to December 2017.
Figure 3: Impact of the OPEC/NOPEC output cut agreement on the real Brent price

Source: Economou et al. (2017b).

10
  See, for example, Alquist and Kilian (2010, ‘What Do We Learn from the Price of Crude Oil Futures?’, Journal of Applied
Econometrics, 25(4), pp. 539-573) and Kilian and Lee (2014, ‘Quantifying the Speculative Component in the Real Price of Oil:
The Role of Global Oil Inventories’, Journal of International Money and Finance, 42, pp. 71-87).

The contents of this paper are the authors’ sole responsibility. They do not necessarily represent the views of                6
the Oxford Institute for Energy Studies or any of its Members.
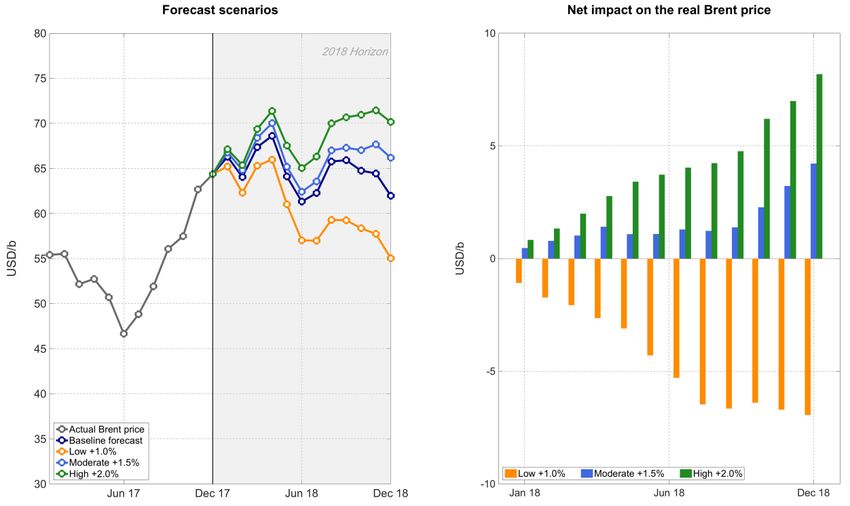
Figure 4 shows by how many dollars per barrel each structural shock contributed to the cumulative
change in the real Brent price during the entire year (upper panel) and half a year (lower panel).
Overall, results show that the oil price increase from January to December 2017 (an increase of $9/b)
was materialised by a combination of several oil market shocks:
The unexpected easing of the supply disruptions particularly from Libya and Nigeria contributed to
around $1/b decline in the real oil price (bar 1);
The output cutbacks from the OPEC/NOPEC oil producers on the one hand offset by the strong
response of the US shale oil production reacting to the signal on the other hand, resulted in a net
decrease of the real Brent price by about $10/b (bar 2);
The robust growth of global oil demand has been a catalytic factor in 2017, counteracting the
impact of higher US shale production and adding to the real Brent price about $13/b year-end
(bar 3);
Speculative demand shocks driven primarily by fears of unexpected geopolitical supply
disruptions contributed by $5/b to the cumulative price increase (bar 4).
Figure 4: Drivers of the real Brent price in 2017, in USD/b
Source: Constructed by the authors
The contents of this paper are the authors’ sole responsibility. They do not necessarily represent the views of 7
the Oxford Institute for Energy Studies or any of its Members.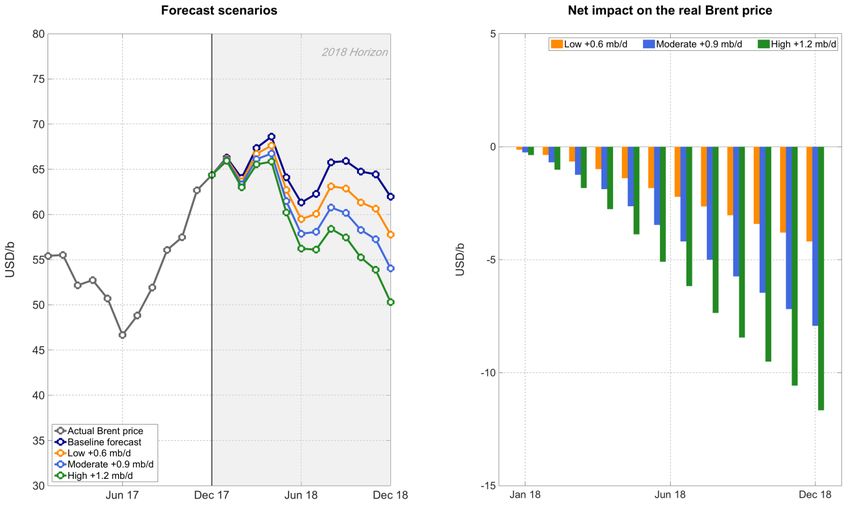
A closer examination reveals that 2017 was a year of two-halves. In the first half of the year, large
positive endogenous supply shocks originating from the US shale oil producers amid a weaker-than-
expected global economy contributed to a $9/b oil price fall. In addition, the fall was exacerbated by
the markedly weak compliance of the non-OPEC oil producers to their agreed output cutbacks, which
in the first half of 2017 stood at a mere 58% (see Figure 5). Higher OPEC/NOPEC compliance
however in the second half of 2017 (adding $3/b) amid a very strong third quarter of global economic
activity in advanced and emerging economies combined (adding $12/b), reversed the dynamics of the
first half and pushed the real Brent price higher by close to $18/b. During this period, oil market
balances turned significantly tighter causing a steady decline in oil inventories. As inventories
declined and geopolitical situation deteriorated in the second half of 2017, the demand for storage
increased, with the speculative demand shock contributing to almost $6/b in the price rise over the
remainder of the year. The exogenous shock, reflecting the recovery in Libyan and Nigerian output,
helped cap the price but only marginally around $2/b in the second half of the year.
Figure 5: Compliance levels for the OPEC/NOPEC oil-producers in 2017

Notes: Calculations are based on IEA’s monthly Oil Market Report.

3. Oil price risks in 2018
Figure 6 presents the actual level of the real Brent price for 2017 along the baseline forecast starting
in January 2018 and extending for the remainder of the year, based on all available information as of
December 2017. The baseline (or unconditional) forecast predicts the out-of-sample expected change
in the real price of oil based on real-time data, conditional on the assumption that there is no change
in the expected oil supply and oil demand conditions. As Figure 6 shows, the baseline forecast
projects an increase in the oil price to just below $70/b in April, before falling to the low $60/b in June.
The price recovers in the third quarter of the year near $65/b, falling again marginally to around $62/b

The contents of this paper are the authors’ sole responsibility. They do not necessarily represent the views of   8
the Oxford Institute for Energy Studies or any of its Members.
by the end of the year. The baseline forecast projects an average real price of oil of around $65/b for
2018, an increase of more than $10/b from 2017. These results suggest that the momentum of
stronger than expected oil demand and the OPEC/NOPEC output cuts in 2017 have tightened the oil
market insofar as even with no change in current market dynamics, the oil price will continue to be
supported at around $65/b in the year to come.
Figure 6: Baseline forecast of the real Brent price as of January 2018, in USD/b

Source: Constructed by the authors

The usefulness of our baseline forecast is that it allows us to evaluate various oil price risks inherent
in 2018, by constructing forecast scenarios under alternative assumptions about future market
conditions and convey how sensitive changes in the real price of oil under these assumptions are,
relative to the baseline forecast. It is important to note however that all forecast scenarios in the
remainder of this section should be read with caution, in that by construction, other future structural
shocks other than the shock in question corresponding to a given scenario, are set to zero. In other
words, the resulting effect on price by a given unanticipated shock modelled in each scenario is
conditional to all else remaining equal.11
In this section, we consider four main scenarios that have been identified as the key risks underlying
the expected oil price path in 2018 (i.e. baseline forecast):

11
   Moreover, as discussed in Kilian and Baumeister (2014, p. 128), forecast scenarios are time invariant in the sense that a
given hypothetical future structural shock fed into the model will cause the same revisions of the baseline forecast at each point
in time.

The contents of this paper are the authors’ sole responsibility. They do not necessarily represent the views of                  9
the Oxford Institute for Energy Studies or any of its Members.
The OPEC/NOPEC exit strategy from the November 2016 output cut agreement;
The US shale supply response to a higher oil price environment;
The uncertainties pertaining to the future growth of global oil demand;
The geopolitical risks underpinning key oil-producing countries.
The forecast horizon in all cases is set to twelve months and extends from January to December
2018.
3.1. OPEC/NOPEC exit strategy
One of the main uncertainties surrounding the oil market is how the OPEC/NOPEC deal would unfold
in 2018 and whether producers’ compliance would remain high in a higher oil price environment. In
this scenario, we consider three alternative views about the OPEC/NOPEC deal:
The OPEC/NOPEC cut is extended to December 2018 (the baseline forecast). This scenario is
motivated by strong signals from key OPEC members that they will maintain the output cut
agreement until the end of 2018 and a belief that by June 2018, OPEC/NOPEC would have not
yet achieved their objective of reducing stocks to the desired levels.
The OPEC/NOPEC output cut of 1.8 mb/d is extended only to June 2018. After June 2018, the oil
withheld by parties to the agreement is released back into the market. This could be motivated by
concerns that higher oil prices will induce strong supply and demand responses inducing
OPEC/NOPEC to be proactive on the upside. In our view, this scenario is highly improbable and
is included to show the impact on prices of a disorderly exit from the deal.
The OPEC/NOPEC producers gradually withdrawing from the deal. This scenario considers that
as the market tightens and oil prices rise, the OPEC/NOPEC producers in their next ministerial
meeting in June 2018 decide an orderly and gradual withdraw from the November 2016
agreement by lifting their production ceiling by 0.37 mb/d and 0.24 mb/d respectively. In this
event, the new cutback targets will be adjusted lower to 0.8 mb/d for OPEC and 0.3 mb/d for the
non-OPEC producers, effective July 2018. This scenario can also be interpreted as
OPEC/NOPEC compliance getting weaker in the second half of the year, with OPEC compliance
falling to 68% and non-OPEC compliance to 56%.
Figure 7 shows the oil price path under these alternative scenarios. As can be seen from the figure, a
complete exit from the deal and the release of the crude currently held under the agreement back into
the market will cause a sharp decline in the oil price. Compared to the baseline forecast, the oil price
will decline by more than $20/b falling all the way to $40/b at year-end. In the scenario where
OPEC/NOPEC decide to gradually reverse the output cut (and/or compliance is weaker), the impact
on the oil price will be smaller but still significant: compared to the baseline forecast, the oil price will
fall by slightly less than $10/b to around $54/b by the end of 2018. These results suggest that if
OPEC/NOPEC want to maintain the current price gains and put a floor under the oil price at $60/b,
they have to maintain the output cut for the rest of this year.
The contents of this paper are the authors’ sole responsibility. They do not necessarily represent the views of 10
the Oxford Institute for Energy Studies or any of its Members.Figure 7: OPEC/NOPEC exit strategy scenarios, in USD/b Source: Constructed by the authors 3.2. US shale oil production growth The response of US shale to a higher oil price environment remains the largest uncertainty engulfing the oil market, with estimates varying widely regarding the size of the increase in US shale supply in 2018. With US crude production expected to surpass the 10.04 mb/d all-time record in 2018 and considering that shale oil production alone currently accounts for about half of total US output, there is no clear sign of a US shale slowdown in the year to come.12 Despite the big story in 2017 being that US shale producers had to adapt to the reality of lower oil prices moving away from the growth-at- any-cost model;13 the US shale production recovery unfolded in 2017 driven by cost cuts, accelerating drilling activity and efficiency gains has damped down all narratives of a reversal to this momentum in 2018. Thus, this scenario considers three alternative views about US shale oil production growth: Low annual growth in US shale oil production of 0.6 mb/d. Moderate annual growth in US shale oil production of 0.9 mb/d. High annual growth in US shale oil production of 1.2 mb/d. Figure 8, which charts the evolution of the oil price under the various scenarios, shows that a high annual growth of US shale oil production of 1.2 mb/d, all else remaining equal, will push down the price to the $50/b level. That is more than a $10/b decline in the real Brent price compared to the baseline forecast. A less moderate but still strong growth of 0.9 mb/d, all else remaining equal, will push down the oil price to mid $50/b, while a slower growth of 0.6 mb/d will keep oil prices below 12 EIA, U.S. monthly crude oil production exceeds 10 million barrels per day, highest since 1970, Today in Energy, 1 February 2018. Available at: https://www.eia.gov/todayinenergy/detail.php?id=34772 13 Financial Times, US shale investors tire of growth-at-any-cost model, 23 October 2017. The contents of this paper are the authors’ sole responsibility. They do not necessarily represent the views of 11 the Oxford Institute for Energy Studies or any of its Members.
$60/b. These results indicate the important role US shale production growth plays in putting a cap on
the oil price, which is expected given its short-term investment cycle and hence, its high
responsiveness to price signals.
Figure 8: US shale production response scenarios, in USD/b
Source: Constructed by the authors
3.3. Global oil demand growth
The strong growth in global oil demand has been one of the major reasons for the oil market
rebalancing in 2017, with growth over the year estimated at 1.6%. 14 Looking ahead for 2018, many
expect for global demand to continue to play the key role in tightening the market. In this scenario, we
consider three alternative assumptions about the evolution of global oil demand in 2018:
Low global oil demand growth of 1%. This scenario is motivated by concerns that higher oil prices
(but also other shocks from outside the oil market) would have an adverse impact on economic
growth and hence on oil demand.
Moderate global oil demand growth of 1.5%. This scenario is motivated by a strong market
consensus that oil demand will continue to grow at rates similar or just slightly below 2017 levels
driven by increased global growth momentum, favourable global financial conditions and strong
consumers and investors sentiment.
High global oil demand growth of 2%. This scenario is motivated by some views that the increase
in the oil price could be beneficial to the global economy as higher oil prices can induce stronger
growth and higher government spending in net oil exporters, without hurting economic growth
prospects in net oil importers. Also, higher oil prices can induce much needed investment in the
oil and gas sector, which could push investment and growth higher.
14
IEA (2018), ‘Oil Market Report’, 19 January.
The contents of this paper are the authors’ sole responsibility. They do not necessarily represent the views of 12
the Oxford Institute for Energy Studies or any of its Members.Figure 9: Global oil demand growth scenarios, in USD/b
Source: Constructed by the authors
Figure 9, which charts the evolution of the oil price under the various scenarios of global oil demand
growth, shows that if the growth in global oil demand follows a similar momentum to last year, the oil
price would remain supported at above $65/b, slightly increasing the annual average by about $2/b
relative to the baseline forecast. A better than expected revision in global oil demand to 2% due to
better global economic performance would push the oil price to above $70/b, which is $8/b higher
than the baseline forecast. In contrast, a slowdown in global oil demand growth to 1% will drag prices
down, all the way to $55/b by end of 2018. These results correspond to about $1/b of the annual
average 2018 price for every 0.1% growth surprises of global demand year-on-year, suggestive of
the paramount importance of carrying the strong oil demand momentum experienced in 2017 into
2018 for rebalancing the market and supporting the oil price.
3.4. Geopolitical episodes
The final scenario assesses the geopolitical risks underlying the baseline forecast, hypothesising the
amplification of geopolitical tensions in Libya, Nigeria and Venezuela. Indicatively, we consider three
principal scenarios:
Libyan unrest: In this scenario, Libyan oil output would fall to its January 2017 level of 0.69 mb/d
from its December 2017 level of 1.01 mb/d. Although the recovery in Libyan output close to 1.0
mb/d in 2017 constituted an upside growth surprise last seen in 2013, the underlying causes for
the supply disruptions are far from being resolved. Therefore, the risks to Libyan production are
tilted to the downside.
Nigerian disruptions: In this scenario, Nigerian output falls to its January 2017 level of 1.43 mb/d
from its December 2017 levels of 1.66 mb/d. Similar to Libya, Nigeria managed to increase its
output in 2017 by about 0.25 mb/d, although sustaining these gains overlong is challenging due to
the regular attacks on oil infrastructure, looting and corruption. Such disruptions could continue or
even worsen, as a lasting settlement with the key militant groups is still a long way off.
The contents of this paper are the authors’ sole responsibility. They do not necessarily represent the views of 13
the Oxford Institute for Energy Studies or any of its Members. Venezuelan crisis: In this scenario, Venezuela’s output continues on its downward trend and
suffers an additional loss of 0.2 mb/d from December 2017 levels of 1.83 mb/d as the economy
goes into deeper crisis and the government is unable to pay contractors (no improvement). Within
this scenario, we also consider a more aggressive deterioration of Venezuelan output by 0.5 mb/d
(deterioration), exacerbated by the US financial sanctions that limit PDVSA’s oil operations.
Finally, we consider an extreme case which sees Venezuela’s total output collapse by 1.43 mb/d
similar to December 2002 when a series of strikes resulted in the country losing 80% of its total
production (collapse).
Figure 10 shows that the fall of either Libyan or Nigerian output would result in a modest increase in
the price of oil, keeping it at above $65/b at the end of 2018. On impact, a Libyan production shortfall
of 0.3 mb/d adds about $1.5/b to the real Brent price, while a Nigerian supply disruption close to 0.23
mb/d adds around $1/b. Taken together, according to our model the combined output losses of 0.54
mb/d from both Nigeria and Libya would cause an increase in the oil price relative to the baseline
forecast by more than $4/b, with the price trading close to $70/b before falling to $67/b at the end of
2018. The net impact of the combined output losses initially corresponds to $2/b, but after six months
gradually increases by an additional $1/b.
Figure 10: Libyan and Nigerian geopolitical supply disruption scenarios, in USD/b
Source: Constructed by the authors
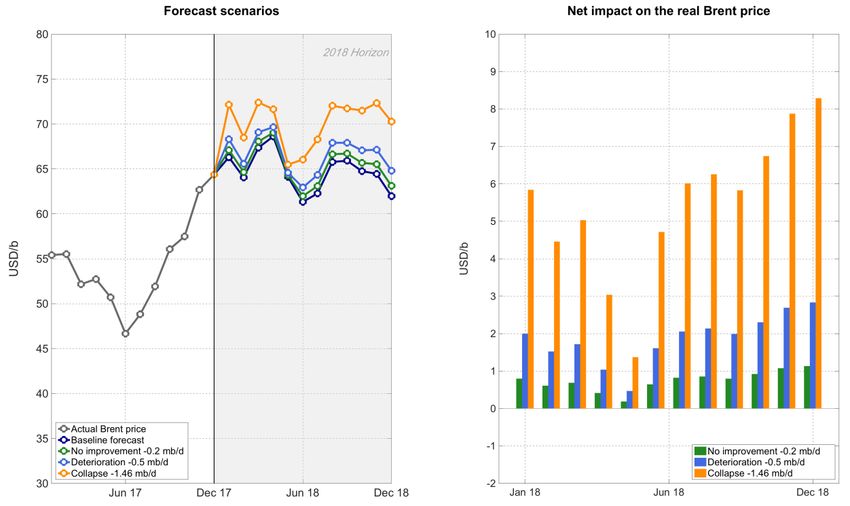
The geopolitical context associated with Venezuela is not only more uncertain than the cases of Libya
and Nigeria, but it also has far more severe price implications for the baseline forecast. As shown in
Figure 11, if Venezuela’s output losses follow a similar momentum to 2017 declining by 0.2 mb/d, the
impact on the oil price will be fairly minimal adding about $1/b to our baseline forecast. The
acceleration of Venezuela’s losses to 0.5 mb/d would result in a marginal increase in the oil price, with
prices trading at around $67/b before falling to $65/b at the end of the year; that is $3/b above the
baseline forecast. In the case of oil production collapse by 1.43 mb/d similar to December 2002,
however, the real oil price would jump by $6/b on impact, to $73/b, and trade over $70/b for the entire
year. By comparison, in December 2002 the loss of 1.95 mb/d of Venezuelan output resulted to a
$5.5/b price increase on impact. These results imply that an unanticipated collapse of the Venezuelan
The contents of this paper are the authors’ sole responsibility. They do not necessarily represent the views of 14
the Oxford Institute for Energy Studies or any of its Members.output in 2018 constitutes the biggest geopolitical risk that could, ceteris paribus, push prices well
above the $70/b mark.
Figure 11: Venezuelan crisis scenarios, in USD/b
Source: Constructed by the authors
4. Oil price paths in 2018
Having considered a range of alternative forecast scenarios and their individual impact on the real
price of oil, we now combine these scenarios to assess the oil price path in 2018 based on three
principal cases: a reference case, a bearish case and a bullish case (see Table 2). The objective is to
identify various oil price risks lying ahead in 2018 and assess their true dynamic effects on the
baseline forecast.
Table 2: Set of key assumptions for the principal forecast scenarios
Assumptions Bearish Reference Bullish
OPEC/NOPEC Full withdrawn Gradual withdrawn Enforced for the
exit strategy as of July 2018 as of July 2018 entire 2018
US shale supply
+ 1.2 mb/d + 0.9 mb/d + 0.6 mb/d
response (year-end)
Growth of
+ 1.0% + 1.4% + 2.0%
global oil demand
Libya Max 2017: 1.01 mb/d Max 2017: 1.01 mb/d Jan 2017: 0.69 mb/d
Geopolitics Nigeria Max 2017: 1.67 mb/d Max 2017: 1.67 mb/d Jan 2017: 1.43 mb/d
Venezuela -0.2 mb/d -0.5 mb/d -0.5 mb/d
Source: Constructed by the authors
The contents of this paper are the authors’ sole responsibility. They do not necessarily represent the views of 15
the Oxford Institute for Energy Studies or any of its Members.In the reference case, we assume that the OPEC/NOPEC oil producers will embark on a gradual withdrawn of around 0.6 mb/d from the November 2016 output cut deal effective July 2018 (which can also be seen as OPEC/NOPEC compliance weakening in the second half of 2018); US shale production increasing at the moderate rate of 0.9 mb/d; annual oil demand growth keeping its momentum and growing at 1.4% year-on-year; and Libya and Nigeria maintaining their production at levels similar to 2017 while Venezuela suffering an additional 0.5 mb/d on top of the losses in 2017. As Figure 12 shows, in the reference case, the oil price oscillates within a $10/b range, between $64/b and $74/b, with a 2018 average price of $67/b, slightly higher than the baseline forecast of $65/b. The 2017 price momentum is carried forward to April 2018, with the monthly average price gaining another $10/b relative to December 2017, before correcting towards $65/b where it hovers for the remainder of the year. In the final fourth quarter of 2018, the oil price is expected to regain its lost momentum closing the year at $69/b, $5/b higher than a year before. It is worth stressing that the steeper deterioration of the Venezuelan output by 0.5 mb/d year-end is responsible for about $3/b out of the cumulative price increase at the end of 2018. On annual terms, if the decline in Venezuelan output in 2018 is kept at a level similar to 2017, the average price would be lower by $1/b to $66/b. Figure 12. Oil price paths in 2018, in USD/b Source: Constructed by the authors In the bearish scenario, we assume the OPEC/NOPEC deal is extended only to June 2018 with producers releasing the withheld crude back into the market (1.8 mb/d); US shale production surprising on the upside increasing by 1.2 mb/d; annual oil demand growth surprising to the downside increasing only by 1%; and Libya and Nigeria’s production maintaining their end 2017 levels, while Venezuela’s output falls by 0.2 mb/d similar to 2017. Under this scenario, the oil price remains relatively flat in the first quarter of 2018 before plunging towards $40/b at the end of the year. The 2018 average price falls to $54/b, $13/b lower than our reference case. This result highlights the The contents of this paper are the authors’ sole responsibility. They do not necessarily represent the views of 16 the Oxford Institute for Energy Studies or any of its Members.
importance of an orderly exit from the OPEC/NOPEC output cut deal, as well as the effectiveness of
the OPEC/NOPEC production adjustments in rebalancing the oil market and supporting prices.
Indicatively, results suggest that a complete exit from the deal and the disorderly release of the crude
currently held under the agreement back into the market will drag prices below November 2016 levels
($45/b), obliterating all price gains and balancing efforts achieved in 2017 within less than six months.
Considering that the OPEC/NOPEC output cutback in conjunction with the strong performance of
global demand have generated such an impressive growth momentum in 2017, even under our most
bearish assumptions, the price forecast in the first quarter of 2018 persists close to $65/b before
collapsing.
In the bullish scenario, we assume the OPEC/NOPEC deal is extended to the end of 2018 with all
parties fully complying to the deal; US shale production surprising on the downside and increasing
only by 0.6 mb/d year-end; annual oil demand surprising to the upside and growing by 2%; and Libya
and Nigeria’s production falling to January 2017 levels (a combined decline of 0.54 mb/d), while
Venezuela’s output falling by 0.5 mb/d. Under this scenario, the oil price will follow an explosive
trajectory in the first quarter of 2018 breaking the $80/b threshold by April, where it remains for the
remainder of the year. In the second half of 2018, the oil price gains another $5/b and closes the year
near $85/b. The 2018 average price climbs at $81/b, $14/b above the reference annual average.
These findings are suggestive of a ceiling on top of the price of oil in 2018 close to $85/b. Beyond
that, only the detrimental collapse of the Venezuelan output by 1.43 mb/d, or an equivalent
geopolitical supply disruption, can push the oil price beyond $90/b. Indicatively, our model projects
that in such an extreme event the oil price would peak at $98/b and average at $91/b for 2018,
conditional on all the other assumptions under the bullish scenario.
Lastly, we assess the evolution of the OECD oil stocks held by industry in 2018 under each
alternative scenario. The usefulness of this task is twofold. First, it is by now well recognised that
inventory levels provide useful insights into the oil supply-demand balance, especially as compared to
their five-year average. Second, and most importantly, for OPEC to consider exiting its current output
cutback strategy the market must balance, which requires excess OECD and non-OECD oil
inventories to fall down to normal levels as indicated by their five-year average, though the Saudi
Energy Minister has recently called ‘to define the real target more precisely’.15
Figure 14 shows that under the reference scenario the significant decline of OECD oil inventories of
about 110 mb experienced in 2017, continues well into 2018 with OECD oil stocks falling below the
five-year average in the second quarter of 2018, where they remain for the remainder of the year and
only slightly recover in December. This result underscores that the market rebalancing is underway
and it could be reached without big surprises, much sooner than currently expected by the market
observers. Under the bearish scenario, the current downward trajectory of OECD oil stocks reverses
within the first quarter of 2018 and by the end of the year, stock levels stand at 101 mb above the five-
year average. This evidence further supports our findings that non-favourable market conditions in
2018 will be detrimental for the OPEC/NOPEC output cut deal, and in turn to the rebalancing of the oil
market. This observation also strengthens our view that a disorderly and complete exit out of the
OPEC/NOPEC deal is highly improbable. Under the bullish scenario, OECD oil stocks fall below the
five-year average one quarter sooner than the reference case and continue to decline for the
remainder of the year to their lowest level since January 2015. The balance ending 2018 would match
that of December 2017 taking into account a draw by 119 mb.

15
     See Bloomberg, Saudi Oil Minister Says Cuts to Stay Until Market Balanced, 4 December 2017.

The contents of this paper are the authors’ sole responsibility. They do not necessarily represent the views of   17
the Oxford Institute for Energy Studies or any of its Members.
Figure 13. Projected OECD oil stock changes in 2018 under alternative scenario, in mb Source: Constructed by the authors 5. Conclusions Looking ahead into 2018, our reference forecast scenario projects for Brent to trade within a narrow price range, with a price floor at above $60/b and a ceiling of slightly below the mid $70/b, with a 2018 average price of $67/b. The oil price decomposition for 2017 shows that higher OPEC/NOPEC compliance in the second half of 2017 (adding $3/b) amid a very strong third quarter of global economic activity in advanced and emerging economies combined (adding $12/b) reversed the price declines of the first half and were responsible for the major gains in the price of Brent in the second The contents of this paper are the authors’ sole responsibility. They do not necessarily represent the views of 18 the Oxford Institute for Energy Studies or any of its Members.
half of 2017. Indeed, the baseline forecast suggests that the momentum of stronger than expected oil
demand and the OPEC/NOPEC output cuts in 2017 have tightened the oil market insofar, and even
with no change in current market dynamics, the oil price will continue to be supported at around
$65/b. Our results show that for 2018, US shale output growth will be the key factor capping the oil
price, while supply disruptions could provide some support to the oil price, with a sharp fall in
Venezuelan output constituting the biggest geopolitical risk that could push prices well above our
baseline or reference forecasts. The results also show the paramount importance of carrying the
strong oil demand momentum experienced in 2017 into 2018 for rebalancing the market and
supporting the oil price. Finally, our results show that maintaining the recent price gains requires that
OPEC/NOPEC extend their output cut until the end of 2018; releasing the withheld barrels under the
current agreement into the market would result in a sharp fall in the oil prices, suggesting that unless
there is a large output disruption, OPEC/NOPEC should be cautious about unwinding the output cut
agreement when they next meet in June 2018.

The contents of this paper are the authors’ sole responsibility. They do not necessarily represent the views of   19
the Oxford Institute for Energy Studies or any of its Members.
Appendix
Figure A1. Structural impulse responses of the model variables to each of the structural
shocks

Source: Constructed by the authors
Notes: The red area indicates the corresponding pointwise 68% posterior error bands. All responses but the
inventory responses are expressed in percentages. The inventory responses are in million barrels. All structural
shocks have been normalised such that they imply an increase in the real price of oil.

The contents of this paper are the authors’ sole responsibility. They do not necessarily represent the views of    20
the Oxford Institute for Energy Studies or any of its Members.
You can also read


