New Car CO2 Report 2014 - The 13th report - THE SOCIETY OF MOTOR MANUFACTURERS AND TRADERS LIMITED
←
→
Page content transcription
If your browser does not render page correctly, please read the page content below

New Car CO2 Report 2014
The 13th report

                                     THE SOCIETY OF
                             MOTOR MANUFACTURERS
                               AND TRADERS LIMITED
                            SMMT, the ‘S’ symbol and the ‘Driving the motor
                          industry’ brandline are trademarks of SMMT Ltd.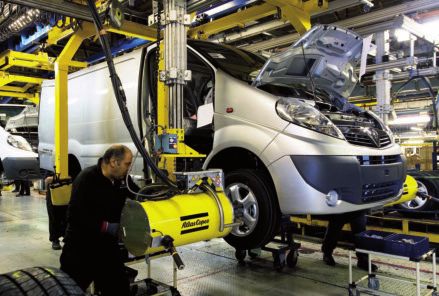
INTRODUCTION
The UK new car market saw sales-weighted                 Contents
average CO2 emissions fall 3.6% to 128.3g/km in
2013. This was the first time emissions fell below       3    Summary
130g/km, an important milestone as it marks              4    Drivers of change
the achievement of the pan-European 2012-2015            5    Average new car CO2 emissions
target. It was also encouraging to see that the          6    Market distribution
3.6% rate of reduction matched that of 2012 and          7    Performance by fuel type
continued the impressive trend in performance            8    Performance by segment and by sales type
improvement evident since 2008. The                      9	UK performance vs EU and UK
performance was the result of huge investment                 manufacturers’ performance
in advanced low CO2-emitting technologies by             10   Level of ambition
industry and was also influenced by consumers’           11   Outlook for alternatively-fuelled vehicles
increasing prioritisation of improved fuel               12   Total CO2 emissions from all cars in use
efficiency in their purchasing decisions.                13	Role of government
2013 also saw the registration of record numbers         14 	Light Commercial Vehicle (van) CO2
of alternatively-fuelled cars. While petrol and          15   Summary data
diesel models are becoming more fuel-efficient, in
the longer-term the switch to alternatively-fuelled
vehicles will be necessary to achieve increasingly
challenging CO2 targets. Those targets are now
set at a European level to 2020, with a one-year
phase-in, and discussions will begin shortly on the
definition of longer-term targets.
Environmental regulations, motoring taxation
and consumer information will play an important
role in enabling industry to deliver even more
efficient models and encouraging consumers to
adopt them. SMMT welcomes the government’s
ongoing support to accelerate the uptake of ultra-
low emitting models, with an additional £500
million investment secured to support market
transformation between 2015 and 2020. The
recently-launched ‘Go Ultra-low’ campaign (see           Key:
www.goultralow.com) shows how government
and industry are working together to promote             Notes: Sources – all data is SMMT unless
the advantages of ultra-low emission vehicles              AFV alternatively-fuelled vehicle
and educate consumers about the feasibility and            CO2	carbon dioxide
benefits of adjusting their purchasing decisions to        g/km grammes per kilometre
consider such vehicles.                                    Mn    million
The Automotive Sector Strategy, published in               mpg miles per gallon
2013, is designed to enable the UK automotive              MtCO2 million tonnes of CO2
sector to support the development, production              t     tonnes
and market for lower-emitting vehicles and                 ULEV	ultra-low emitting vehicle
ensure that the UK’s industrial and economic                     (up to 75g/km CO2).
ambitions are aligned with its environmental
aspirations.
This, the 13th New Car CO2 Report, provides the          otherwise stated.
latest annual update of the UK’s performance             SMMT CO2 data is collated by SMMT’s Motor Vehicle
and outlines some key market changes that                Registration Information Systems (MVRIS) and links the
                                                         vehicle’s CO2 levels to the MVRIS new registrations database
have helped to deliver this continuing progress.
                                                         to create sales-weighted figures. The CO2 data is sourced from
For more detailed findings and regular updates,          manufacturers’ own CO2 figures (as supplied on the vehicle’s
see www.smmt.co.uk/co2report. SMMT plans to              first registration document) and checked with type approval
publish a series of reports in 2014 documenting          data from the Vehicle Certification Agency (VCA).
additional aspects related to the UK automotive
sector’s environmental performance.

Page 2 | New Car CO2 Report                           THE SOCIETY OF MOTOR MANUFACTURERS AND TRADERS
SUMMARY
• Average UK new car CO2                     Average UK new car CO2 emissions
  emissions fell for 16th
  successive year to                                                                                   2007
  128.3g/km in 2013                                                                                    2013

• Advances in new car efficiency                                                                       2020
                                                                                                      EU TARGET
  enabling emissions from all
  cars in use to fall, despite
                                                                                                     95g/km
  increased number of cars in use
  and distance travelled.                                                                           128.3 g/km
                                                                                                    164.9 g/km
• Industry has challenging targets
  to deliver a 45% reduction by
  2020 on 2007 and will require
  greater market take-up of ultra-                                                        164.9g/km                        128.3g/km
                                                                                            in 2007
                                                                                                           -22%              in 2013
  low emitting vehicles to meet
  those targets.

 A new car is some 20% lower CO2                                                        Total CO2 emissions from all
 emitting than the average car in use,                                                  cars in use cut by 15.1%
 which at 7.7 years old had                                                             between 2012 vs 2000
 CO2 emissions of 160.2g/km.

  Average car in use                  New car                                             75.0MtCO2                        63.7MtCO2
                         -20%                                                                              -15%
     160.2g/km                       128.3g/km                                               2000                             2012

Reasons for further improvement                                  Outlook for CO2 emissions
in average new car CO2 emissions                                 • Further gains expected as manufacturers
in 2013                                                            continue to develop and introduce lower
                                                                   CO2-emitting models to meet tougher
• Technology – enhanced technologies                               environmental regulations and consumer
  delivered across manufacturers’ model                            demands for more efficient cars.
  ranges, especially new drive trains (including
  introduction of more alternatively-fuelled cars).             • EU has toughest new car CO2 regulations
                                                                  in the world, with a 27% improvement
• Market shift – consumer preference for                          required between 2015 and 2020 to
  lower CO2 emitting models strengthened by                       95g/km across the EU.
  challenging economic conditions and desire to
  reduce running costs. Improved mpg = lower
  CO2 emissions. Fuel economy has improved by
                                                                 Chart 1 UK new car CO2 emissions
  42% since 2000.                                                and EU targets
                                                      Sales weighted average CO2 g/km

• New Car CO2 Regulation and other legislation                                          190
  encourage lower CO2 emitting cars.                                                                   UK average             EU targets
                                                                                        180
                                                                                        170
• CO2-based taxes and enhanced information                                              160
  also drives move to more efficient cars.                                              150
• Introduction of fiscal incentives, such as                                            140
                                                                                                                                130g/km
  Plug-In Car Grant, have encouraged up-take                                            130
                                                                                                                                 by 2015
  of ultra-low emitting vehicles.                                                       120
                                                                                        110
                                                                                                                                 95g/km
                                                                                        100                                      by 2020
                                                                                         90
                                                                                              00 02 04 06 08 10 12 14 16 18 20
                                                                                                             Year

THE SOCIETY OF MOTOR MANUFACTURERS AND TRADERS                                                                    New Car CO2 Report | Page 3
DRIVERS OF CHANGE
The Integrated Approach: Industry is committed to improving further the efficiency of its products, but
to deliver a reduction in CO2 emissions in the most cost-effective manner requires the participation of
all stakeholders moving in a common direction. This is the Integrated Approach – which sees industry,
government, regulators, consumers and other stakeholders working together to deliver lower CO2-
emitting cars. How these stakeholders are influencing and can further influence, the shift to more
efficient cars is summarised below. Of particular note is the EU New Car CO2 Regulation and consumer
demand. These have both encouraged industry to bring lower emitting cars to market, which is
highlighted by showing variants available at certain bands in SMMT’s new car CO2 database.

                                                                                 Note: some factors might move
    Industry          Government        Consumers               Other            against CO2 performance, for
  eg developing,        eg setting        eg buying           eg media and       example economic growth and
  delivering and       regulations        a new car,            other key        higher disposable incomes might
 marketing lower     and standards,     accepting new         stakeholders       encourage consumers to go for a
   CO2 emitting       taxes, public     technologies,          influencing       higher-specified and potentially
       cars            information    embracing need             industry,       higher CO2 emitting car.
                         and fleet     for change and       consumer choice
                      procurement        affordability         and policy-       Sometimes delivering
                          policy                                  makers         improvements in one area of
                                                                                 performance may adversely
                                                                                 impact on CO2, eg adding safety
                                                                                 and greater pedestrian protection
                                                                                 features might add weight or
                                                                                 reduce aerodynamic efficiency, so
                                                                                 curbing CO2 performance.
                    Lower CO2 emitting vehicles

EU New Car CO2 Regulation                                Consumer demand
Regulation 443/2009 sets a pan-European sales-           Consumers primarily look at cost and
weighted average new car CO2 emissions target of         functionality when deciding which car to
130g/km by 2015 and 95g/km by 2020 – the latter          purchase. Running costs are an important
representing a 45% reduction since 2007.                 consideration, especially as a result of the
Post 2020 targets are yet to be agreed.                  recession and the squeeze on incomes,
                                                         and increased fuel costs.
Manufacturers face their own specific emissions
target, which includes a weight-based element            With CO2-based vehicle taxation and fuel prices
to reflect the different composition of product          rising by over 70% since 2000 (and more than 40%
offerings. Derogations can be made for lower-            since 2007), the efficiency and CO2 performance of
volume manufacturers.                                    the vehicle is in sharp focus.
Those manufacturers missing targets face                 Consumer demand, reflected by SMMT
penalties of up to 95 per g/km CO2 over                  registrations data, shows the shift to lower
target, per car registered.                              CO2-emitting vehicles. Advances in technology
                                                         and fuel switching have allowed consumers
The targets are phased in – eg 75% of the
                                                         broadly to maintain their vehicle choices.
fleet must meet the 2015 target in 2013, and
                                                         Steeper future emissions reductions may lead
manufacturers can also use super-credits and
                                                         consumers to make more radical purchasing
eco-innovations to meet their targets.
                                                         decisions regarding vehicle type, drivetrain and
                                                         performance characteristics.

 Increased choice of lower CO2-emitting variants - number of variants,
 at selected CO2 breakpoints, in SMMT’s new car registrations CO2 database

         CO2 (at or below)                     2000                           2007                         2013
                   75g/km                           0                            4                             27
                   130g/km                         70                          482                         3,183
                   200g/km                     3,175                          4,788                        7,406
                     Total                     5,933                          7,208                        7,989

Page 4 | New Car CO2 Report                        THE SOCIETY OF MOTOR MANUFACTURERS AND TRADERS
AVERAGE NEW CAR CO2 EMISSIONS
UK sales-weighted average new car CO2 emissions fell to 128.3g/km in 2013. This was a 3.6%
reduction on 2012 and a 29.1% reduction on 2000. While data is available from 1997, only 80%
of the market then had a CO2 value. This rose to 100% in 2000 and therefore this report looks
at CO2 performance from 2000 to 2013.
Chart 2 UK new car CO2 emissions, 1997 – 2013
200
189.8
180
188.4
185.0
181.0
177.6
174.2
172.1
171.4
169.4
160
CO2 g/km
167.2
164.9
158.0
149.5
140
144.2
138.1
133.1
120
128.3
200
189.8
100
188.4
180
97 98 99 00 01 02 03 04 05 06 07 08 09 10 11 12 13
185.0
181.0
177.6
Year
174.2
172.1
171.4
169.4
167.2
160
CO2 g/km
164.9
Since 2008, the market has averaged a 4.1% differentiated CO2-based vehicle taxation regime
158.0
annual reduction in CO2 emissions, compared with (eg VED), and increased awareness of vehicles’
149.5
a 1.4% average improvement between
140 2000 and CO2 emissions as a result of enhanced marketing
144.2
2007. The enhanced rate of progress reflects the and the new car fuel efficiency label.
138.1
133.1
impact of a combination of factors. These include
128.3
120
the introduction of lower-emitting models in The rate of progress in 2009 and 2010 was also
response to the 2009 EU New Car CO2 Regulation enhanced by the Scrappage Incentive Scheme.
and, prior to that, the European100manufacturers’ This fiscal incentive helped replace old cars with
97 98 99 00 01 02 03 04 05 06 07 08 09 10 11 12 13
voluntary commitment. new more efficient models, most notably with
Year
Mini and Supermini segment cars, helping reduce
Consumers have also become more concerned both total CO2 emissions and the new car market
with vehicle efficiency post-recession in response average CO2 emissions.
to factors such as rising fuel costs, a more
Chart 3 UK new car average CO2 performance and mpg
MPG (left hand axis) CO2 g/km (right hand axis)
190
65
180
60
170
55
CO2 g/km
160
50
MPG
150
45
140
40
130
35
120
30
00 01 02 03 04 05 06 07 08 09 10 11 12 13
Year
THE SOCIETY OF MOTOR MANUFACTURERS AND TRADERS New Car CO2 Report | Page 5
133
                                                                                                                                                                            1

                                                                                                                                                                                       128.3
                                                       120

                                                       100
                                                             97    98   99                        00     01    02     03    04     05     06      07        08   09    10   11   12    13

              MARKET DISTRIBUTION                                                                                                Year

/km (right hand axis)
              The UK market is shifting to lower CO2-emitting cars. In 2013 63.3% of new car registrations met the
              EU’s 2015 CO2 target of 130g/km and so were not liable for VED in year one. In addition, 3.3% of the UK
              market is now below the EU’s 2020 target of 95g/km

              • Chart 4 shows: Market has moved into                    Chart 4 New car market by selected
                               CO2 g/km

                sub-130g/km cars, with step change in                   CO2 bands           VED Band (CO2 values) –
                pace post 2007. We also see the increased                                                                          1st year/standard VED rate
          2013
                emerge of 95g/km and below cars and the                                                                                 A (Up to 100) - £0/£0
                erosion in volumes of cars emitting CO2                                           3.0                         VED Band (CO2 values) –
                                                                                                                                      B (101-110) - £0/£20
              2013
                over 200g/km.                                                                                 201+         131-200          96-130
                                                                                                                              1st year/standard VED rate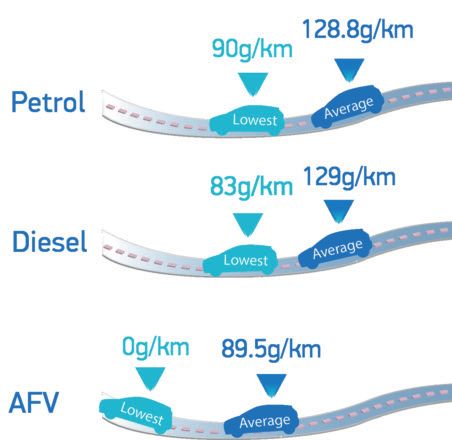
65 190
60 180
55 170
PERFORMANCE BY FUEL TYPE
CO2 g/km
50 160
45 150
Petrol and diesel cars still account for 99% of CO2 of different fuel types –
40 total market by volume. Diesel cars are lower average140and lowest
CO2-emitting on a like-for-like basis than petrol,
35 but on a sales-weighted basis they have virtually 130
Year
the same CO2 emissions due to the market mix.
30 120
‘00 ‘01 Alternatively-fuelled
‘02 ‘03 ‘04 ‘05 ‘06 vehicles
‘07 (AFV)
‘08 are
‘09 on‘10
average
‘11 ‘12 ‘13
30% lower CO2-emitting than petrol/diesel cars.
Diesels achieved a record volume in registrations
in 2013, but their market share slipped. AFV
volumes and share continued to rise in 2013.
Chart 6 New car market by fuel type
AFV Petrol
Diesel AFV share
3.0 1.6%
New car registrations - millions
1.4%
2.5
1.2%
2.0
Increased AFV registrations have been fuelled by
AFV market share
1.0% the introduction of new models, as shown in chart 7.
1.5 0.8% Pure electric cars offer zero tailpipe emissions. In
0.6% 2013 there were 12 pure electric vehicle models in
1.0 SMMT’s registration database, this was more than
0.4% double the number in 2010.
0.5
0.2%
The lowest CO2-emitting diesel and petrol models
0.0 0.0% have emissions broadly equivalent to the average
00 01 02 03 04 05 06 07 08 09 10 11 12 13 AFVs, at 83g/km and 90g/km respectively.
Chart 7 Number of AFV models available Table 1 Top 20 lowest CO2
emitting models in 2013
47 Range Fuel CO2 g/
Petrol-electric hybrid type km
Diesel-electric hybrid
Pure electric
AFV MW i3 - Citroën C-Zero - Ford
B
Focus – Mia - Mitsubishi i - Nissan
Other plug-in vehicle
Other (e.g. alcohol and LPG)
MODELS 1= LEAF - Peugeot Ion - Renault EV 0
5 1 Fluence and Zoe - smart for two
coupe/cabrio – VW e-Up!
21
12 BMW i3 PHEV 13
18 AFV 12 13
14
Vauxhall Ampera
Chevrolet Volt
PHEV
PHEV
27
27
AFV MODELS 15 Volvo V60 PHEV 48
MODELS
6 16 Toyota Prius Plug-in PHEV 49
11 24
17 Porsche Panamera PHEV 71
11
5 18 Toyota Yaris HEV 79
5 10 19 Renault Clio D 83
5
20 Hyundai i20 D 84
2
EV – electric vehicle, PHEV – plug-in hybrid EV and range extender
HEV – hybrid EV and D – diesel
2007 2010 2013
THE SOCIETY OF MOTOR MANUFACTURERS AND TRADERS New Car CO2 Report | Page 7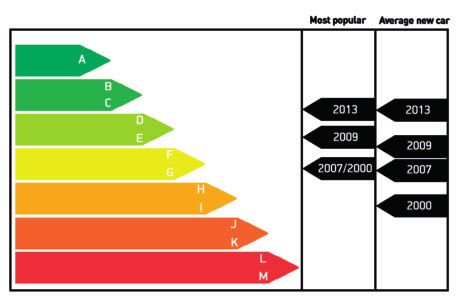
1.0%
AFV market sh
0.8%
0.6%
PERFORMANCE
0.4%
BY SEGMENT
0.2%
0.0%
SMMT splits the market into different segments, Chart 8 CO2 emissions by segment,
'08
'09
'10
'11
'13
'12
related to a car’s size and functionality, eg
2000-2013
body style.
All segments have seen improvements in CO 2 2000
2000 2007
2007 2013
2013
emissions over time, see chart 8. The biggest 300
300 “2000”
“2000”
reduction has come in the Luxury segment,
250
250 “2007”
where dieselisation has helped reduce “2007”
emissions. Dieselisation, as well as increased 200
200 “2013”
“2013”
market diversification, has also helped reduce
g\km
CO2 2g\km
average CO 2 emissions in the Dual Purpose and 150
150
MPV segments. 100
CO
100
The Dual Purpose and MPV segments have seen 50
some of the strongest growth in registrations, as 50
evident in chart 9. 00
um
LuLu ee
ecec m
ee
Pl uPu tsts
LoLo upup inini i
M nni i
DuD S Sp y y
ll
PPVV
tata
iv v
r M ium
ExEx iuim
osos
rr
The Mini, Supermini and Lower Medium
aul a poror
u
er i i
xuxu
uut ti
wew eremrm
S S MM
ToTo
pepe ededi
MM
rprp
eded
segment cars have the lowest average new car
UpUp r M
rM
CO 2 emissions. These sectors account for 65%
of the market, and in the case of the small car
(Mini and Supermini) market have seen strong
growth, contributing to the overall reduction in Chart 9 Registrations by segment,
CO 2 emissions. 2000 - 2013
2000 2012 2013
PERFORMANCE BY 900
Registrations, thousands
800
SALES TYPE 700
600
500
Average new car CO 2 emissions of private 400
and fleet registered cars are very similar, as
300
shown in chart 10. Private buyers tend to buy
200
small – Mini and Supermini segment, petrol-
fuelled cars - while fleets buy predominantly 100
diesel-powered cars, reflecting their different 0
motoring requirements.
rM m
ive
Ex ium
e
Pu rts
Lo up ini
Up Me ni
ry
PV
os
i
pe diu
xu
S M
we erm
ut
o
M
rp
ed
Du Sp
Lu
ec
The overall new car market grew by 10.8%
r
al
in 2013 to 2.265 million units, supported by a
15.6% rise in private registrations. As consumer
confidence has improved, buyers have been Chart 10 New car CO2 by sales type
attracted back into the market. Excellent
financial deals and enhanced product 180
substance also helped to boost sales. Private
All company
170
160
CO2 g/km
150
140
130
120
01 03 05 07 09 11 13
Year
Page 8 | New Car CO2 Report THE SOCIETY OF MOTOR MANUFACTURERS AND TRADERSUK
180
PERFORMANCE
PrivateVS EU
170 All company
Average new car CO2 emissions in the UK have
160
Chart 11 UK and EU new car CO2
CO2 g/km
fallen faster than in the EU27. performance (Source EC)
150 190
Average new car CO2 emissions in the EU were
132.2g/km in 2012. In the UK, at 133.1g/km, they UK EU27
140 180
were just 0.5% higher, compared with a 3.8%
difference
130 in 2007 and 7.7% difference in 2000.
170
The gap has narrowed reflecting the product
CO2 g/km
120 160
offerings in the markets being similar, but also
'01 '03 '05 '07 '09 '11 '13
as diesel share in the UK has risen to be closer
Year 150
to that in Europe – see chart 12. Diesel duty is
lower in Europe, compared with petrol fuel,
see chart 13, providing a greater fiscal 140
incentive to drive diesel.
130
Denmark and Portugal had the lowest emissions,
both below 120g/km, while Germany, the EU’s 120
largest market, had the highest at 141.5g/km. 01 03 05 07 09 11 13
Year
Chart 12 Diesel share UK and EU15 Chart 13 Diesel duty UK and EU15
(Source ACEA) (Jan 14) (Source The AA)
EU 15 UK Petrol Diesel
60% 800
Fuel duty rates /1,000 litres
700
50%
600
40%
Diesel share %
500
30% 400
300
20%
200
10% 100
0% 0
UK EU15
00 02 04 06 08 10 12
Year
UK MANUFACTURERS’ CO2 EMISSIONS
The UK new car market and production figures engines per annum, including new generations
have been a bright spot in an otherwise subdued of highly fuel-efficient power units from BMW
EU landscape. The UK new car market grew, while and Ford, which are fitted to UK-built and
the overall EU market shrank. Car production EU-sourced models.
increased in the UK by 3.1% to over1.5 million
units, despite the weakness of the EU market – The sector is developing increasingly efficient
a key export destination for UK-built cars. vehicles and models, to ensure its products
meet market demand and remain attractive.
The UK is home to several class-leading CO2 Support from government through R&D funding
products, including the electric Nissan LEAF, in low emission technology, including recently
hybrid Toyota Auris and sub100g/km models announced plans for an Advanced Propulsion
such as the MINI, Honda Civic and Vauxhall Centre, is welcome. The sector is well positioned
Astra. Average CO2 emissions of UK-built cars to deliver future improvements, given its long
were above the UK market average, reflecting history of advanced engineering through
the composition of UK-based manufacturers and companies such as Jaguar Land Rover,
model types. The UK also makes over 2.5 million Lotus and McLaren.
THE SOCIETY OF MOTOR MANUFACTURERS AND TRADERS New Car CO2 Report | Page 9LEVEL OF AMBITION
The EU has a target to reduce greenhouse gas emissions (GHG) by 20% by 2020, compared to 1990,
and by 40% by 2030. The UK has legally binding targets to deliver an 80% reduction in GHG by 2050,
versus 1990 levels. To help deliver this target the UK has a series of legally-binding Carbon Budgets to
direct, monitor and assess progress. The Committee on Climate Change (CCC) advise government on
the carbon budgets.
The EU has the most stringent new car CO 2 emission targets in the world, to achieve 95g/km by
2020 (with a phase-in, 95% by 2020 and 100% of fleet by 2021), as shown by chart 14. Longer-term
targets for the period post 2020 are yet to be developed.
Chart 14 EU has the most stringent new car CO2 targets in the world (Source ICCT)
The automotive sector is committed to improving robust economic growth might see consumers
vehicle efficiency and is the largest industry forsake running costs for higher-specified
investor in R&D in Europe. Delivering on existing derivatives which emit more CO 2, conversely it
and future emissions targets will require across- could also enable them to afford new innovative
the-board improvements in powertrains, weight CO 2 saving technologies.
savings, aerodynamics and the efficiency of
ancillary devices and components.
Government’s Carbon Plan sets out a trajectory
Determining which powertrain technologies will to meet carbon budgets. The scenario sees
be the most appropriate and successful in the battery electric and plug-in cars taking a
future is difficult to predict, given their different 60% share of the market by 2030. This is very
characteristics and costs. Manufacturers, and ambitious and well above the rate most other
others, are developing a number of different commentators suggest (see outlook for AFVs
solutions. The massive investment required on next page for more detail). To achieve
to do this is leading to an increasing number decarbonisation of the fleet will also require
of collaborations amongst vehicle manufacturers, power to come from low carbon sources.
as well as with other suppliers.
Encouraging consumers to consider new Petrol and diesel cars are also making important
powertrains or different vehicle types (eg technological strides, and in addition the
downsizing) will also be challenging, especially Renewable Transport Fuels Obligation (RTFO) will
as more demanding cuts to CO 2 emissions are allow increased use of biofuels to contribute to
sought. Economic conditions and the relative CO2 savings. Currently around 3% of petrol-diesel
cost of cars will also play an important role in fuel is from biofuels and industry is developing
delivering such progress. There is concern that cars capable of running on higher blends.
Page 10 | New Car CO2 Report THE SOCIETY OF MOTOR MANUFACTURERS AND TRADERSOUTLOOK FOR ALTERNATIVELY - FUELLED VEHICLES
Petrol and diesel cars are still widely expected of AFV, as well as ease, speed and safety with
to represent the vast majority of the new car which they can be refuelled/recharged when
market by 2020 and further technical innovations compared with conventional petrol and diesel
in petrol & diesel cars will be introduced to cars. Other factors, such as developments in
deliver additional CO 2 savings. At the same time the wider economy, technology, transport,
the market will increasingly shift to alternatively- energy and the built-environment will also
fuelled vehicles (AFV). impact on the speed at which AFV become
more mainstream.
As shown earlier, the number of AFV in the
market has more than doubled since 2010, with Numerous studies and market take-up
the addition of new hybrid vehicles, pure electric forecasts/expectations have been published.
vehicles, range-extender variants and other The majority of these suggest the CCC expected
plug-in hybrids and new diesel-hybrid vehicles. rate of uptake is at the top end of the range. The
RAC Foundation’s 2013 report, Powering Ahead
Despite only representing a modest 1.4% share of (www.racfoundation.org), reviews 14 separate
the market, if AFV were not in the market place studies which suggest all hybrids could take
emissions would be around 0.5% higher. Given a 5-20% market share by 2020, with battery
the lower CO 2 emissions associated with AFV, electric and plug-in hybrids taking a possible a
increasing their share of the market can make 2-10% market share. ACEA, the European vehicle
them even more influential on the fleet average. manufacturers association expects a 2-8% share
over the next decade (by 2023) to be taken by
Forecasting the future pace of AFV up-take electrically-chargeable vehicles (www.acea.be).
is difficult, given the wide range of push-
pull factors at work in the market place. It is clear that industry is committed to delivering
These include uncertainty about the relative and improving the availability of AFV and Table
development and deployment cycles of 2 highlights some of the new products due.
competing technologies and the success with This demonstrates the wide range of emerging
which initial consumer purchasing reticence can technologies coming to market. At the same
be addressed. Long-term government support time, progress on petrol and diesel cars will
is a key factor in ensuring the stability of the continue. In 2014, several diesel cars with CO 2
market. Consumers will be strongly influenced emissions in the low 80g/km range will enter the
by the purchase price, running costs, incentives, market, such as Peugeot’s 308, and it is unlikely
residual values, performance and battery range to be long before sub-75g/km models are seen.
Table 2 Expected new AFV models due, all 2014 unless stated otherwise
(Source various)
Pure EV Other plug-in Hybrid Hydrogen
Citroën DS3 Electrum Audi A1 Audi A8 Hyundai ix35
Lexus IF-cc Audi A3 BYD Qin (15) Nissan Terra
Mercedes-Benz B-Class Audi A4 Infiniti Q50
Mercedes-Benz SLS AMG Audi Q7 Ferrari LaFerrari
Tesla Model S Bentley SUV (17) Ford C-Max
Tesla saloon (16) BMW i8 Honda Jazz Other
VW e-Golf Ford Mondeo Energi Honda Vezel VW Eco Up! (CNG)
Kia Soul Mercedes-Benz Series 500 Lexus CT200h VW Passat EcoFuel (CNG)
Renault Kangoo Maxi Mitsubishi Outlander Mazda3 Audi A3 (CNG)
Peugeot 2008 Hybrid Air
Mitsubishi Evo X (16) McLaren P1 (16) (Compressed Air)
Porsche 918 Range Rover Sport
VW Polo (15/16)
BMW X5 eDrive (15)
VW Golf GTE
THE SOCIETY OF MOTOR MANUFACTURERS AND TRADERS New Car CO2 Report | Page 11ROLE OF GOVERNMENT
Government and other policy makers form a key
part of the solution to increasing the take-up of
lower CO 2 -emitting vehicles. They can encourage
both supply and demand through appropriate
regulations and policy frameworks, fiscal
incentives, other incentives (eg free parking or
use of bus lanes), their own fleet procurement
and through public education. Industry would
welcome government setting long-term
strategies to enable better planning.
in place to assist industry and consumers alike
Regulations with better planning. The structure of Company
The UK government is part of the wider EU, car tax rates have been set out several years
which sets New Car CO 2 Regulations and in advance - which is very useful for planning,
also the Euro emission standards. These will whilst VED is adjusted on an annual basis. The
fundamentally shape the types of vehicle industry move to ever more efficient vehicles has eroded
brings to the market and also the timing of tax revenues and with the anticipated increased
their introduction. It is important that the UK prevalence of AFVs, the tax regime could be
maintains a strong and influencing voice in these subject to change. Industry is keen to engage
future decision-making processes. closely and as early as possible with government
in reviewing any future changes to motoring
Standards taxation.
A car’s CO 2 values are derived from rigorous
tests, undertaken under laboratory type Fiscal incentives
conditions to ensure reliably comparable figures The government, through its Office for Low
for different vehicles. The government is also a Emission Vehicles (OLEV) is funding the Plug-
contributor to the ongoing discussions to develop in Car Grant, providing 25% of the price of a
a replacement for the current emissions test qualifying ULEV (up to £5,000), infrastructure
procedure – the NEDC (New European Drive support and R&D support for the development of
Cycle) with the WLTP (Worldwide harmonised more efficient cars. These measures are highly
Light vehicle Test Procedure) in the coming valued by industry, especially given the emerging
years. The intention is to design the test to be nature of these markets. Industry has welcomed
more representative of ‘in use’ emissions. government’s commitment to support further
Euro standards, while not directly addressing market transformation with an additional £500
CO 2 emissions, also result in step changes in million package available for 2015-2020 and has
engine design. provided input into the current strategy review.
Information and education Own fleet/procurement
All new cars must have a new car fuel efficiency The government and its agencies are volume
colour-coded label at point of sale, to help buyers of new cars. Internal measures to
consumers identify the car’s CO 2 emissions. improve the efficiency of the government’s own
CO 2 data is also shown in advertising and fleets will support the overall drive to lower-
marketing material and in media reviews of new emitting vehicles and send out an important
cars. In the past, government has run advertising signal to other consumers. Government can
campaigns to encourage uptake of more efficient also influence other large-volume new car
vehicles or better driving standards – including buyers, such as Motability and leasing and
eco-driving to reduce emissions. In January rental companies, through policies and
2014, the ‘Go Ultra-Low’ campaign was launched regulations it introduces.
in association with the SMMT and 5 OEMs,
to encourage the take up of ULEVs Local government
(see www.goultralow.com). Local policy and regimes can also influence vehicle
choice, through measures such as CO2-based
Tax vehicle use restrictions (eg congestion charging
The government sets motor vehicle taxation or low-emission zones) and parking restrictions.
in the Budget Statement each year. Industry It is critical there is national co-ordination and
would like to see stable and clear tax regimes consistency to ensure market stability.
Page 12 | New Car CO2 Report THE SOCIETY OF MOTOR MANUFACTURERS AND TRADERS180
Private
TOTAL CO2 EMISSIONS FROM170ALL CARS IN USE
All company
160
CO2 g/km
Cars represented 13.4% of all CO 2 emissions in Chart 15 2012 UK CO2 emissions by
the UK in 2012, see chart 15. Emissions from all 150
cars in use fell by 1.3% in 2012 to 63.65 million
source (Source DECC)
tonnes CO 2, reports the Department for Energy 140
and Climate Change (DECC). This was a 15.1%
cut since 2000, almost 90% of which has been 130
40.7%
achieved since 2007.
120
This step change in performance reflects the 6.1%
'01 '03 '05 '07 '09 '11 '13
increased pace of progress in new car efficiency, 3.2% Year
15.5%
alongside the impact of recession on vehicle
use. Chart 16 shows how CO2 emissions from all 13.4%
cars in use have become largely decoupled from 13.4%
distance travelled (source Department
for Transport).
1.9%
15.5%
Driving style, vehicle maintenance and road
conditions also strongly influence total emissions. 3.4%
Cars Energy production Residential
SMMT’s parc database shows the average car LCVs Industry Other
in use emitted 160.2g/km in 2013. A new car Other road transport Other transport
was 19.9% more efficient, therefore offering
considerable environmental benefits as well as
lower fuel and tax bills for the consumer.
The average car in use saw emissions improve Chart 16 CO2 emissions from all cars in
by 2.3% in 2013 over 2012, as more efficient new use, and distance travelled (Source DfT)
cars replaced less efficient ones.
CO2 emissions Distance travelled
During the recession, the average age of the 110
car fleet increased. Reversing this trend and
speeding up the rate of replacement will deliver 105
lower CO 2 emissions from the parc.
100
2000 = 100
Life-cycle analysis 95
The majority of emissions are associated with 90
the vehicle’s use phase, but progress is being
85
made on all fronts. This balance will shift over
time, especially as new technologies emerge, 80
and an increased focus on ‘well-to-wheel’ CO2 00 02 04 06 08 10 12
calculations is expected. Year
Other emissions
Industry is committed to tackling all emissions,
not just CO2.
Department for Transport statistics show total
particulate matter from all cars in use has fallen
10% 5% by 35.8%, nitrogen oxides by 61.9% and carbon
85% in-use monoxide emissions by 81.6% between 2000
production recycling
and 2011.
Euro standards will see those emissions cut
further as Euro-6 standards become mandatory
in September 2015. Some cars registered in
2013 are already Euro-6 compliant.
THE SOCIETY OF MOTOR MANUFACTURERS AND TRADERS New Car CO2 Report | Page 13LIGHT COMMERCIAL VEHICLES (LCVS)
CO 2 emissions from LCVs (vans) fell by 1.2% in Average new LCV CO2 performance
2013 to 186.1g/km.
LCV manufacturers are delivering technological
improvements to vehicles, to help reduce CO 2
emissions. Minimising vehicle operating costs
will already be a key ambition of businesses. 188.7
g/km
199.2
For example, 99% of all LCVs are already
diesel-fuelled.
g/km 186.1
g/km
201 2012
LCVs are also functional vehicles bought 1
as a work tool, so vehicle type will play an
important role in the fleet’s overall average CO 2 2013
performance. Different CO 2 values by LCV type
are shown in chart 17. The market mix, and in
recent years the shift to higher-payload vans, will The importance of vehicle type is evident by all
have constrained the overall rate of progress in vans below two tonnes180
already meeting the 2020
Private
new LCV CO 2 performance. target. Manufacturers will have to deliver further All company
170
technological progress, and in 2014 a number
The increased use of LCVs resulted in rapid
of new, smaller, more efficient vans are due to
growth in total CO 2 emissions from the total 160
CO2 g/km
enter the market, such as the new Ford Transit
fleet.
300
Improvements in new vehicle efficiency
Connect and Transit Courier. The UK is also
have helped ensure emissions have not risen as 300 150
250 home to a number of LCV manufacturers, such
steeply as van use and the recent impact of the
as 250
Land Rover, MINI and
140 Vauxhall that are also
CO2 g/km
recession
200 is also evident (see chart 19).
CO2 g/km
developing
200 lower emitting models.
150
As for cars, there is a CO 2 Regulation for LCVs to 130
150
Government support through the Plug-In Van
meet
100 175g/km in 2014-17 and 147g/km in 2020. Grant
100 seeks to encourage uptake of AFVs,
Like cars there are phase-ins, derogations, 120
50 currently very low, with an
180 '01incentive of'05up to'07
20%'09 '11
super-credits and eco-innovations available to 50 '03
0 targets. off a sub 75g/km van’s list price (up to £8,000). Private
meet 0 Year All company
Light Vans Pick- Vans Vans Vans Vans 170
4x4 up to 2t ups 2-2.5t 2.5-2.8t 2.8-3.5t 3.5t Light Vans Pick- Vans Vans Vans Vans
utility 4x4 up to 2t ups 2-2.5t 2.5-2.8t 2.8-3.5t 3.5t
Chart 17 LCV CO2 emissions by type Chart 18 LCV registrations
utility
160 by vehicle
CO2 g/km
300 type
70,000 150
250 2012 2013 70,000
60,000 2012 2013
CO2 g/km
200 60,000 140
50,000
50,000
150
40,000 130
40,000
30,000
100
30,000 120
20,000
50
20,000 '01 '03 '05 '07 '09 '11
10,000
0 10,000 Year
0 Light Vans Pick- Vans Vans Vans Vans
4x4 upVans
Light to 2t ups
Pick- 2-2.5t
Vans 2.5-2.8t
Vans 2.8-3.5t
Vans 3.5t
Vans 0
utility
4x4 up to 2t ups 2-2.5t 2.5-2.8t 2.8-3.5t 3.5t Light Vans Pick- Vans Vans Vans Vans
utility 4x4 up to 2t ups 2-2.5t 2.5-2.8t 2.8-3.5t 3.5t
utility
Chart 19 LCVs total emissions and
70,000
distance travelled
2012 2013
60,000
50,000 CO2 Distance travelled
CO2 Distance travelled
135
40,000 135
130
30,000 130
125
20,000 125
2000 = 100
120
2000 = 100
10,000 120
115
0 115
110 Light Vans Pick- Vans Vans Vans Vans
4x4 up to 2t ups 2-2.5t 2.5-2.8t 2.8-3.5t 3.5t 110
105 utility
Year 105
100 Year
100
00 02 04 06 08 10 12
00 02 04 06 08 10 12
CO2 Distance travelled
Page
135 14 | New Car CO2 Report THE SOCIETY OF MOTOR MANUFACTURERS AND TRADERS
130
125SUMMARY DATA
Figures are CO2 g/km for cars, with registrations in thousands (shown in blue)
2000 2007 2012 2013 % change 2013 vs
2012 2000
Total 181.0 164.9 133.1 128.3 -3.6% -29.1%
2,222 2,404 2,045 2,265 10.8% 1.9%
Diesel 167.7 164.3 133.3 129.2 -3.1% -23.0%
313 967 1,039 1,127 8.5% 260.0%
Petrol 183.2 193.6 139.3 128.8 -7.5% -29.7%
Fuel type
1,908 1,420 978 1,105 12.9% -42.1%
AFV 127.3 127.0 101.2 95.5 -5.6% -25.0%
0 17 28 33 17.6% 9068.3%
Private 176.4 165.9 133.6 128.1 -4.1% -27.4%
1,212 1,046 929 1,075 15.6% -11.3%
Fleet 175.4 165.8 134.4 129.5 -3.7% -26.2%
Sales type
1,031 1,195 1,026 1,084 5.7% 5.1%
Business 195.0 164.2 132.0 127.2 -3.6% -34.8%
214 163 90 106 18.0% -50.6%
Mini 153.8 128.5 105.6 105.2 -0.4% -31.6%
52 22 65 80 23.9% 54.0%
Supermini 152.9 141.8 122.1 117.6 -3.7% -23.1%
689 771 743 813 9.4% 18.1%
Lower 175.3 158.6 126.6 121.2 -4.3% -30.9%
Medium
662 722 508 588 15.8% -11.1%
Upper
Medium 192.4 169.1 130.5 126.4 -3.1% -34.3%
477 386 238 208 -12.3% -56.3%
Segment Executive 235.6 192.6 144.5 140.8 -2.5% -40.2%
105 104 117 120 2.1% 14.5%
Luxury 292.3 273.8 213.4 198.7 -6.9% -32.0%
11 13 8 8 3.2% -26.8%
Sports 220.5 224.0 168.8 168.5 -0.2% -23.6%
67 66 46 48 3.1% -29.3%
Dual Purpose 259.4 228.3 175.4 166.6 -5.0% -35.8%
99 176 201 248 23.3% 150.0%
MPV 211.0 179.7 147.7 139.1 -5.8% -34.1%
60 144 118 151 28.1% 151.3%
0 0 0 1 3Key facts
2000 2007 2012 2013
Average new car CO2 emissions 181.0g/km 164.9g/km 133.1g/km 128.3g/km
% change on 2000 -8.9% -26.5% -29.1%
Share of market with CO2 emissions
Up to and including 95g/km 0.0% 0.0% 2.3% 3.3%
Up to and including 130g/km 0.9% 10.6% 55.4% 63.3%
Total new car market 2,221,647 2,404,707 2,044,609 2,264,737
Diesel share 14.1% 40.2% 50.8% 49.8%
Alternatively-fuelled car share 0.0% 0.7% 1.4% 1.4%
2000 2007 2011 2012
Total CO2 emissions from all cars in use 75.0MtCO2 73.7MtCO2 64.5MtCO2 63.7MtCO2
% change on 2000 -1.7% -14.0% -15.1%
THE SOCIETY OF MOTOR MANUFACTURERS AND TRADERS LIMITED
www.smmt.co.ukYou can also read