Influence and Optimization of Packet Loss on the Internet-Based Geographically Distributed Test Platform for Fuel Cell Electric Vehicle Powertrain ...
←
→
Page content transcription
If your browser does not render page correctly, please read the page content below
Received December 12, 2019, accepted January 10, 2020, date of publication January 20, 2020, date of current version January 31, 2020.
Digital Object Identifier 10.1109/ACCESS.2020.2968155
Influence and Optimization of Packet Loss on the
Internet-Based Geographically Distributed Test
Platform for Fuel Cell Electric Vehicle
Powertrain Systems
WENXU NIU 1 , KE SONG 2 , YONGQIAN ZHANG 2 , QIWEN XIAO 3,
MATTHIAS BEHRENDT 3 , ALBERT ALBERS 3 , AND TONG ZHANG 2
1 College of Engineering, Shanghai Polytechnic University, Shanghai 201209, China
2 School of Automotive Studies, Tongji University, Shanghai 201804, China
3 Institute of Product Engineering, Karlsruhe Institute of Technology, 76131 Karlsruhe, Germany
Corresponding author: Ke Song (ke_song@tongji.edu.cn)
This work was supported in part by the Shanghai Education Development Foundation through the Chenguang Program, in part by the
Shanghai Municipal Education Commission, in part by the Chinese Ministry of Science and Technology under the Project ‘‘Sino-German
Fuel Cell Vehicle International Cooperation (Demonstration and Application)’’, under Project 2017YFB0103101, in part by the Chinese
National Key Research and Development Program ‘‘Reference Implementation and Verification Platform of Reconfigurable Intelligent
Production System,’’ under Project 2017YFE0101400, and in part by the German Federal Ministry of Education and Research under the
project ‘‘Methods for Spatially Distributed Development of H2 Fuel Cell Vehicles in Cooperation with China (MorEH2),’’ under Project
16EMO0316.
ABSTRACT In view of recent developments in fuel cell electric vehicle powertrain systems, Internet-based
geographically distributed test platforms for fuel cell electric vehicle powertrain systems become a devel-
opment and validation trend. Due to the involvement of remote connection and the Internet, simulation with
connected models can suffer great uncertainty because of packet loss. Such a test platform, including packet
loss characteristics, was built using MATLAB/Simulink for use in this paper. The simulation analysis results
show that packet loss affects the stability of the whole test system. The impact on vehicle speed is mainly
concentrated in the later stage of simulation. Aiming at reducing the effect of packet loss caused by Internet,
a robust model predictive compensator was designed. Under this compensator, the stability of the system is
greatly improved compared to the system without a compensator.
INDEX TERMS Fuel cell electric vehicle, powertrain system, Internet-based distributed test platform, packet
loss, robust model prediction compensator.
I. INTRODUCTION the quality of the network directly affects the performance of
With the continuous development of computers, as well as test platforms.
network and communication technology, Internet technology In recent years, several research institutions and companies
has become an effective solution for meager linkage in the have studied Internet-distributed test platforms. It is known
development process. With the development of ‘‘Industry from the literature that the threshold for instability depends
4.0’’ and ‘‘Internet+,’’ distributed test systems based on wire- on the specific configuration of the system and the combined
less network Internet have become a hot topic in research effects of other QoS (quality of service) parameters, namely
and industrial fields [1], [2]. They have significant advantages delay, jitter and packet loss. Packet loss means that data of
in completing complex, remote, and wide-ranging measure- one or more data packets cannot reach the destination through
ment and control tasks. However, the quality of the operation the network. There are two reasons for packet loss: one is
depends on the quality of the data transmission. Therefore, because the transmission channel is shared by multiple nodes
in the system, and the network bandwidth is limited, and
the number of sensors and actuators that can access data
The associate editor coordinating the review of this manuscript and with the controller at a certain time is limited. When the
approving it for publication was Lei Wang. load is large, data collisions, network congestion, and node
This work is licensed under a Creative Commons Attribution 4.0 License. For more information, see http://creativecommons.org/licenses/by/4.0/
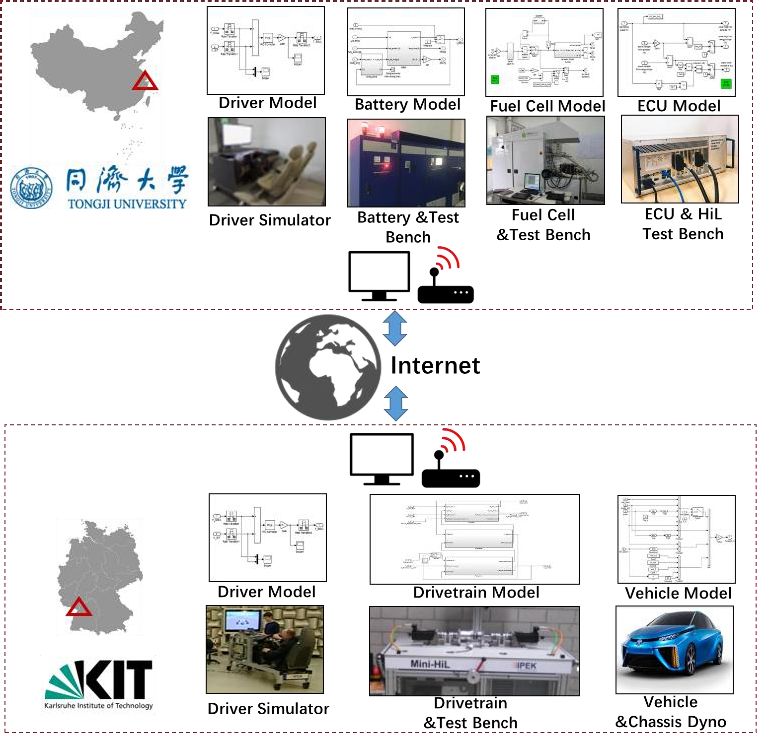
20708 VOLUME 8, 2020W. Niu et al.: Influence and Optimization of Packet Loss on the Internet-Based Geographically Distributed Test Platform failures often occur, and data collisions and node failures on the optimization of methods to prevent data packet will result in packet loss. The other is that in the real-time loss. control system, the system often discards the data packets that In general, the Internet based distributed test system is a have not arrived at a certain time, and then sends new data relatively new technology in the field of modern validation to ensure the timely update of the signals and the validity and testing. However, to achieve standardization and marke- of the sampled data. Schreiber et al. analyzed packet loss tization of the technology, analysis and optimization issues and delay in the existing network state [3]. Delay influences regarding Internet data packet loss on system stability are the stability of the system. The possibility of application of necessary. This paper presents a study of the data packet the distributed test platform is not optimized for stability. loss problem of distributed FCEV powertrain systems and Rahmani et al. studied a network-based hardware-in-the-loop carries out an analysis on the influence of data packet loss simulation control system, thus, a predictive control strategy on the stability of the system with an emphasis on system was carried out, but the authors found no other impact on optimization designed to minimize this problem. system stability [4]. Damo et al. developed a TPG (Total Peripherals Group) software for fuel cell software-in-the-loop II. SYSTEM MODELING technology [5]. Their research validated the feasibility of the Tongji University in Shanghai, China and Karlsruhe Institute distributed test system. The software for the platform was of Technology (KIT) in Karlsruhe, Germany jointly devel- developed, the impact of data loss on system stability was oped a distributed test platform for an FCEV powertrain not studied or optimized. system [12]–[14]. The objective was to remotely connect Walker et al. studied the data loss problem in remote the distributed platform’s developed environment and data operation of the Internet in the presence of delay [6]. The transfer capability between two computers—one in China at results showed that the fidelity of a remote system would Tongji University and the other in Germany at KIT. Since not be significantly affected when the packet-loss rate (PLR) we tried to compare the results from different connection was about 3%. Brudnak et al. [7] connected the motion-based settings, the test platform components of each developer simulator and hybrid powertrain system with the Inter- were placed on both sides of the virtual or physical model net employing a user diagram protocol (UDP), The PLR as a configuration requirement. The whole structure of this remained at a low 0.1%; thus, stability was less affected. distributed test platform is shown in Figure 1. In general, a higher PLR leads to a higher risk of instability. Borella et al. analyzed Internet packet loss statistics and found that most of the loss was due to bursts and consecutive losses [8]. As can be seen from the above literature, packet loss would degrade over time, which brought additional insta- bility risks. It also affects the real-time performance of Inter- net distributed systems. For optimization of data packet loss, Tang et al. inves- tigated the synthesis approach of output feedback model predictive control (OFMPC) for nonlinear systems over net- works where packet loss may occur simultaneously, a new technique for refreshing the estimation error bound, which plays the key role of guaranteeing the recursive feasibility of optimization problem [9]. Based on robust least-square approach, Wu et al carried out a parameter-dependent predic- tive controller and an iterative algorithm to solve the packet loss and uncertainty optimization problem for a networked robotic visual servoing system [10]. Ju et al. presents a dynamic optimization solution for the data packet-based com- munication of programmable logic controller (PLC) visual monitoring, and the objective is to improve the communi- cation efficiency between a supervisory computer and field FIGURE 1. Structure of the distributed test platform for FCEV powertrain PLCs in consideration of the network communication perfor- systems. mance, such as packet loss [11]. Existing research mainly focuses on delays in data According to the structure, the virtual models or hard- transmission of Internet based distributed test systems. The ware on both sides flexibly combined. Aimed at packet loss studies focus on data packet loss are not enough to solve research, on the Chinese side of the driver model, the electric stability problem of Internet based distributed test systems. control unit (ECU), battery and fuel cell models were chosen. Our research direction for the data packet loss problem While on the German side, the drivetrain and vehicle models is to assess the impact of packet loss. This paper focuses were chosen. VOLUME 8, 2020 20709
W. Niu et al.: Influence and Optimization of Packet Loss on the Internet-Based Geographically Distributed Test Platform
The vehicle model parameters are listed in Table 1. TABLE 3. Battery values.
TABLE 1. Vehicle parameters.
TABLE 4. Electric motor values.
Proton exchange membrane fuel cells (PEMFC) use
hydrogen and oxygen to generate electrical energy through
electrochemical reactions [15], [16]. The fuel cell’s work- The FCEV powertrain system mathematical model in the
ing mechanism cannot be described by a simple mathemat- time domain was carried out. While this system was a multi-
ical formula. The fuel cell subsystem’s complexity made input, multi-output and nonlinear system, after appropriate
its dynamic response worse and was adversely affected by simplification it was abstracted into a linear constant control
the surrounding work environment. A simplified model was system. Its system space state equation is as follows:
established with reference to the models of [17], [18]. Param-
eter identification and data fitting are common methods to ẋ = Ax + Bu
(1)
improve the accuracy of the simplified model and make its y = Cx + Du
applicability easier to understand. When the load current T
where state variables x = 1U Ub Im , input variables
changed, due to the charging effect, the fuel cell’s bipolar T T
plate surface produced a slowly changing voltage. The param- u = If Pmin , output variables y = Ubusls 0 , and the
eter values of the fuel cell model are shown in Table 2. coefficient matrix are expressed as:
1 Kf
TABLE 2. Fuel cell values. −
Tf 0 0 Tf 0
1 1
A= 0 ; B = − ;
0 0
C C
1 Km
0 0 − 0
Tm Tm
0 0
0 1 R
C= ; D = 0 0.
0 0 0
0 0
The battery made up for the lack of dynamic response of
the fuel cell and absorbed the energy of the brake [19]–[21].
Here a packaged ternary polymer lithium battery model was III. ANALYSIS OF THE IMPACT OF PACKET LOSS
used. Battery and fuel cell were connected in parallel, using A. NETWORK STATUS TEST
a power following strategy. In this paper, the analytic model In order to accurately understand the network status between
of the battery was used. Battery current and temperature were China and Germany, the network transmission status between
input, and the output was voltage and state-of-charge (SOC). Tongji and KIT was tested with the Collet Ping tool. The test
By stationary state the charging mode of our vehicle was results are shown in the Table 5.
a constant current-constant voltage (CC-CV) cycle. For this According to test results, the round-trip time of the data
battery model, the following assumptions are accepted: the packet varied due to the network load and was concentrated
internal resistance of the battery model is constant, that is, in 360 ms most of the time. The data PLR was below 5% in
the internal resistance value is kept constant during the charg- most cases.
ing and discharging of the battery, and is also independent of
the charge and discharge current; there is no memory effect B. PACKET LOSS MODEL BASED ON MARKOV RANDOM
in the battery. The parameter values of the battery are shown PROCESS
in Table 3. In order to build a packet loss model, the packet loss pro-
The electric motor model was a quasi-steady-state model. cess should be described. The random packet loss pro-
The electric motor values are shown in Table 4. cess is described as follows: Assume that the zero-order
20710 VOLUME 8, 2020W. Niu et al.: Influence and Optimization of Packet Loss on the Internet-Based Geographically Distributed Test Platform
TABLE 5. Sino-german network status test results. a Markov process, which is a discrete-time homogeneous
Markov chain in probability space, and its transition prob-
ability matrix is
Y
= (pij ) ∈ Rs×s (5)
For all i, j ∈ S
pij = P {η(ik+1 ) = j |η(ik = i) } ≥ 0 (6)
The Markov packet loss process was seen as a special case
of arbitrary packet loss.
Network packet loss is a random event. A random variable
X is set to represent the packet event.
X = 0 ‘‘no packet lost ’’
(7)
X = 1 ‘‘a packet lost ’’
P represents a probability from 0 state to 1 state, denoted
as P01 , Q represents a probability from 1 state to 0 state.
P(X = 1 |X = 0 )
The number of packet loss events
= (8)
The number of 0 state appears
P(X = 0 |X = 1 )
The number of packet loss events
= (9)
The number of 1 state appears
Here 1 − P represents P00 , i.e. P (X = 0|X = 0),
1 − Q represents P11 , i.e. P (X = 1|X = 1). The relationship
of these events is shown in Figure 2.
FIGURE 2. Markov loss probability function.
keeper successfully received the data packet at the time
Let P1 represent total packet loss rate (ulp). P11 is recorded
ik (k = 1, 2, · · ·), and 2 = {i1 , i2 , · · ·} is the sub-sequence
as clp. P0 represents the total average no packet loss rate. The
of {1, 2, 3, · · ·}, here ik indicated that the data packet arriving
calculation of each is given as:
at the zero-order keeper for the k time corresponds to the data
of the sampler time. The number of consecutive packet losses 1
P Q
between two successful transmissions can be calculated as: P0 = 1 1
− (10)
P + Q
P+Q
η(ik ) = ik+1 − ik , ik 2 (2) P
P1 = 1 − P0 = (11)
Maximum packet loss upper bound is P+Q
Q = 1 − clp (12)
s = max {η (ik )} = max {ik+1 − ik } (3) ulp(1 − clp)
ik ∈2 ik ∈2 P= (13)
1 − ulp
If ∀k ∈ Z+ , ik+1 − ik = 1, no packet loss happens. Let
i0 = 0 then The probability geometric distribution of continuous
∞
[ packet loss length K is
[ik , ik+1 ) = [0, ∞) (4)
P (Y = K )
k=0
= P(X = 1 |X = 1 )k−1 P(X = 0 |X = 1 )
The packet loss process is defined as Eq. (2) and met
η(ik ) ∈ S = {1, 2, · · · s}. If any data packet loss was random = clpk−1 (1 − clp)
and it took value in 2, this data packet loss process was = (1 − Q)k−1 Q (14)
VOLUME 8, 2020 20711W. Niu et al.: Influence and Optimization of Packet Loss on the Internet-Based Geographically Distributed Test Platform
The mathematical expectation of Y is
∞
X
E(Y ) = kP(Y = k)
k=0
X∞
= k · clpk−1 (1 − clp)
k=0
1
= (15)
Q FIGURE 4. Trend of vehicle speed at different data packet loss rates.
Based on the Markov random process and the network speed fluctuations occurred at both normal speed and high
quality test between the Chinese and German sides, the con- speed moments. In response to this phenomenon, it was
tinuous packet loss length and packet loss times are shown necessary to optimize the impact due to data packet loss.
in Table 6.
IV. OPTIMIZATION APPROACH WITH ROBUST MODEL
TABLE 6. Continuous packet loss length.
PREDICTIVE COMPENSATOR (RMPC)
A. DESIGN OF COMPENSATOR
In order to facilitate the study of the impact of data packet loss
on the stability of the FCEV powertrain system’s distributed
test platform, the platform was simplified to a network control
Therefore, the probability of packet loss can be calculated system based on an RMPC (robust model predictive control),
as shown in Table 7. where x and u were the input and output of the actuator,
As shown in Table 7, the PLR of the test period was 0.021, and xc , uc were the input and output of the controller. Since
and the correlation between packet loss events was not strong. the controller and the actuator were connected through the
The probability of occurrence for each packet loss event was Internet, in the process of data packet transmission, data
a random event. Continuous packet loss length was 1.499, packet loss occurred due to network congestion. The system
indicating that packet loss tended to single packet loss. state equation is
x (k + 1) = A (δ (k)) x (k) + Bu (k)
TABLE 7. Packet loss parameter value. (16)
y (k) = Cx (k)
Here δ (k) is the system uncertainty parameter
n T o
δ (k) ∈ 1 , δ = δ1 , · · · , δg : δj ∈ aj , bj
(17)
The system uncertainty matrix satisfies the following form
C. POWERTRAIN SYSTEM SIMULATION WITH PACKET
LOSS L
X
According to the actual measurement of network status A (δ (k)) = λj (δ (k)) Aj (18)
results between China and Germany, especially the packet j=1
loss status, the performance of the distributed test platform L
λj (δ (k)) = 1, λj (δ (k)) ≥ 0, j = 1, · · · , L
P
was analyzed. As shown in Figures 3-4, the simulation results Here,
j=1
clearly reflect the impact of data packet loss on output speed. which requires that we set the following to express data loss:
The trends show that the impact of data packet loss on
x (k)
vehicle speed was mainly concentrated in the high speed and no data loss
xc = (19)
ultra-high speed range. When the data PLR exceeded 5%, x (k − 1) data loss
the output speed exceeded the error tolerance range. Output For data packet loss in the system, two random sequences
{α1 (k)} and {α2 (k)} were introduced to describe the data
packet loss. {α1 (k)} was the description of packet loss
between actuator and controller, {α2 (k)} was the description
of packet loss between controller and actuator. Therefore,
= α1 (k) x (k) , u (k) = α2 (k) uc (k)
xc (k) (20)
Prob {α1 (k) = 1} = E {α1 (k)} = α
Prob {α1 (k) = 0} = 1 − α
(21)
Prob {α2 (k) = 1} = E {α2 (k)} = β
Prob {α2 (k) = 0} = 1 − β
FIGURE 3. Trends of vehicle speed over time at different data packet loss
rates. Here 0 < α, β ≤ 1.
20712 VOLUME 8, 2020W. Niu et al.: Influence and Optimization of Packet Loss on the Internet-Based Geographically Distributed Test Platform
To simplify the equation of state based on data packet loss, In addition
another random number sequence e (k) was introduced
J∞ (k) ≤ V (k|k) ≤ γ (30)
e (k) = α1 (k) α2 (k)
V (k + i|k) = |x (k + i|k)|2P(δ(k+i)) (31)
Prob {e (k) = 1} = E {e (k)} = ē = αβ (22)
Prob {e (k) = 0} = 1 − αβ L
X
P (δ (k + i)) = λj (δ (k))Pj (32)
Here, 0 < ē ≤ 1. j=1
Equation (20) can now be rewritten into the following form
Pj = γ Xj−1 (33)
xc (k) = αβx (k) + (1 − αβ) x (k − 1) (23)
The packet loss compensation controller feedback matrix
Consider the following state feedback controller is given as:
u (k) = K (k) xc (k) (24) L
X
K (k) = λj (δ (k)) Kj (34)
Here, K (k) was the controller gain that needed to be
j=1
designed.
Therefore, the equation (16) was organized into the follow- and
ing form Kj = Zj G−1 (35)
j
x (k + 1) = [Aδ (k) + αβBK (k)] x (k)
+ (1 − αβ) BK (k) x (k − 1) (25) The operational flow of the RMPC algorithm was:
y (k) = Cx (k) Step 0: Set k = 0.
Step 1: Measure x (k|k) = x (k) and δ (k).
In this paper, the output feedback robust predictive control Step 2: If x (k|k) is transferred from the actuator
is adopted. The output feedback is a robust model predictive to the controller, then solve the optimization problem
control (RMPC), which is represented by a robust predictive min γ , s.t.41, 42, and calculate K (k); otherwise, go to
compensation algorithm combining the robust predictive con- Gj ,Xj ,Zj
troller and the output feedback controller. Step 4.
Step 3: Apply the control amount u (k) = K (k) x (k) to
B. ROBUST MODEL PREDICTIVE CONTROL (RMPC) the control system.
First, define x (k + i|k) and y (k + i|k) as the predicted value Step 4: Set k = k + 1, and go to Step 1.
of the system at time k to time k + i. The space state equation of the powertrain system dis-
uc (k + i|k) = K (k) xc (k + i|k) , i = 0, 1, 2, · · · (26) tributed test platform is shown in Equation (1), and the state
equation is discretized, as shown in Equation (36).
The performance indicators considering RMPC follow:
J∞ (k) x (k + 1) = A (α (k)) x (k) + B (k) u (k) (36)
(∞ )
X
= max E x (k +i|k)2Q +u (k +i|k)2R (27) Since the Internet-based powertrain system has no uncer-
δ(k+i)∈1,i≥0 tainty parameter, α (k) can be a constant, and Equation (36)
i=0
Here Q and R are a symmetric positive definite matrix. can be organized into
x (k + 1) = Ax (k) + Bu (k) (37)
C. PREDICTIVE CONTROLLER DESIGN
Assume that the state of the discrete control system is mea- D. SIMULATION ANALYSIS
surable, x (k|k) is the state quantity of the system measured T
To set the initial state vector xT = 0 0 0 , the simulation
at time k, and the input and output of the system are uncon-
duration is 1800 s, the sampling period is 0.001 s, and the
strained. If a given symmetric positive definite matrix is satis-
symmetric positive definite matrix is given as
fied Q > 0, R > 0, and Zj , Gj , Xj > 0, γ > 0, then the packet
loss compensation strategy makes the performance index of 1 0 0
0.1 0
the RMPC upper bound as V (k|k) satisfies Equation (28) Q = 0 1 0, R = (38)
0 0.1
and (29). 0 0 1
1 ∗ When ē = 0.5 was set, the system was simulated and
≥ 0, j = 1, 2, · · · , L (28)
x (k|k) Xj analyzed. The simulation results were used to obtain the
T
Gj + Gj − Xj ∗ ∗ ∗ ∗
success of the data packet transmission during the system
Aj Gj + ēBZj Xl ∗ ∗ ∗ simulation process, as shown in Figure 5.
√ Another important result of the simulation was the value of
ē (1 − ē)BZj >0
√ 0 X l ∗ ∗ (29)
QG 0 0 γ I ∗
the state feedback compensator K as shown in Figure 6.
√ j
The effects of system simulation on the stability of the
ēRZj 0 0 0 γI
system under the action of an RMPC based on state feedback
where j = 1, 2, · · · , L, l = 1, 2, · · · , L. compensation are shown in Figures 7 and 8.
VOLUME 8, 2020 20713W. Niu et al.: Influence and Optimization of Packet Loss on the Internet-Based Geographically Distributed Test Platform
compensator and the reference vehicle speed, and then plots
the speed optimal values, as shown in Figure 9.
FIGURE 5. Data packet loss status.
FIGURE 9. RMPC optimization quality.
Figure 9 shows RMPC playing an optimization role in the
low-speed, medium-speed, high-speed and ultra-high-speed
sections of the test conditions. The degree of optimization
also increased with the increase of the vehicle speed, espe-
cially in the ultra-high-speed section. The optimization strat-
egy of RMPC played a significant role, and the maximum
FIGURE 6. Value of the state feedback compensator K . optimized amplitude reached 2 km/h.
As seen in Figures 7, 8, and 9, when the control system
was connected with the Internet, if the system had a data PLR
of 5%, the stability of the system was greater with RMPC
strategy.
V. CONCLUSION
The Internet-based distributed test platform is a develop-
ment trend of future vehicle test validation. The reliability
FIGURE 7. Relationship between 5% data packet loss rate (PLR) and of the test platform is an important research direction for the
0 PLR as well as vehicle speed. distributed test platform. In this paper, the theoretical and
simulation analysis of data packet loss on the stability of
Internet-based distributed test platforms during Internet data
transmission was carried out. The analysis found that data
loss had an impact on vehicle speed over the entire test sys-
tem. Especially when the data PLR exceeded 5%, the impact
on system stability could not be ignored. The results of this
study provide a powerful theoretical basis for the optimal
design of Internet-based distributed test platforms.
FIGURE 8. Speed difference of 5% data PLR and 0 PLR. Based on this research, a robust model predictive compen-
sator with state compensation was designed. Under the action
of the predictive compensator, its optimization ability for
As shown in Figure 7, in the case of a data packet loss
the Internet-based distributed test platform was validated by
rate (PLR) of 5%, during the entire test period, after the
simulation analysis. RMPC effectively improved the stability
optimization of RMPC, the output vehicle speed was close
of the system. Compared with the Internet-based distributed
to the output speed of the ideal state. To compare the opti-
test platform without the predictive compensator, it greatly
mization effect, the output vehicle speed in the ideal state was
improved the system performance of the Internet-based
taken as the reference vehicle speed. For the data PLR of 5%,
distributed test platform.
the differences between the speed of RMPC, the unoptimized
speed, and the reference vehicle speed are shown in Figure 8.
The optimization strategy of RMPC made the difference REFERENCES
between the output vehicle speed, and the reference vehicle [1] M. Silva, E. Vieira, G. Signoretti, I. Silva, D. Silva, and P. Ferrari,
‘‘A customer feedback platform for vehicle manufacturing compliant with
speed fluctuated around 0. Compared with the unoptimized industry 4.0 vision,’’ Sensors, vol. 18, no. 10, p. 3298, Oct. 2018.
state, the optimization effect is more obvious. [2] G. Pedone and I. Mezgár, ‘‘Model similarity evidence and interoperability
To further analyze the optimization effect of RMPC, this affinity in cloud-ready Industry 4.0 technologies,’’ Comput. Ind., vol. 100,
pp. 278–286, Sep. 2018.
paper compares the difference between the output speed
[3] V. Schreiber, V. Ivanov, K. Augsburg, M. Noack, B. Shyrokau, C. Sandu,
of RMPC and the reference vehicle speed, and the differ- and P. S. Els, ‘‘Shared and distributed X-in-the-loop tests for automotive
ence between the output speed of the non-robust predictive systems: Feasibility study,’’ IEEE Access, vol. 6, pp. 4017–4026, 2018.
20714 VOLUME 8, 2020W. Niu et al.: Influence and Optimization of Packet Loss on the Internet-Based Geographically Distributed Test Platform
[4] B. Rahmani and S. R. Hashemi, ‘‘Internet-based control of FCU hardware- KE SONG received the B.S. degree in engineer-
in-the-loop simulators,’’ Simul. Model. Pract. Theory, vol. 56, pp. 69–81, ing mechanics and the M.S. and Ph.D. degrees
Aug. 2015. in automotive engineering from Tongji Univer-
[5] U. M. Damo, M. L. Ferrari, A. Turan, and A. F. Massardo, ‘‘Test rig for sity, Shanghai, China, in 2003, 2008, and 2013,
hybrid system emulation: New real-time transient model validated in a respectively.
wide operative range,’’ Fuel Cells, vol. 15, no. 1, pp. 7–14, Feb. 2015. From 2008 to 2010, he was a Ph.D.
[6] K. Walker, Y.-J. Pan, and J. Gu, ‘‘Bilateral teleoperation over networks Exchange Student with the Karlsruhe Institute of
based on stochastic switching approach,’’ IEEE/ASME Trans. Mechatron-
Technology, Germany. Since 2013, he has been an
ics, vol. 14, no. 5, pp. 539–554, Oct. 2009.
Assistant Professor with the School of Automotive
[7] M. Brudnak, P. Nunez, V. Paul, T. Mortsfield, A. Shvartsman, H. S. Perera,
W. Smith, S. Mohammad, and M. Pozolo, ‘‘Human-in-the-loop simulation- Studies, Tongji University. He has authored three
based combat vehicle duty cycle measurement: Duty cycle experiment 1,’’ books and more than 30 articles. His research interests include system
in Proc. Simulation Interoperability Standards Org. (SISO), Orlando, FL, modeling, simulation, control strategies, model-based optimization design,
USA, Apr. 2006, pp. 6–8. and alternative validation methods and processes of powertrain systems for
[8] M. S. Borella, V. Upadhyay, and I. Sidhu, ‘‘Pricing framework for a pure battery/hybrid/fuel cell electric vehicles.
differential services Internet,’’ Eur. Trans. Telecomm., vol. 10, no. 3,
pp. 275–288, May 1999.
[9] X. Tang, L. Deng, J. Yu, and H. Qu, ‘‘Output feedback predictive control
of interval type-2 T–S fuzzy systems with Markovian packet loss,’’ IEEE
Trans. Fuzzy Syst., vol. 26, no. 4, pp. 2450–2459, Nov. 2018.
[10] J. Wu, X. Chen, A. Liu, and L. Yu, ‘‘Predictive control for visual servoing
control of cyber physical systems with packet loss,’’ Peer-to-Peer Netw.
Appl., vol. 12, no. 6, pp. 1774–1784, Nov. 2019.
[11] C. Ju, G. Yang, Y.-W. Chen, and C. Pan, ‘‘Dynamic optimization of YONGQIAN ZHANG was born in Shandong,
data packet-based communication for PLC visual monitoring,’’ Appl. Sci., China, in 1993. He received the bachelor’s degree
vol. 9, no. 8, p. 1721, Apr. 2019. in engineering from Northeast Agricultural Uni-
[12] A. Albers and T. Däser, ‘‘Implementation of a vehicle-in-the-loop devel- versity, Harbin, China in 2015, and the master’s
opment and validation platform,’’ in Proc. FISITA World Automot. Congr., degree in engineering from Tongji University,
Budapest, Hungary, Jun. 2010, pp. 1–10. Shanghai, China, in 2018.
[13] W. Niu, K. Song, Q. Xiao, M. Behrendt, A. Albers, and T. Zhang, ‘‘Trans- Since 2015, he has been working as a Research
parency of a geographically distributed test platform for fuel cell electric Assistant with the Institute of Fuel Cell Vehi-
vehicle powertrain systems based on X-in-the-loop approach,’’ Energies, cle Technology, Tongji University. His researches
vol. 11, no. 9, p. 2411, Sep. 2018. focus on transmission analysis and transmission
[14] A. Albers, M. Behrendt, S. Klingler, and K. Matros, ‘‘Verifikation und Vali- optimization method.
dierung im Produktentstehungsprozess,’’ in Handbuch Produktentwick-
lung, U. Lindemann, Ed. München, Germany: Carl Hanser Verlag: 2016,
pp. 541–569.
[15] H. Gao, T. Zhang, H. Chen, Z. Zhao, and K. Song, ‘‘Application of the
X-in-the-loop testing method in the FCV hybrid degree test,’’ Energies,
vol. 11, no. 2, p. 433, Feb. 2018.
[16] K. Song, F. Li, X. Hu, L. He, W. Niu, S. Lu, and T. Zhang, ‘‘Multi-mode
energy management strategy for fuel cell electric vehicles based on driving
pattern identification using learning vector quantization neural network QIWEN XIAO was born in Hubei, China, in 1990.
algorithm,’’ J. Power Sour., vol. 389, pp. 230–239, Jun. 2018. He received the bachelor’s degree in engineer-
[17] L. Xu and J. Xiao, ‘‘Modeling and simulation of the dynamic behavior ing with Southwest Jiaotong University, Chengdu,
of proton exchange membrane,’’ Inf. Manag. Eng., vol. 29, pp. 10–13, China, in 2012, and the master’s degree in engi-
Dec. 2007. neering from Tongji University, Shanghai, China,
[18] L. Xu and J. Xiao, ‘‘Modeling and simulation of PEM fuel cells based on
in 2015.
electrochemical model,’’ in Proc. Int. Conf. Remote Sens. Environ. Transp.
Since 2015, he has been working as a Research
Eng., Nanjing, China, Jun. 2011, pp. 24–26.
[19] A. Khaligh and Z. Li Battery, ‘‘Ultracapacitor, fuel cell, and hybrid energy Assistant with the Institute of Product Engineering
storage systems for electric, hybrid electric, fuel cell, and plug-in hybrid (IPEK), KIT. His research focuses on the valida-
electric vehicles: State of the art,’’ IEEE Trans. Veh. Technol., vol. 59, no. 6, tion of technical systems, which mainly about the
pp. 2806–2814, Apr. 2010. coupling of validation environment for the development of electrified drive
[20] D. Zhou, A. Al-Durra, I. Matraji, A. Ravey, and F. Gao, ‘‘Online energy systems.
management strategy of fuel cell hybrid electric vehicles: A fractional-
order extremum seeking method,’’ IEEE Trans. Ind. Electron., vol. 65,
no. 8, pp. 6787–6799, Aug. 2018.
[21] G. Giordano, V. Klass, M. Behm, G. Lindbergh, and J. Sjoberg, ‘‘Model-
based lithium-ion battery resistance estimation from electric vehicle oper-
ating data,’’ IEEE Trans. Veh. Technol., vol. 67, no. 5, pp. 3720–3728,
May 2018.
MATTHIAS BEHRENDT received the D.E. degree
WENXU NIU was born in Henan, China, in 1990. from the Institute of Product Engineering (IPEK),
She received the bachelor’s and Ph.D. degrees in Karlsruhe Institute of Technology, Karlsruhe,
automotive engineering from Tongji University, Germany, in 2009.
Shanghai, China, in 2014 and 2019, respectively. Since 2009, he has been the Chief Engineer
Since 2019, she has been an Assistant Profes- with the Institute of Product Engineering (IPEK).
sor with the College of Engineering, Shanghai His researches focus on the validation of technical
Polytechnic University. Her researches focus on systems and NVH including: IPEK-XiL(X in the
automotive powertrain system distributed test val- Loop) and its application in the development and
idation, transmission analysis, and transmission validation, distributed validation method and envi-
optimization method. ronment, and NVH-analysis and evaluation.
VOLUME 8, 2020 20715W. Niu et al.: Influence and Optimization of Packet Loss on the Internet-Based Geographically Distributed Test Platform
ALBERT ALBERS was born in 1957. He received TONG ZHANG received the B.S. degree in auto-
the Diploma degree in mechanic engineering motive engineering from Tsinghua University,
from Hannover University, Hannover, Germany, Beijing, China, in 1982, and the Dr.-Ing. degree.
in 1983, and the D.E. degree from the Institute He is currently pursuing the Ph.D. degree with the
of Machine Construction at Hannover University, Technical University of Berlin. He then worked as
Hannover, in 1987. From 1986 to 1988, he was a Development Engineer with the 2nd Automobile
the Chief Engineer with the Institute of Machine Works of China, in 1982 and 1983. From 1985 to
Construction, Hannover University. He worked for 1987, he studied Automotive Engineering, Tech-
Luk GmbH & Company, OHG, until 1995. He was nical University of Berlin (West). From 1987 to
the Head of development of clutch systems and 1991, he worked as an Assistant Student with the
torsional dampers and a Deputy Member of the management board. Since Institute of Automotive Engineering, Technical University of Berlin.
1996, he has been the Head of the Institute of Product Engineering (IPEK). From 1992 to 2006, he was employed as a Development Engineer, a Senior
He is also known as the Founding and Board Member of the scientific society Engineer, a Group Leader, and a Technical Manager with Ford Werke GmbH
of product engineering WiGeP and the member of the German National in Cologne for the total vehicle engineering. From 2006 to 2010, he was the
Academy of Science and Engineering ACATECH. Vice Director of the Clean Energy Automotive Engineering Center, Tongji
University, Shanghai, China, and the Managing Director of Shanghai Fuel
Cell Vehicle Powertrain Company, Ltd. From 2011 to 2016, he has been the
Director of the Clean Energy Automotive Engineering Center and the Direc-
tor of the National Fuel Cell Vehicle and Powertrain System Engineering
Research Center. He is currently the Director of the Academic Committee
of School of Automobile College, Tongji University, and the Director of
the Institute of Fuel Cell Vehicle Technology, and also a member of the
Schaeffler AG Supervisory Board.
He received the Shanghai Science and Technology Award, in 2007, and
the China Science and Technology Award, in 2008. He was elected by
the China’s Thousand Talent People Program, in 2009, and received the
Shanghai Expo Contribution Award, in 2010.
20716 VOLUME 8, 2020You can also read


