TweeProfiles3: visualization of spatio-temporal patterns on Twitter - Unpaywall
←
→
Page content transcription
If your browser does not render page correctly, please read the page content below
TweeProfiles3: visualization of spatio-temporal
                 patterns on Twitter

    André Maia1 , Tiago Cunha1 , Carlos Soares1 , and Pedro Henriques Abreu2
           1
                Faculdade de Engenharia da Universidade do Porto, Porto, Portugal
                            {ee08163,tiagodscunha,csoares}@fe.up.pt
       2
               Departamento de Engenharia Informática da Universidade de Coimbra
                                       Coimbra, Portugal
                                         pha@dei.uc.pt

        Abstract. With the advent of social networking, a lot of user-specific,
        voluntarily provided data has been generated. Researchers and compa-
        nies noticed the value that lied within those enormous amounts of data
        and developed algorithms and tools to extract patterns in order to act on
        them. TweeProfiles is an offline clustering tool that analyses tweets over
        multiple dimensions: spatial, temporal, content and social. This project
        was extended in TweeProfiles2 by enabling the processing of real-time
        data. In this work, we developed a visualization tool suitable for data
        streaming, using multiple widgets to better represent all the information.
        The usefulness of the developed tool for journalism was evaluated based
        on a usability test, which despite its reduced number of participants
        yielded good results.

        Keywords: Clustering, Information Visualization, Stream processing

1     Introduction
Online social networks present a variety of social media services which have
achieved a huge importance in social life as well as in marketing strategies as
they ”have been regarded as a timely and cost-effective source of spatio-temporal
information” [10]. One business which has been significantly affected is journal-
ism. Social networks can be used to change the way journalists are able to take
the pulse of the trending topics. Twitter is one of the top social networks, both
in popularity and monthly active users (around 250 million). It is a starting
point for our ongoing work because it is the most widely used microblogging
application.
    The first version of TweeProfiles [6] is focused on identifying profiles on data
collected from Twitter. The data is processed over 4 dimensions (spatial, tem-
poral, social and content) using Data Mining techniques. The tool enables the
visualization of the results of the clustering algorithm. Since it lacked the abil-
ity to produce real-time visualizations of the evolution of the data stream, one
extensions was developed: TweeProfiles2 [14]. It replaced the original batch clus-
tering algorithm with a stream clustering algorithm, enabling the use of real-time
2        TweeProfiles3: visualization of spatio-temporal patterns on Twitter

data. However, the system was not fully implemented and still used static data
to perform clustering.
    Until now, all work performed was essentially technical and scientific, in or-
der to design and prototype solutions to the challenges involved. For this reason,
it has not yet been possible to evaluate the visualization platform in a real-world
application. Our motivation for this work lies with the design of an extension
for TweeProfiles2. Our most important contribution is the development of a vi-
sualization system with an interactive representation of the profiles. In addition,
we also included connections to other platforms in order to enrich the profiles
and ease the access to relevant information. We used services provided by SAPO
Labs3 , which devote themselves to the extraction and analysis of several online
data sources related to the Portuguese community. We also aim to evaluate this
tool in a real-world application, as well as to integrate the previous process with
a real-time data extraction platform named SocialBus4 [3]. We discuss this tool
in more detail in Section 3.
    This paper is organized as follow: Section 2 contains the State of the Art for
the research areas of clustering and information visualization. Section 3 presents
the developed system with the concepts and decisions for the data mining process
and the visualization tool. Section 4 presents some results obtained from our
analysis of this project. Finally, Section 5 lists our conclusions and tasks for
future work.

2     State of The Art

2.1     Clustering

Data mining is the process of exploring large amounts of data with the goal of
finding potentially interesting patterns [9]. One of its most well-known tasks is
Clustering and it is defined as the process of grouping a set of data objects into
multiple groups or clusters so that objects within a cluster have high similarity,
but are very dissimilar to objects in other clusters [9]. Over the years, cluster
techniques have been applied in multiple domains, e.g. profiling breast cancer
patients to predict overall survival [1], helping to choose the best strategy to
defeat a soccer opponent [2] among others. Since this project follows the work
done in TweeProfiles2, one of its main tasks is to perform clustering on data
collected from Twitter, specifically using Stream Clustering approaches. Stream
Clustering is a research area that recently emerged to discover knowledge from
large amounts of continuously generated data. In this context, several algorithms
have been proposed to perform unsupervised learning [15]. Since this project
is more focused on Information Visualization than Stream Clustering, further
details regarding this topic will not be presented. However, a detailed survey
can be found elsewhere [15].
3
    http://labs.sapo.pt
4
    https://reaction.fe.up.pt/socialbus
TweeProfiles3: visualization of spatio-temporal patterns on Twitter 3
2.2 Information Visualization
An important step in the data mining process is the interpretation of the re-
sults. It is often based on tools to visualize both the data and the knowledge
extracted. The main properties that must be verified by these tools are: the
displaying of the data and temporal behaviour; showing properties of the entire
displayed scene and support interaction [8]. Visualization tools in a large mul-
tidisciplinary initiative require a pragmatic yet somewhat critical review of the
ways visualization can be used to represent and to analyse data. In this project,
the review of related work is focused on was done based on systems that collect
data from Twitter.
For clustering visualization, one of the most common representations are
graphs. The objects in each cluster are presented and the goal of assigning simi-
lar objects the shortest distance between clusters is maintained. Another option
involves assigning different colors and objects to different concepts. For instance,
overlapping ellipses over the most representative objects are displayed to rep-
resent similar objects. This approach was applied to study geographical lexical
variation [7] and to classify events [4]. More recently, different clustering visu-
alization methods were designed based on a different technique. For instance,
clusters can be displayed in a more innovative and interactive way, enabling the
user to easily identify content in each cluster [12].
Regarding visual representations on Twitter data, there are several approaches
reported in the literature. TweetPos [17] is a web service that is intended to fa-
cilitate the analytical study of geographic tendencies in Twitter data feeds. In
order to improve the user’s experience with the tool, TweetPos relies on visual
data structures such as heat maps and charts to represent the geo-spatial sources
of tweets.
SensePlace2 [13] presents a geovisual analytics approach to support situa-
tional awareness for crisis events using Twitter. It focuses on leveraging explicit
and implicit geographical information for tweets and on providing visual inter-
face methods to enable understanding of place, time, and theme components of
evolving situations.
TweetDrops [16] is a computer-based visualization tool designed for people
who have not paid attention to sustainability in their life before. It opens up an
opportunity for them to learn about energy conservation. It has two main visual
components: the background rain drops, which represent the accumulation of
energy related tweets collected from Twitter and the other is clickable foreground
tweets with detailed content.
Earthquake [5] is a visualization tool that uses Twitter posts regarding the
earthquake which occurred on the East Coast of the United States on August
23, 2011. It gathers information based on hashtags and displays the locations of
different tweets in different time periods. It displays information as heat maps
as well as graphs.4 TweeProfiles3: visualization of spatio-temporal patterns on Twitter
3 TweeProfiles3
In order to obtain data from Twitter in real time, we integrated TweeProfiles2
in SocialBus. SocialBus is a platform that allows users to gather and store data
from Twitter. Integrating SocialBus in TweeProfiles2 is a big improvement, due
to the fact that we may restrict SocialBus to save only tweets with the required
information for the task. Also, not only it allows TweeProfiles2 to be performed
directly on the Twitter stream in real time, but also allows the information to
be saved, in order to apply clustering to the same data. This is an important
feature for evaluation of stream clustering algorithms.
3.1 System Architecture
TweeProfiles3 combines SocialBus’ extraction and pre-processing methods to
gather data from Twitter and the multidimensional stream clustering strategy
from TweeProfiles2. The system architecture for TweeProfiles3 involves several
modules, namely: Data Handling, Clustering, Data Mapping and Search.
Data Handling The design of the data collection software module separates web-
interface logic from the background processes for data collection and storage.
This is completely done by SocialBus who uses the open-source Twitter4J library
for connection to the Streaming API and stores received tweets in MongoDB.
The data collected suffers pre-processing tasks, namely time conversion and geo-
data filtering.
Clustering As the data is retrieved from MongoDB it is fed to the cluster-
ing algorithms used in TweeProfiles2: DenStream and DBSCAN. DenStream
is responsible for the creation of micro-cluster that are then used as input to
DBSCAN in order to create the macro-clusters.
Data mapping This module is responsible for data visualization. It displays the
results of the clustering algorithms and of spatial, temporal and textual queries
to the end users. The Google Maps5 and Leaflet6 Javascript APIs are used to
display retrieved tweets and resulting clusters on a map.
Search Full-text search is incorporated in our systems to assist end users with
textual analysis, speed-up queries on a large data-set and to produce a broader
set of search results for each keyword specified by the user. Specifically, the
system performs a match of the desired word to both tweets and set of words
in all clusters. The system also incorporates a full spatial search enabling the
users the define a specific region to analyse, as well as a temporal search so that
the user can define a certain weekday to display all tweets and clusters and a
timeline to go back in time 7 days.
5
http://maps.google.com
6
http://leaftletjs.comTweeProfiles3: visualization of spatio-temporal patterns on Twitter 5
3.2 Visualization System
TweeProfiles3 exposes its functionality to end users through a php web applica-
tion framework, entitled Codeigniter7 . It also provides a simple web based data
collection and retrieval interface, which is shown in Figure 1. All widgets are
related in the sense that when selecting an element in the map, all other widgets
update accordingly.
Fig. 1. TweeProfiles3’s web interface.
The system interface includes 5 core components: 1) Tweet and cluster map;
2) tweet, news and entities list; 3) display/dimension controls; 4) wordcloud and
5) time graphics.
Tweet and Cluster map The map supports simultaneous tweets and clustering
distribution overview. In one platform, a heatmap provides the overview for
tweets and the clusters are displayed using simple markers. In a second platform,
tweets’ positions are displayed using markers and clusters with circles. Here we
can get detailed information such as the number of words in the cluster, the
creation time and position.
Tweet, News and Entities list The tweet list depicts the 1000 newest tweets
for any query. The entity list displays any personality found in the processed
tweets and the news list display the 20 more recent news. These were achieved
by acessing public APIs from Labs Sapo: Verbetes to detect entities from the
tweets and Máquina do Tempo, which provides the news per entity.
7
http://www.codeigniter.com6 TweeProfiles3: visualization of spatio-temporal patterns on Twitter
Display/Dimension controls These controls support query filtering with region
selection, time range sliders (either choosing weekday or going back in time) and
a minimalistic interface to specify terms for text-based queries. These controls
also include a filter to specify the desired dimensions.
Wordcloud Displays the most frequent words in all clusters. The size of the
words is equivalent to its frequency in tweets. The higher the frequency of said
word, the bigger the word’s size is. Clicking any word in the cloud performs a
search for news related to that word in Sapo.pt.
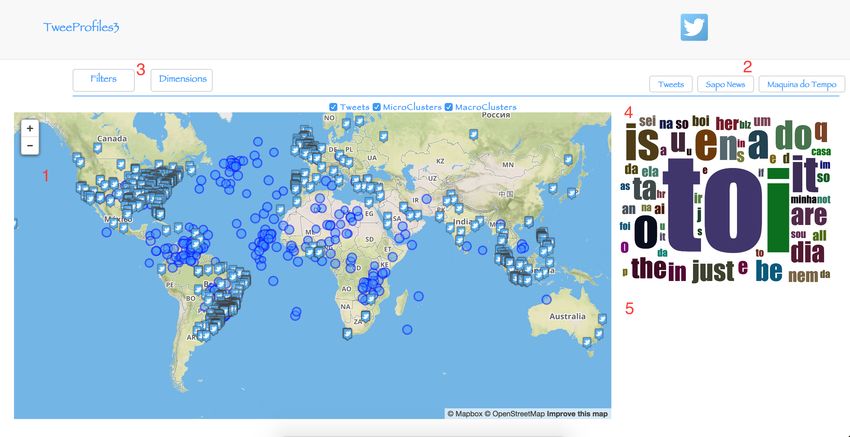
Time graphics In this dimension we have two types of graphs. The first ones
display the hour and weekday of the creation of all clusters (see Figure 2). They
are represented by a circle with a center on the average time of all tweets and
its size is directly dependent on the duration of the cluster. The second graph
is inspired on a timeline using horizontal bars to characterize each cluster. The
length of the bar is given by the earliest and latest timestamps of that cluster
(see Figure 3).
Fig. 2. Temporal visualization - x − y graph.
Fig. 3. Temporal visualization - timeline.
The chosen visualization strategy for the system assumes a spatio-temporal
representation as the basis. This decision was taken based on the fact that timeTweeProfiles3: visualization of spatio-temporal patterns on Twitter 7
and space dimensions are the most intuitive and easily representable and inter-
pretable. This representation approach was based on the methodology used by
[7] but with two differences: the colors to represent each cluster and the shape
of the clusters. One disadvantage of this type of representation is the overlap-
ping markers and circles when zoomed out. The only solution for this problem
is zooming in a specific region and/or using the available filters.
4 Results
The system was tested with a large scale data over a period of 30 days. The data
collection, for testing purposes, was focused on tweets labelled in Portuguese,
English, French and Spanish. All these tweets were retrieved without using any
specific query method, besides the language filtering. The clustering algorithm
parameters established are the same used in TweeProfiles2. Since the distance
function weighting was not performed correctly in TweeProfiles2, we do not con-
sider dimensional weighting in TweeProfiles3. Our goal is to provide a suitable
interface for TweeProfiles2 multidimensional clustering process, and therefore
we do not present the clustering results. A more extensive explanations of these
results can be found elsewhere [14]. Furthermore, since we still lack an evaluation
methodology suitable for the multidimensional nature of TweeProfiles, the re-
sults shown would have to be only examples of application and not a full-fledged
evaluation. Therefore, we devote ourselves to the presentation of the user study
used to validate our system and, in particular, the visualization tool.
4.1 Usability Tests
To understand if TweeProfiles3 met the desired features and design of end users,
we performed an usability test. We asked the participants to use the tool to ex-
tract information from tweets, news and clusters, evaluating the time and detail
of the result. These tests were made with JPN8 journalists, but unfortunately
only 3 were available at the time of this publication.
The participants were asked to complete a form, for us to understand how
they felt about the implemented features and the general use of TweeProfiles3.
This survey was created based on [11] and people were able to evaluate, from 1-5,
different features and aspects of the system (1 being that they disagreed with
the statement and 5 that they fully agreed). Table 1 presents the questionnaire
used for this user study, alongside the answer given by the three journalists.
We were able to understand that the users easily and effectively extracted
information from both tweets and all news features. The ability to apply different
filters to the data was highly appreciated and used, being the content filtering
the one that got the most attention. All data shown on the map seemed to be
useful for the tasks. An example given for the usage of tweet’s details was the
terrorist attack on Charlie Hebdo. The users stated that TweeProfiles3 would be
8
http://jpn.up.pt/8 TweeProfiles3: visualization of spatio-temporal patterns on Twitter
Table 1. User study questionnaire
Question Journalist 1 Journalist 2 Journalist 3
Age 25 23 27
Academic background Bachelor Bachelor Masters
Current position Journalist Journalist Editor
Years of experience in journalism 3 3 4
System simplicity 4 4 4
System efficiency for journalism? 4 4 4
System understandability 4 3 4
Information easily accessible 5 3 4
System layout 5 5 5
Tools available in the system 4 3 4
General feedback 4 4 4
Most important features? Map, News Map, News Map, News
Which tool would you remove? n/a Máquina do Tempo n/a
Which feature needs improvement? n/a Graphics n/a
Are the connections to Sapo tools useful? Yes Yes Yes
Most relevant Sapo tool used? News News News
Do you consider the wordcloud useful? Yes Needs improvement Yes
Which is the most efficient method:
the tool (TP3) or traditional methods? n/a TP3 TP3
perfect to support an article regarding what happened, since they could not only
gather information from the news, but also from what people were saying, giving
the possibility to use such information in the article. Regarding the same topic,
one aspect considered missing were hashtags and images. These two features are
removed from the analysis and since the biggest trend from the attack included
images and hashtags, a lot of information was lost. Improving the algorithm to
use this would be a big step to TweeProfiles3.
One other aspect considered important by the journalists was the integration
of Sapo platforms in TweeProfiles3. Even though the news list was more analysed
than Máquina do Tempo, both were acknowledge as a plus.
At first people evaluated how simple the usage of the system was. All answers
point to the fact that TweeProfiles3 is a simple system to use. This was our
biggest concern when designing the application, to create a simple system with
all the desired information. The users also agreed (with the same evaluation)
that they were able to complete work effectively using TweeProfiles3. Regarding
the usability of our system, one participant evaluated with a 4, and one of them
with a 3, on our 1-5 scale, how easy it was to understand. When it comes to
the information we present, all respondents answered with 5 on how clear the
information was organized on the screen, but regarding how easy it was to find
the information they were searching, one person evaluated with a 3, while others
still evaluated with a 5.
One other question all participants came to agreement was regarding the
implemented features. All said that the most important were the map with all
tweets/clusters and the news. However, they also considered that the time graphs
and the wordcloud require improvement. When asked if they agreed with the
integration of the platform from Sapo, all participants answered positively and
also, all agreed that the news list was more relevant than Máquina do Tempo.TweeProfiles3: visualization of spatio-temporal patterns on Twitter 9
When finally asking the participants if they were satisfied with the outcome
of TweeProfiles3, the answers were positive, all rating 4, which means our sys-
tem proved to be to the liking of all people who tested it. Even though there are
some improvements to be made and some features to be added, and the num-
ber of journalists we had to test our application was fairly low, it was easy to
understand how all participants considered TweeProfiles3 faster, more efficient
and detailed than any other traditional method for gathering information. Plat-
forms like this are seen as useful and necessary for the journalism community,
and overall, TweeProfiles3 went in the right way, satisfying all participants.
5 Conclusions
In this project we developed an integration of a multidimensional Stream Clus-
tering algorithm from TweeProfiles2 and SocialBus to create a visualization sys-
tem capable of displaying the profiles found in all different dimensions. We also
related these profiles with different news and entities from Sapo Labs and made
the first attempt to evaluate the tool as a real-world application. The visualiza-
tion tool made use of different visual patterns associated with all dimensions.
Specifically, a map with information regarding both tweets and clusters, a time-
line and a graph with timestamp details and a wordcloud with the most common
words in all clusters. These widgets enable a simultaneous representation of the
same information in different dimensions. Lastly, we performed a usability test
with journalists to understand the efficiency, usability and overall performance of
the platform. Despite the reduced number of interviewees, the results are promis-
ing. We have planned to tackle several problems in the future work: improve the
data filtering and cleaning strategies, implement other widgets or filters that
may lead to a more detailed analysis of the data, connect to external tools to
support more languages and increase the amount of the journalists invited to
the user study in order to provide our tests with statistical significance.
Acknowledgments. This work was partially supported by projects REAC-
TION (Retrieval, Extraction and Aggregation Computing Technology for Inte-
grating and Organizing News - UTA-Est/MAI/0006/2009), POPSTAR (Pub-
lic Opinion and Sentiment Tracking, Analysis, and Research - PTDC/CPJ-
CPO/116888/2010) and Sapo Labs. It was also financed by the ERDF – Eu-
ropean Regional Development Fund through the Operational Programme for
Competitiveness and Internationalisation - COMPETE 2020 Programme, and
by National Funds through the FCT – Fundação para a Ciência e a Tecnologia
(Portuguese Foundation for Science and Technology) within project POCI-01-
0145-FEDER-006961.
References
1. Abreu, P.H., Amaro, H., Silva, D.C., Machado, P., Abreu, M.H.: Personalizing
breast cancer patients with heterogeneous data. In: Proceedings of the 2013 IFMBE
International Conference on Health Informatics, 2013. pp. 39–42 (2013)10 TweeProfiles3: visualization of spatio-temporal patterns on Twitter
2. Abreu, P.H., Silva, D.C., Almeida, F., Mendes-Moreira, J.: Improving a Simulated
Soccer Team’s Performance Through a Memory-Based Collaborative Filtering Ap-
proach. Applied Soft Computing 23, 180–193 (2014)
3. Boanjak, M., Oliveira, E., Martins, J., Mendes Rodrigues, E., Sarmento, L.: Twit-
terecho: a distributed focused crawler to support open research with twitter data.
In: Proceedings of the 21st international conference companion on World Wide
Web. pp. 1233–1240. ACM (2012)
4. Boettcher, A., Lee, D.: Eventradar: A real-time local event detection scheme us-
ing twitter stream. In: Green Computing and Communications (GreenCom), 2012
IEEE International Conference on. pp. 358–367. IEEE (2012)
5. Crooks, A., Croitoru, A., Stefanidis, A., Radzikowski, J.: # earthquake: Twitter
as a distributed sensor system. Transactions in GIS 17(1), 124–147 (2013)
6. Cunha, T., Soares, C., Mendes Rodrigues, E.: Tweeprofiles: Detection of spatio-
temporal patterns on twitter. In: Luo, X., Yu, J., Li, Z. (eds.) Advanced Data
Mining and Applications, Lecture Notes in Computer Science, vol. 8933, pp.
123–136. Springer International Publishing (2014), http://dx.doi.org/10.1007/
978-3-319-14717-8_10
7. Eisenstein, J., O’Connor, B., Smith, N.A., Xing, E.P.: A latent variable model
for geographic lexical variation. In: Proceedings of the 2010 Conference on Em-
pirical Methods in Natural Language Processing. pp. 1277–1287. Association for
Computational Linguistics (2010)
8. Gahegan, M.: 11 visual exploration and explanation in geography analysis with
light. Geographic Data Mining and Knowledge Discovery p. 291 (2009)
9. Jiawei, H., Kamber, M.: Data mining: concepts and techniques. San Francisco, CA,
itd: Morgan Kaufmann 5 (2001)
10. Lee, C.H., Yang, H.C., Chien, T.F., Wen, W.S.: A novel approach for event detec-
tion by mining spatio-temporal information on microblogs. In: Advances in Social
Networks Analysis and Mining (ASONAM), 2011 International Conference on. pp.
254–259. IEEE (2011)
11. Lewis, J.R.: Ibm computer usability satisfaction questionnaires: psychometric eval-
uation and instructions for use. International Journal of Human-Computer Inter-
action 7(1), 57–78 (1995)
12. Liu, X., Hu, Y., North, S., Shen, H.W.: Compactmap: A mental map preserving
visual interface for streaming text data. In: Big Data, 2013 IEEE International
Conference on. pp. 48–55. IEEE (2013)
13. MacEachren, A.M., Jaiswal, A., Robinson, A.C., Pezanowski, S., Savelyev, A.,
Mitra, P., Zhang, X., Blanford, J.: Senseplace2: Geotwitter analytics support for
situational awareness. In: Visual Analytics Science and Technology (VAST), 2011
IEEE Conference on. pp. 181–190. IEEE (2011)
14. Pereira, J.: TweeProfiles2: real-time detection of spatio-temporal patterns in Twit-
ter. Master’s thesis, Faculdade de Engenharia da Universidade do Porto (2014)
15. Silva, J.A., Faria, E.R., Barros, R.C., Hruschka, E.R., de Carvalho, A.C., Gama,
J.: Data stream clustering: A survey. ACM Computing Surveys (CSUR) 46(1), 13
(2013)
16. Wang, X., Cosley, D.: Tweetdrops: a visualization to foster awareness and collective
learning of sustainability. In: Proceedings of the companion publication of the 17th
ACM conference on Computer supported cooperative work & social computing. pp.
33–36. ACM (2014)
17. Wijnants, M., Blazejczak, A., Quax, P., Lamotte, W.: Tweetpos: A tool to study
the geographic evolution of twitter topics. In: International Conference on Web
Information Systems and Technologies. pp. 257–266 (2014)You can also read