SYSTEMATIC UNCERTAINTIES AND CROSS-CHECKS FOR THE NOVA JOINT ΝΜ+ΝE ANALYSIS
←
→
Page content transcription
If your browser does not render page correctly, please read the page content below
Systematic Uncertainties and Cross-Checks for the
                                          NOvA Joint νµ +νe Analysis
arXiv:1808.10760v1 [hep-ex] 31 Aug 2018

                                          Reddy Pratap Gandrajula∗
                                          Michigan State University
                                          E-mail: gandraju@msu.edu

                                          Micah Groh
                                          Indiana University
                                          E-mail: mcgroh@iu.edu

                                          For the NOvA Collaboration

                                                  The physics goals of NOvA are the constraints of neutrino oscillation parameters such as the
                                                  octant of θ23 , δCP , and the neutrino mass hierarchy via a joint fit to νµ and νe oscillation spectrum.
                                                  We do this by propagating νµ from the world’s most intense neutrino beam at Fermilab, over a
                                                  baseline of 810 km to northern Minnesota, USA, and measure the νµ to νe oscillation probability.
                                                  NOvA announced its latest oscillation results, based on 8.85×10²⁰ (6.9×10²⁰ ) protons on target
                                                  neutrino (antineutrino) data. Preliminary results for the allowed values of oscillation parameters
                                                  are: ∆m232 = 2.51+0.12         −3    2    2
                                                                       −0.08 × 10 eV , sin θ23 = 0.58 ± 0.03 (upper octant), and δCP = 0.17π with
                                                  preference to the normal hierarchy. Reliable constraints on these oscillation parameters require
                                                  a rigorous treatment of systematic uncertainties and thorough cross-checks. In this paper, we
                                                  present an overview of the treatment of systematic uncertainties as well as cross-checks using
                                                  muon removed simulations and cosmic muon bremsstrahlung showers.

                                          Proceedings of the Neutrino 2018, the 28th International Conference on Neutrino Physics and Astrophysics
                                          4–9 June, 2018
                                          Heidelberg, Germany

                                                ∗ Supported      by DOE/Fermilab.

                                           c Copyright owned by the author(s) under the terms of the Creative Commons
                                          Attribution-NonCommercial-NoDerivatives 4.0 International License (CC BY-NC-ND 4.0).              http://pos.sissa.it/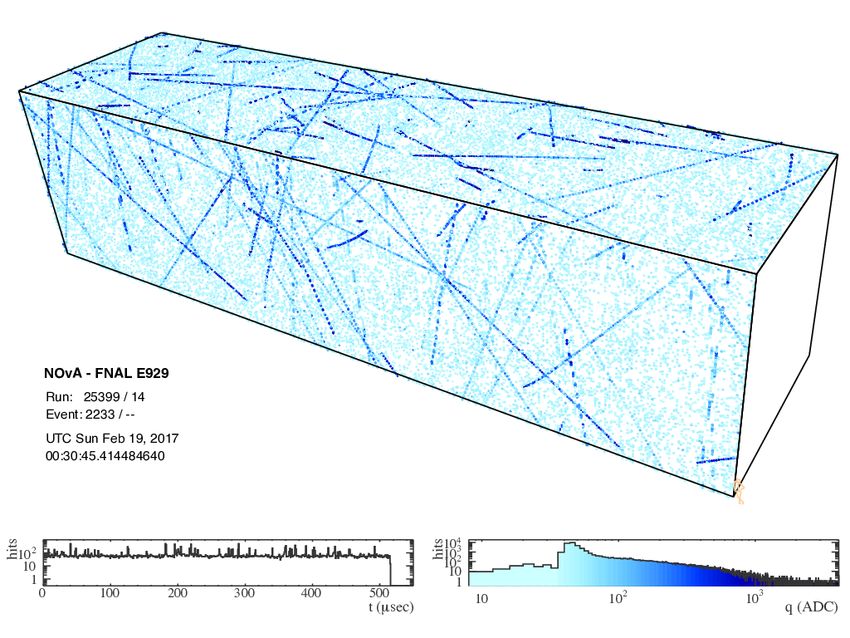
Systematics and cross-checks

1. Introduction

     The NuMI1 Off-Axis νe Appearance experiment (NOvA) [1, 2] is the flagship long-baseline
neutrino experiment in the United States, designed to study the properties of neutrino oscillations.
NOvA consists of two functionally equivalent detectors each located 14.6 mrad off the central axis
of the Fermilab NuMI neutrino beam, the world’s most intense neutrino beam. The Near Detector
is located 1 km downstream from the neutrino production source, and the Far Detector is located
810 km away in Ash River, Minnesota. This long baseline, combined with the ability of the NuMI
facility to switch between neutrino and anti-neutrino enhanced beams, allows NOvA to make pre-
cision measurements of neutrino mixing angles, constrain the neutrino mass hierarchy, and begin
                                                                                          (−)     (−)
searching for CP violating effects in the lepton sector. We study 4 oscillation channels ν µ → ν µ
    (−)     (−)
and ν µ → ν e . NOvA released its latest oscillation results from a full detector equivalent expo-
sures of 8.85×10²⁰ protons on target neutrino beam and 6.9×10²⁰ protons on target antineutrino
beam [3, 5, 6] collected between February 2014 and April 2018. This paper presents the assessment
of systematic uncertainties and cross-check studies done in making these precise measurements. It
is organized as follows. In Sec. 2, we give brief descriptions of NOvA detectors. Sec. 3 and Sec. 4
describe the neutrino oscillation measurements and associated systematics. The data-driven cross-
checks using muon-removed electrons and muon-removed bremsstrahlung showers are explained
in Sec. 5 and in Sec. 6.

2. The Detectors

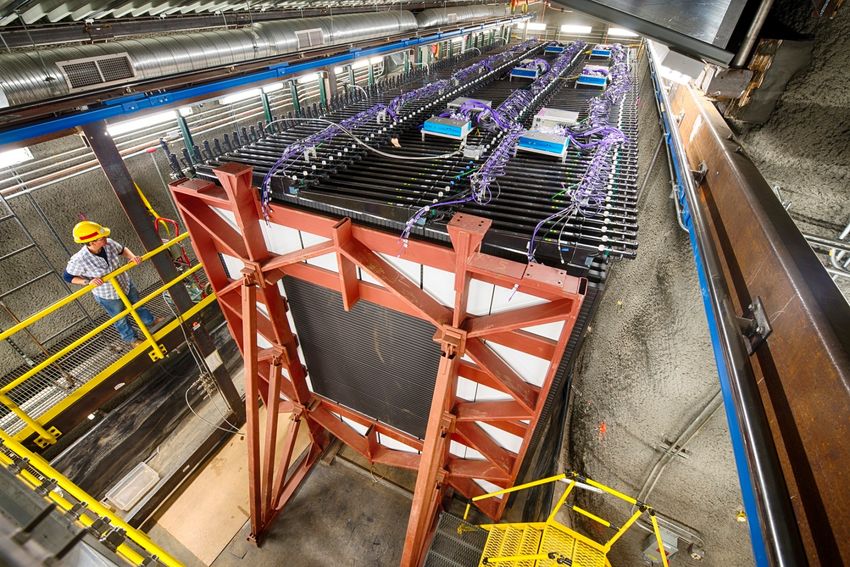
     The NOvA detectors were designed for electron identification. The two detectors are function-
ally equivalent, fine-grained, low-Z (0.18 radiation lengths per layer), liquid scintillator calorime-
ters made of 65% active material. The Far Detector (FD) is 14 ktons and sits on the surface in
Minnesota. The Near Detector (ND) is 290 tons placed 300 ft underground at Fermilab. These two
detectors consist of layered reflective polyvinyl chloride (PVC) cells, filled with liquid scintilla-
tor arranged in alternating horizontal and vertical planes for 3D reconstruction, to form a tracking
sampling calorimeter. When a charged particle passes through the liquid scintillator, which is
comprised primarily of mineral oil solvent with a 5% pseudocumene admixture and PPO and bis-
MSB as secondary fluors[4], it produces scintillation light. The scintillation light is picked up by
a 0.7 mm wavelength shifting fiber within every cell (each cell is read out individually) which is
coupled to a 32 pixel avalanche photo-diode (APD) where the light is collected and amplified.

     The FD cells are 3.9 cm × 6.6 cm in cross section, with the 6.6 cm dimension along the beam
direction, and 15.5 m long. The ND cells are identical to those of the FD but shorter in length,
3.9 m. In total, there are 344,054 cells in the FD and 21,192 cells in the ND. To improve muon
containment, the downstream end of the ND has a "muon catcher" composed of a stack of sets of
planes in which a pair of one vertically-oriented and one horizontally-oriented scintillator plane
is interleaved with one 10 cm thick plane of steel. The relative sizes of the detectors are shown
diagrammatically in Fig. 1. Both detectors are 14.6 mrad off-axis of the NuMI beam. This results
   1 Neutrinos   at the Main Injector

                                                  1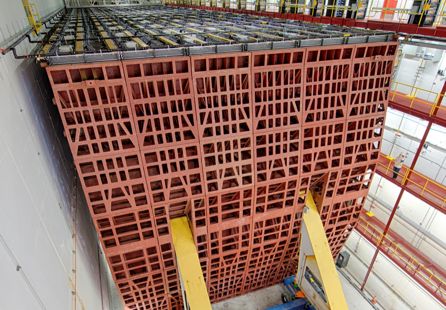
Systematics and cross-checks

in a neutrino flux with a narrow band energy spectrum centered around 2 GeV. Such a spectrum
emphasizes νµ → νe oscillations for the NOvA baseline and reduces backgrounds from higher
energy neutral current interaction events.

Figure 1: The relative sizes of the NOvA Far and Near detectors. The structure of the NOvA
detector layers and a single PVC cell coupled to an APD via a wavelength shifting fiber are also
shown.

3. Neutrinos in NOvA

     The NuMI beam at Fermilab creates a "spill" of neutrinos every 1.3 seconds. Each spill lasts
for only 10 µs. NOvA data is recorded in 550 µs intervals centered on the beam spill, in which
hundreds of particle tracks can be seen as shown in Fig. 2.

      An event display of νµ and ν̄µ candidate data events are shown on the left and right of Fig. 3,
respectively. Typically, νµ events have a long, forward going track with recorded hits coming from
µ − ’s MIP interaction and hadronic activity coming from protons around the interaction vertex.
Typical ν̄µ event characteristics are a similar, long track with recorded hits coming from µ + ’s MIP.
Antineutrino events tend to have lower visible hadronic activity near the vertex due to interaction
kinematics and the high neutron content of their final states, neutrons can soft absorb with no signs
of recorded hits for its interaction. Due to the smaller hadronic energy, the µ + will tend to be
more aligned with the beam direction. The color scale shown underneath the event display remains
proportional to the light seen in each cell of the detector: the light is turned into charge on the APD
in order to be measured.

     A zoomed in event display of νe and ν̄e candidate core data events are shown on left and
right of Fig. 4, respectively. Typical νe event characteristics are a forward going EM shower with
recorded hits coming from e− ’s interaction and hadronic activity coming from protons around the
interaction vertex, and ν̄e event characteristics are an EM shower more aligned with the beam di-
rection with recorded hits coming from e+ ’s and, similar to ν̄µ , less hadronic activity around the

                                                  2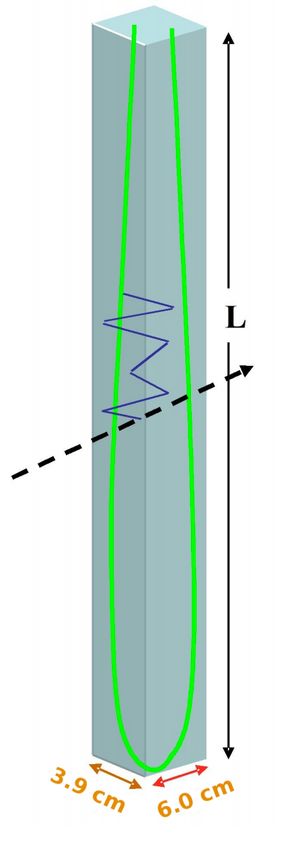
Systematics and cross-checks

                     Figure 2: 5 ms data readout from the NOvA Far Detector.

vertex.

     NOvA has pioneered the use of Convolutional Neural Networks (CNN) for reconstruction
tasks in neutrino physics. The core of neutrino selection is the use of a CNN known as the Con-
volutional Visual Network (CVN), based on GoogLeNet [8, 9] a CNN for image recognition tasks.
NOvA was the first experiment to utilize CNNs in a HEP result [7]. The neutrino signal selections
includes cosmic rejection, containment, data quality, and pre-selection cuts along with neutrino
flavor identification from CVN.

     Electron neutrino events passing all these selections form the "core" sample at both detectors.
These events are further split into two samples of low PID and high PID score. We also construct
a third, "peripheral" sample of FD events by considering events that fail containment or cosmic
rejection selections, but have very high PID scores from the neural network classifier. Candidate
νµ events are split into four "quartiles" based on the ratio of hadronic energy to total energy in the
event.

    The neutrino energy spectrum at the NOvA ND is measured close to the neutrino source be-

                                                  3
00 2600
2200 2800
2400 3000
2600 2200 3200
2800 2400 3400
3000 2600
1500 3600
3200 2800 3800
3400 3000
1500 4000
3600
2000 3200 4200
3800 3400 4000
1500 3600
2000 2500 4200 3800 4000
2000 3000 4200
2500 3000
2500 3500 3500
3000
0 0 0
−400
200 200
x (cm)
x (cm)
x (cm)
x (cm)
x (cm)
−200 −200 −200
Systematics and cross-checks
0 0
−400 −400 −400
600
y (cm)
⌫µ Candidate Run: 29361 / 31
400 400
400 Run: 23323 / 59 ⌫¯µ Candidate Event: 10657
Event: 453691
AAACDXicbVC5TsNAFFyHK4TLQEmzIiBRRTZCghJBQxkkEpDiKHpeP8Mq67XZAymy8gM0/AoNBQjR0tPxN2yOgmuq0cx7+2YnLgTXJgg+vcrM7Nz8QnWxtrS8srrmr2+0dW4VwxbLRa6uYtAouMSW4UbgVaEQsljgZdw/HfmXd6g0z+WFGRTYzeBa8pQzME7q+TtlNH6ElgqTYSRtL8psdGshoacgE56AwWHPrweNYAz6l4RTUidTNHv+R5TkzGYoDROgdScMCtMtQRnOBA5rkdVYAOvDNXYclZCh7pbjIEO665SEpi5TmktDx+r3jRIyrQdZ7CYzMDf6tzcS//M61qRH3ZLLwhqUbHIotYKanI6qoQlXyIwYOAJMcZeVshtQwIwrsOZKCH9/+S9p7zfCoBGeH9SPT6Z1VMkW2SZ7JCSH5JickSZpEUbuySN5Ji/eg/fkvXpvk9GKN93ZJD/gvX8BWeGcWQ==
AAACEnicbVC5TsNAFFyHK4TLQEmzIkKCJrIREpQIGsogkYAUR9Hz+hlWWa/NHkiRlW+g4VdoKECIloqOv2FzFFxTjWbe2zc7cSG4NkHw6VVmZufmF6qLtaXlldU1f32jrXOrGLZYLnJ1FYNGwSW2DDcCrwqFkMUCL+P+6ci/vEOleS4vzKDAbgbXkqecgXFSz98ro/EjtIyFxWEUg4qk7UWZjW4tJPQUZMITMDjs+fWgEYxB/5JwSupkimbP/4iSnNkMpWECtO6EQWG6JSjDmcBhLbIaC2B9uMaOoxIy1N1ynGZId5yS0NQFS3Np6Fj9vlFCpvUgi91kBuZG//ZG4n9ex5r0qFtyWViDkk0OpVZQk9NRPzThCpkRA0eAKe6yUnYDCphxLdZcCeHvL/8l7f1GGDTC84P68cm0jirZIttkl4TkkByTM9IkLcLIPXkkz+TFe/CevFfvbTJa8aY7m+QHvPcvZaGeiQ==
600 600 600
600
(cm)
yy(cm)
400
y (cm)
y (cm)
(cm)
y (cm)
yy(cm)
200 200
200
400 400 400
400
0
2200 00
2400 3400 2600 2800
3000 1500 3200 2000
3600 3800 4000 25003000
4200 3000 3500
00 2600
2200
800 2800
2400 3000
1000
2800 2400 3400
2600 2200 3200
2800 3000 2600
3000
1200
3200 2800 3800
1500 3600
3200 3400 3000
3400 3600
1500 4000
3600
1400
2000 3200 3800
4200
3800 3400
z (cm) 2000
2000 2500 1600
1500 3600
4000 2200 3800
4200 2400 4000
2000 2600
2500 1800 2800
3000 4200 3000
2500
z (cm)
2000
3000 3500 3500
3000
z (cm) z (cm)Z (cm) z (cm) z (cm) z (cm)
NOvA - FNAL E929 3
Z (cm)
NOvA - FNAL200 10NOvA NOvA - FNAL E929 NOvA - FNAL E929 NOvA - FNAL E929
hits
hitshits
E929 - FNAL E929
hitshits
21022 103 2 103 1010
22 103
hits
hits
hits
hits
hits
hits
Run: 29361 / 31
hits
hits
hits
hits
hits
2000 10Run: 2 102 2
02 1800
Run: 23323 / 592200 102
10 2400 800 102 10
23323 / 59 2200 2 Run: 29361 / 31
18002600 2400 1000 200010Run: 29361
1022800 800 / 1200
2600 31
2200 2
3000
10 10 2Run:
1000
2800 29361 / 31
1400 2400 1200
3000
10 1600
800 2600 1400101800
10002800 1600 2000
1200 102
3000 1800 1400
0 Event: 10657
Event: 453691 / -- / -- 10 10 10
Event: 800
453691 / -- 10 10 Event: 10657 / -- 10 10Event: 10657 / -- 10 1010
10Event: 10657 / -- 10 10 10 10
10 1 1 1 1 1 1
1 1 1 1 1 1 1 Apr 3, 2018
UTC Sun Jun 19, 2016
UTC
218 Tue 220Apr 3, 2018
1 11Sun
218 UTC
222 200 224 220Jun 19, 2016
226 222
228
UTC Tue Apr 3, 2018
218 226200
UTC Tue Apr 3, 2018
218 220
220 228 222 102 09:56:22.787118848
224 09:56:22.787118848 224 226 3 228 224 UTC1Tue
222 2 218 200
220
226 3 222
228 2242 218
10226 220 228 3 222 102 22410 226 103 228102 10 103 102
4 226 100 228
07:07:47.078722704 218
10 t (µsec)220
07:07:47.078722704 10 222 224
1022 t (µsec)
10 10
226 1033 228 10
t (µqsec)
(ADC)
10 10 10
09:56:22.787118848
t (µqsec)
(ADC)
10 2 10
10 2 t (µsec) q (ADC) 10 3 qt(ADC)
3
(µqsec)
(ADC) q (ADC)
10 10 10 q (ADC) 10 10 10
x (cm)
09:56:22.787118848
t (µsec) t q(µ(ADC)
sec) q (ADC)
700
100 Figure 3: A candidate100ν µ -CC and ν̄ µ -CC events in the
100 Y-Z view are shown on the left and right
x (cm)
x (cm)
x (cm)
x (cm)
0
respectively.
600 The charge deposited information of each event is shown underneath the event display.
0 Both events exhibit the0 characteristic muon track of νµ0-CC interactions.
− 100
− 600 500
− 100 − 100 − 100
− 650 − 500 200
200
⌫e Candidate
− 500 Run: 15330 / 4 -500
− 500 ⌫¯e Candidate Run: 25540 / 60
Event: 4600
AAACC3icbVA9T8MwFHT4pnwVGFksKiSmKkFIMFZ0YSwShUpNFb04L9TCcYLtIFVRdhb+CgsDCLHyB9j4N7ihA7TcdLp7z+98YSa4Nq775czNLywuLa+s1tbWNza36ts7VzrNFcMuS0WqeiFoFFxi13AjsJcphCQUeB3etsf+9T0qzVN5aUYZDhK4kTzmDIyVgvp+4VeP0EJhVPoyD9C/yyGibZARj8BgGdQbbtOtQGeJNyENMkEnqH/6UcryBKVhArTue25mBgUow5nAsubnGjNgt3CDfUslJKgHRRWjpAdWiWhsE8WpNLRSf28UkGg9SkI7mYAZ6mlvLP7n9XMTnw4KLrPcoGQ/h+JcUJPScTE04gqZESNLgClus1I2BAXM2PpqtgRv+suz5Oqo6blN7+K40Tqb1LFC9sg+OSQeOSEtck46pEsYeSBP5IW8Oo/Os/PmvP+MzjmTnV3yB87HN6nQm2w=
Event: 11978 AAACEHicbVC5TsNAFFyHK4TLQEmzIkJQRTZCghJBQxkkEpDiKHpeP8Mq67XZAymy8gk0/AoNBQjRUtLxN2yOgmuq0cx7+2YnLgTXJgg+vcrM7Nz8QnWxtrS8srrmr2+0dW4VwxbLRa6uYtAouMSW4UbgVaEQsljgZdw/HfmXd6g0z+WFGRTYzeBa8pQzME7q+btlNH6ElrGwOIxiUJG0PYxuLST0FGTCEzA47Pn1oBGMQf+ScErqZIpmz/+IkpzZDKVhArTuhEFhuiUow5nAYS2yGgtgfbjGjqMSMtTdcpxlSHecktDUxUpzaehY/b5RQqb1IIvdZAbmRv/2RuJ/Xsea9KhbcllYg5JNDqVWUJPTUTs04QqZEQNHgCnuslJ2AwqYcR3WXAnh7y//Je39Rhg0wvOD+vHJtI4q2SLbZI+E5JAckzPSJC3CyD15JM/kxXvwnrxX720yWvGmO5vkB7z3L7GAnZw=
y (cm)
− 700
100 -600
yy(cm)
− 600 − 600 − 600
y (cm)
y (cm)
(cm)
(cm)
100
yy(cm)
− 750
− 700 00 − 700 -700
− 700
− 800
2200 800 2400 -100
−100 1000 2600 12002800 3000
1400 1600 1800 2000
− 800 − 800 z (cm)1000 -800
− 800
1800 2200 2000 2400 2200
2200 2600 2400 2800 2600 1200 1400
z 2000
1600
(cm)
800
Z1800
(cm) 2400
1000 2000 26001200
800 3000
2200
z (cm)
2800 1400 2400 3000 800 2600
1200 1600
z (cm) Z (cm)
10002800
1400 1800 1600 3000
1200
z (cm)
z (cm)
1800 1400
z
NOvA - FNAL E929
10 22
hits
10
hits
hits
102 - FNAL E929 1022- FNAL E929
hits
/ 60 - FNALNOvA
Run: 25540NOvA E929 NOvA - FNAL E929 10
NOvA
hits
10 10/210 2 2
hits
hits
hits
hits
hits
102 1015330 102 Run: 25540 /10 10
hits
hits
hits
102 / 60 10
hits
hits
hits
2
Event: 4600 /Run:
-- 25540 / Run:
60 4 60 102 Run:1025540 102 102 102
10 1 1 10 10 10 10 10 10 / -- 10 10 10 10
UTC Mon MarEvent: 4600 / --Event: 11978 / --
6, 2017 Event: 4600 / -- 114600
Event:
1 1 1
10218 2201 UTC 10 222 1 224 1 226
10 228 1 1 1 1 1
4 224 226 228 10 10 1033
22 33
q (ADC) 102 2 q224
q(ADC)
222 UTC Mon Mar UTC
10:04:34.430683584
218
224 220
226 10
Fri May
6, 2017 23, 2014 10
Mon Mar26, 2017 10 UTC Mon 10
Mar 6, 2017 10
t (µsec) 222228 224 10 226218 228220
218 10 22022210 222
224 10218224 q 10
(ADC) 226
3 226 t (2µ220
sec)
228 228
222 10103224
10 226 218
228
10 220
102
10222 10
3
10 3(ADC)226
2
10 228 3
10 10
t (µ17:30:2.632293184
10:04:34.430683584
sec) t10:04:34.430683584
(µsec) q (ADC) 10:04:34.430683584
t (µsec) t (µsec) q (ADC) t (µsec) q (ADC)
q (ADC) t (µsec) q(
Figure 4: A candidate νe -CC and ν̄e -CC events in the Y-Z view are shown on the left and right
respectively. The charge deposited information of each event is shown underneath the event display.
Both events exhibit the characteristic electron shower of νe -CC interactions.
fore neutrino oscillations have occurred. This large statistics data sample is used to validate the MC
prediction of the expected beam flux and the simulation of the detector response. The νe and νµ FD
signal prediction is based on simulation of the νµ beam flux, constrained by the observed selected
νµ -CC candidates in the ND and oscillated appropriately. Discrepancies between data and MC cal-
culations in the ND energy spectrum are extrapolated to produce a predicted FD spectrum [10, 11].
The demonstration of the extrapolation procedure from the ND to the FD is shown in Fig. 5.
We first convert the ND reconstructed energy spectrum into a true energy spectrum using the
reconstructed-to-true migration matrix obtained from the ND simulation. The ratio of the data’s
unfolded spectrum to the simulated spectrum in bins of true energy is then used as a scale factor
to the simulated true energy spectrum of νµ -CC events selected in the FD. That true energy spec-
trum is also weighted by the oscillation probability computed for three-flavor neutrino oscillations,
including matter effects, for any particular choice of the oscillation parameters. Finally, the true en-
4Systematics and cross-checks
ergy spectrum is smeared to a reconstructed energy spectrum, again using the simulated migration
matrix. In the final step, the data-based cosmic and simulation-based beam induced backgrounds
are added to the prediction, which is then compared to the FD data. As the two detectors are
functionally equivalent this ratio based extrapolation allows for reductions in many uncertainties,
particularly beam related uncertainties and cross section uncertainties, as shown in Sec. 4.
10 ND Events/1 GeV
15
GeV
8 80
ND data
Events
6
Events/1
60
10
4
Base Simulation 40
FD FD
5
2 Data-Driven Prediction 20
5
0 00
0 1 2 3 4 5
True Energy (GeV)
True Energy (GeV)
4 44
3 33
2 22
1 11
0 1 2 3 4 5 0 1 0 22 00 1 12
0.1 12 00 00 51 102 153 20 4 25 5
ND Reco Energy (GeV) 5
10 ND Events
-3
10 F/N Ratio P(νµµ→νµe) FD Events FD Reco EnergyBin
FD Analysis (GeV)
Figure 5: The ND to FD extrapolation method used to predict the νe -CC signal is shown here.
The same extrapolation procedure is used to measure the systematic uncertainties in the oscillation
analyses.
The ND selected νe are oscillated to the FD by component to make a prediction of the back-
ground components. Each component is propagated independently in bins of energy and particle
ID bins. The cosmic background is measured using data from the NuMI timing sideband around
the known beam window. A separate, 10 Hz, periodic trigger is used for zero-bias cosmic studies.
The signal spectrum, background spectrum, and cosmic prediction together make up the extrapo-
lated prediction. This is shown for neutrino mode in Fig. 6.
Neutrino Mode NOvA Preliminary Neutrino beam NOvA Preliminary
Low PID High PID
Events / 8.85 ´ 1020 POT-equiv
5
Low PID High PID Prediction
ND data
15 App. ne CC
Peripheral
103 Events / 8.03×10²⁰ POT
Total MC
4 Beam ne/ ne CC
Core
NC NC
ν µ CC Other CC
3 Cosmic bkg.
ν e CC 10
ν µ CC
2 ν e CC Prediction
extrapolation
Uncorr. MC 5
1
0
1 2 3 4 1 2 3 4 1 2 3 4 1 2 3 4
Reconstructed Neutrino Energy (GeV) Reconstructed Neutrino Energy (GeV)
Figure 6: The data-corrected near detector MC decomposed into each of the background compo-
nents and the far detector prediction including the νe -CC oscillated signal.
5Systematics and cross-checks
4. Oscillation Systematics
We discuss the dominant systematic uncertainties associated with the joint νe + νµ analysis us-
ing both neutrino and antineutrino beams in NOvA. Many other effects are considered, for example
the detector response modeling and normalization systematics, but will not be discussed here as the
effect on event selection and final measurements is negligible.
The impact of systematic uncertainties are estimated by producing shifted ND and FD simu-
lation samples by event reweighing, producing specially shifted files, or altering kinematic values
within events. Systematic uncertainties in the analysis are extrapolated from the ND to the FD
using the same extrapolation technique shown in Sec. 3. Systematic uncertainties in the analysis
are applied by replacing the systematically shifted ND spectrum in place of the nominal simulation
prior to extrapolation to the FD. The systematically shifted FD predictions can then be compared
to the nominal prediction for each systematic. As an example, the extrapolated FD prediction in
3 CVN bins for the dominant absolute calibration systematic uncertainty with the systematic error
band is shown Fig. 7 for neutrino mode on left and antineutrino mode on right.
Shifted Shifted
Figure 7: Extrapolated FD prediction in 2 CVN bins and the peripheral for the dominant absolute
calibration systematic is shown for νe signal (left) and ν̄e signal (right).
Systematic uncertainties are included as nuisance parameters in the fit in the oscillation anal-
yses. In the simultaneous fit of the νe appearance and νµ disappearance data, the nuisance param-
eters associated with the systematic uncertainties which are common between the two data sets,
are correlated appropriately. By extrapolating from the ND to the functionally equivalent FD, the
impact of many systematic uncertainties are reduced or canceled. The one sigma uncertainty in the
predicted νe signal (background) events is shown in Fig. 8. The percentage reduction of total sys-
tematic uncertainty after the extrapolation for each component is shown in Table 1. In particular,
the variations due to uncertainties in the beam flux are almost canceled.
6Systematics and cross-checks
ν Beam NOvA Preliminary ν Beam NOvA Preliminary
Normalization Normalization
Not Extrapolated Not Extrapolated
Muon Energy Scale Muon Energy Scale
Extrapolated νe signal Extrapolated νe background
Neutron Uncertainty Neutron Uncertainty
Detector Response Detector Response
Beam Flux Beam Flux
Detector Calibration Detector Calibration
Neutrino Cross Sections Neutrino Cross Sections
Near-Far Differences Near-Far Differences
Systematic Uncertainty
ν Beam
NOvA Preliminary
Systematic Uncertainty
ν Beam
NOvA Preliminary
−20 −10 0 10 −20
20 −10 0 10 20
Normalization Signal Uncertainty Normalization
(%) Background Uncertainty (%)
Not Extrapolated Not Extrapolated
Muon Energy Scale Muon Energy Scale
Extrapolated νe signal Extrapolated νe background
Neutron Uncertainty Neutron Uncertainty
Detector Response Detector Response
Beam Flux Beam Flux
Detector Calibration Detector Calibration
Neutrino Cross Sections Neutrino Cross Sections
Near-Far Differences Near-Far Differences
Systematic Uncertainty Systematic Uncertainty
−20 −10 0 10 20−20-20
20 −10 0 10 20
Signal Uncertainty (%) Background Uncertainty (%)
Figure 8: The reduction in systematic uncertainties on the number of selected νe events due to
using the extrapolation procedure from the ND to the FD.
Table 1: The total reduction in systematic uncertainties on the number of selected νe events due to
using the extrapolation procedure from the ND to the FD.
Unextrapolated Extrapolated
Component systematic uncertainty (%) systematic uncertainty (%)
νe signal 15.9 7.9
νe background 14.5 6.0
ν̄e signal 13.9 5.9
ν̄e background 13.9 7.0
The dominant systematic uncertainties to the joint analysis are Detector Calibration, Neutrino
cross-sections, Muon energy scale, and Neutron uncertainty as shown in Fig. 9. These combine to
contribute over 95% of the uncertainty to sin2 θ23 and ∆m232 . The measurements are still dominated
by statistical uncertainties.
Calibration uncertainties were assessed by the introduction of deliberate miscalibrations to the
MC prior to reconstruction. These artificial miscalibrations take the form of an absolute calibration
7Systematics and cross-checks
NOvA Preliminary NOvA Preliminary
Detector Calibration Neutron Uncertainty
Neutrino Cross Sections Detector Calibration
Muon Energy Scale Neutrino Cross Sections
Neutron Uncertainty Muon Energy Scale
Detector Response Normalization
Normalization Detector Response
Near-Far Differences Near-Far Differences
Beam Flux Beam Flux
Systematic Uncertainty Systematic Uncertainty
Statistical Uncertainty Statistical Uncertainty
−0.05 0 0.05 −20 0 20
Uncertainty in ∆m232 (×10-3 eV2) Uncertainty in sin2θ23 (×10-3)
NOvA Preliminary
Near-Far Differences
Detector Calibration
Neutrino Cross Sections
Detector Response
Normalization
Muon Energy Scale
Beam Flux
Neutron Uncertainty
Systematic Uncertainty
Statistical Uncertainty
−0.5 0 0.5
Uncertainty in δCP/ π
Figure 9: Sources of systematic uncertainties for the oscillation parameters are shown here.
shift of all cells and a calibration shift as a function of position along cell length (separate for x and
y views). The calibration uncertainties are evaluated separately for the near and far detectors. For
this reason, the detector calibration and response systematics are increased when using the extrap-
olation method. Detector calibration and response systematics will be improved by the 2019 test
beam program which aims to improve our understanding of detector calibration and response[19].
Cross section systematics are evaluated by reweighing events in the MC. Some cross section
uncertainties come from the event reweighing tools built into GENIE[14]. Other uncertainties are
drawn from observations made by NOvA using data from the near detector as well as external
guidance from recent theory work and cross section measurements from other experiments[15].
The cross section uncertainties considered fall into three categories: primary process (quasielas-
tic scattering, resonance production, deep inelastic scattering, and concomitant nuclear effects like
multinucleon knockout), hadronization of parton-scattering processes, and final state interactions
(hadron absorption, rescattering, etc. as particles exit the nucleus). There are over 80 cross section
systematics evaluated for NOvA. The largest cross section uncertainties to the νe and νµ oscillation
analyses are used directly in the oscillation fit. The remaining cross section uncertainties are used
to generate principal components which are then used in the fit.
8Systematics and cross-checks
Principle Component Analysis (PCA) is used on NOvA to decorrelate and reduce the number
of the remaining cross section systematics. The systematics are used to create an ensemble of uni-
verses in which each systematic is shifted randomly. Each universe is broken down into samples at
the ND and the corrsponding F/N ratios. In practice, the uncertainties in the analysis are driven by
the F/N ratios used in the extrapolation. PCA is then used to break down the RMS of the universe
ensemble into principal components (PC) by diagonalizing the covariance matrix constructed from
the variance within each sample. For this analysis, the largest five PCs were used with a scale factor
to cover the RMS of the systematic universes.
PCA is also used to evaluate systematics related to operation of the beam. Two types of sys-
tematics are considered. The first account for differences between operation of the NuMI beam and
the simulation of the beam. These include the horn current and position, the target position, and the
beam spot size. The second type are uncertainties in the hadron production, pions and kaons, at the
beam target. The NuMI beam flux is tuned using the Package to Predict the FluX using external
data [12]. Both types of uncertainties are used to produce principal components in a similar manner
to be used in the fit.
On NOvA, Muon energy is reconstructed using a piecewise, linear fit between the recon-
structed length of the muon track and the true energy of the muon. A systematic was considered on
the correspondence between muon range and energy within the NOvA detectors. Both the absolute
error in each detector and the error on the ratio used in extrapolation is considered. Many sources
of uncertainty were considered, but the errors are dominated by the parameterization of the density
effect and the mass accounting in the detector.
An uncertainty in the response of the detector to neutrons is new in the antineutrino oscilla-
tions analysis. Antineutrino charge current interactions are much more likely to produce final-state
neutrons often with several hundred MeV of energy, while neutrino charged current interactions
produce final state protons. Modeling these fast neutrons is known to be challenging due to the
lack of tagged neutron data. A highly selected neutron rich ν̄µ CC Quasi-elastic like event sample
with neutron angle consistent with the QE hypothesis is selected from NOvA ND data and MC.
There is a discrepancy in the total calorimetric energy of reconstructed neutron prongs from ν̄µ
CC events shown in the left of Fig. 10. A new systematic is introduced which scales the amount
of deposited energy of some neutrons to cover the low-energy discrepancy. This scaling shifts the
mean ν̄µ energy by 1% and the mean νµ energy by 0.5% [13].
5. Cross-Checks with Muon-Removed Electron-Added Sample
The low number of νe events makes the cross-checks of the modeling of the hadronic compo-
nent in the νe signal challenging. Muon-Removed Electron-Added (MRE) is a unique data-driven
technique for this channel that uses the large statistics of the νµ CC data events in the ND data
sample. A muon-removal algorithm [16] replaces the muon in selected νµ CC events with a simu-
lated electron of the same energy in Data and Monte Carlo while preserving the nuclear/hadronic
portion of the interaction. These hybrid Data/Monte Carlo events allows us to study the impact of
9Systematics and cross-checks
NOvA Preliminary NOvA Preliminary
3000 3000
νμ CC events νμ CC events NOvA ND Data
2500 NOvA ND Data 2500
2000 Charged pion 2000 Nominal simulation
Events
Events
Muon
1500 1500 Shifted neutron response
Neutron
1000 Photon 1000
500 Proton 500
Ratio to nom.
Data / MC
1.2 1.2
1 1
0.8 0.8
0 0.1 0.2 0.3 0 0.1 0.2 0.3
Reconstructed prong energy (GeV) Reconstructed prong energy (GeV)
Figure 10: Prongs are broken down in selected ν̄µ CC events by the particle, or parent if the parent
was a neutrino, that deposited energy in the event. The selection used here is to select a neutron
rich sample.
any mis-modeling of the hadronic shower on the νe selection efficiency.
MRE event generation has three steps as shown in Fig 11:
1. Generating a muon-removed charged-current (MRCC) sample: We select the muon
track in the event using the muon PID and remove all its associated track hits. Far from
the vertex, muon track hits are clean, however, for hits close to the vertex, given that there
may be some contamination from the hadronic energy, only a minimum ionizing particle
energy (MIP) from each hit near the vertex is removed.
2. Generation of the electron: Once the muon is removed from the event, an electron with
the same starting point, direction, and reconstructed energy of the original muon track is
200 0 simulated in200its place using400the200standard
0 NOvA
600 200GEANT4
800 tool.
400
200 0
1000 600 200 800 400 1000 6
100
3. Creating a muon-removed, electron-added event: The simulated electron hits are overlaid
100 100
x (cm)
x (cm)
x (cm)
with the hits of the MRCC event and the NOvA reconstruction algorithm runs from the
0
beginning. 0 0
νμ CC event Muon removed CC event 50
MRE event
50 50
y (cm)
y (cm)
y (cm)
0 0 0
- 50 - 50 - 50
-100 -100 - 100
0 200 400 0 600 200 800 400 0 1000 600 200 800 400 1000 6
z (cm) z (cm)
NOvA - FNAL E929 NOvA - FNAL E929 NOvA - FNAL E929
10 2
The ND candidate data νµ -CC1010 event
hits
2
hits
hits
hits
hits
10
Figure 11: Muon-removed
Run: 10677 / 10
10
Event: 1306008 / --
electron-added technique.
10 Run: 10677 / 10
Event: 1306008 / --
is shown Run: 10677 / 10
Event: 1306008 / --
1 11 11
UTC Tue Jan 13, 2015
at the left, the muon-removed
UTC Tue Jan 13, 2015
218
07:10:15.717184320
220 222 CC
224 event
226 is shown10218in middle,
228
t (µsec)
220 10 and
222 224the 226
muon-removed
UTC Tue Jan 13, 2015
10 228
µsec)
07:10:15.717184320
qt ((ADC)
218
10 simulated
220 222
10 2 3
07:10:15.717184320 2 224 226 3
10
228
µsec)
tq((ADC)
electron (with same energy and direction) replaced event display is shown at the right.
10Systematics and cross-checks
NOvA Preliminary NOvA Preliminary
1 1
Data Neutrino beam Data Antineutrino beam
0.8 MC 0.8 MC
Efficiency
Efficiency
0.6 0.6
0.4 0.4
0.2 0.2
0 0
0 1 2 3 4 0 1 2 3 4
Calorimetric energy (GeV) Calorimetric energy (GeV)
Figure 12: The PID selection efficiency as a function of calorimetric energy is shown.
The CVN νe and ν̄e events selection efficiencies in Data and Monte Carlo with respect to the
pre-selection are compared in Fig 12 using the CVN νe selection efficiency on the calorimetric
energy (at the left for νe and at the right for ν̄e ). The data and MC total efficiencies agree at the 2%
level for MRE events both in neutrino and antineutrino beams.
6. Cross-Check using Muon Removed Bremsstrahlung Showers
The νe (ν̄e ) events are identified by the electromagnetic showers induced by e− , or e+ , in the
final state interactions. The NOvA FD sits on the surface, but it is covered by 3 m of barite rock
and concrete which provides an overburden of more than ten radiation lengths to reduce back-
ground from cosmic rays. Still, there is a high rate (148 kHz) of cosmic muons observed in the
FD. These muons can induce EM showers by three different means: energetic muons undergoing
bremsstrahlung radiation (Brem), muons decaying into electrons in flight (DiF), and muons stop-
ping in the detectors and decaying into Michel electrons. Michel electrons typically have energies
much smaller than νe events, which have energies of 0.5 GeV - 4 GeV, and have instead been used
as a calibration check. Brem and DiF, on the other hand, provide abundant EM showers in the
few-GeV energy region. A pure sample of EM showers is obtained from cosmic data through a
modified EM shower filtering algorithm [17] from the Muon-Removal (MR) algorithm [16] for
charged current events. This sample can be used to characterize the EM signature and provide
valuable cross-checks of the MC simulation, reconstruction, CVN algorithms, and calibration of
the FD [17]. The results shown in this section are from Brem showers only. DiF events requires
additional event selections which gives lower statistics, but more pure EM samples, and are not
included in this section.
The EM shower filtering algorithm first looks at events for a cosmic EM shower, which has a
muon track inside the EM shower region. Then, the MR algorithm removes hits that belong to
the muon corresponding to the energy of a MIP in the shower region and saves the remaining EM
showers as raw DAQ hits. An example EM shower event display before and after MR from FD
cosmic data is shown in Fig. 13. The shower digits can then be put into standard νe reconstruction
11Systematics and cross-checks
and PID algorithms. Data and MC comparison is performed with reconstructed shower variables
and PID outputs to validate EM shower modeling and PID. Calibration effects can be checked by
comparing PID efficiencies as a function of vertex position.
Brem shower Brem shower
Figure 13: Bremsstrahlung shower from cosmic moun before (left) and after (right) muon removal.
×10
3 NOvA Preliminary ×10
3 NOvA Preliminary
600 3000
Cosmics Data Cosmics Data
500 2500
Cosmics MC Cosmics MC
400 νe signal MC 2000 νe signal MC
Events
Events
300 νe selection -- core sample 1500 νe preselection -- core sample
200 1000
100 500
0 0
0 1 2 3 4 5 0 0.2 0.4 0.6 0.8 1
Shower Energy (GeV) Cos(θbeam)
Figure 14: Brem shower energy vs νe shower energy is shown on left, and the comparison of
shower angle cos(θbeam ) is shown on right.
MR Brem Shower extraction takes place through the following steps:
1. Muon track selection: Apply selections to search for a cosmic muon candidate in the FD.
A muon track should be long enough to generate bremsstrahlung showers, thus require the
number of planes that the muon track traverses to be greater than 30. The muon track is also
required to be in the horizontal direction requiring cosθ > 0.5, where θ is the angle of the
muon track with respect to the beam axis (Z-axis).
2. Shower finding: The shower region is found within the muon track candidate. The shower
region is determined by measuring the energy deposition per plane (dE/dx) information.
3. Muon removal: Once the EM showers are identified, muon hits are removed to get EM
shower events.
4. Shower Reconstruction and PID: The EM shower events are fed into standard νe recon-
struction and PID algorithms.
12Systematics and cross-checks
NOnA Preliminary
0.8
Cosmics Data
0.6 Cosmics MC
Neutrino Beam
Efficiency
0.4
0.2
0
0 1 2 3 4 5
1.5 Shower Energy (GeV)
1
Data
MC
0.5
0
0 1 2 3 4 5
Shower Energy (GeV)
Figure 15: The PID selection efficiency as a function of EM showers energy is shown.
Reconstructed shower energy and angle comparison for Brem showers and νe signal induced EM
showers are shown on top plots of Fig. 14. The main differences between νe signal and Brem sam-
ple is that beam-related νe energy peaks at 2 GeV and its direction is along the NuMI beam line
direction whereas cosmic EM shower is mostly coming from vertically into the FD. As a result the
CVN selection efficiency is low for muon removed brem showers. To correct this, we reweigh the
Brem sample according to νe signal angle to resemble the sample.
The CVN νe and ν̄e event selection efficiencies with respect to the pre-selection are calcu-
lated to compare Brem data and cosmic simulation. The CVN selection efficiency of EM shower
energy in νe and ν̄e events is shown in left and right of Fig 15, respectively. The Data and MC
CVN selection efficiency in core sample agrees well within 6% (3%) level in neutrino (antineu-
trino) mode. Efficiency of data and simulated Brem showers agrees within the total extrapolated
systematic uncertainties shown in Fig. 8 for neutrino and antineutrino datasets.
7. Summary and Conclusions
NOvA has analyzed it’s first 6.9 × 10²⁰ POT antineutrino data together with that of it’s 8.85 ×
1020 POT neutrino data to set new constraints on neutrino oscillation parameters, and observed
> 4σ evidence of ν̄e appearance. The study of systematic uncertainties and muon-removed cross-
checks are crucial elements of this analysis. The efficiency agrees between data and MC at the 2%
level for MRE events both in neutrino and antineutrino beam modes and the efficiency of data and
simulated MRBrem showers agrees within systematics for neutrino and antineutrino datasets.
13Systematics and cross-checks
8. Acknowledgments
This work was supported by the US Department of Energy; the US National Science Foun-
dation; the Department of Science and Technology, India; the European Research Council; the
MSMT CR, Czech Republic; the RAS, RMES, and RFBR, Russia; CNPq and FAPEG, Brazil; and
the State and University of Minnesota. We are grateful for the contributions of the staffs at the
University of Minnesota module assembly facility and Ash River Laboratory, Argonne National
Laboratory, and Fermilab. Fermilab is operated by Fermi Research Alliance, LLC under Contract
No. De-AC02-07CH11359 with the US DOE.
References
[1] D. S. Ayres et al., The NOvA Technical Design Report, FERMILAB-DESIGN-2007-01 (2007)
[2] D. S. Ayres et al., NOvA: Proposal to build a 30 kiloton off-axis detector to study νµ → νe oscillations
in the NuMI beamline, arXiv:0503053v1 [hep-ex] (2004)
[3] Sanchez, Mayly, NOvA Results and Prospects, doi:10.5281/zenodo.1286758,
https://doi.org/10.5281/zenodo.1286758, (2018)
[4] S. Mufson et al., Nucl. Instrum. Meth. A 799, 1 (2015) doi:10.1016/j.nima.2015.07.026
[arXiv:1504.04035 [physics.ins-det]].
[5] Mendez, Diana P., First νµ + ν̄µ Disappearance Results from the NOvA experiment,
doi:10.5281/zenodo.1300655, https://doi.org/10.5281/zenodo.1300655, (2018)
[6] Ashley, Back, Liudmila, Kolupaeva, NOvA joint νe + νµ oscillation results in neutrino and antineutrino
modes, doi:10.5281/zenodo.1300928, https://doi.org/10.5281/zenodo.1300928 (2018)
[7] P. Adamson et al. [NOvA Collaboration], “Constraints on Oscillation Parameters from νe Appearance
and νµ Disappearance in NOvA,” Phys. Rev. Lett. 118, no. 23, 231801 (2017)
doi:10.1103/PhysRevLett.118.231801 [arXiv:1703.03328 [hep-ex]].
[8] A. Aurisano et al., “A Convolutional Neural Network Neutrino Event Classifier,” JINST 11, no. 09,
P09001 (2016) doi:10.1088/1748-0221/11/09/P09001 [arXiv:1604.01444 [hep-ex]].
[9] Fernanda, Psihas, Micah, Groh, Neutrino physics with deep learning. Techniques and applications on
NOvA, doi:10.5281/zenodo.1300908, https://doi.org/10.5281/zenodo.1300908, (2018)
[10] L. Suter [NOνA Collaboration], “Extrapolation Techniques and Systematic Uncertainties in the
NOνA Muon Neutrino Disappearance Analysis,” arXiv:1511.00181 [hep-ex].
[11] Shiqi, Yu, NOSEK, Tomas, Data-driven Techniques for νe Signal and Background Predictions in
NOνA, doi:10.5281/zenodo.1300918, https://doi.org/10.5281/zenodo.1300918 (2018)
[12] L. Aliaga et al. [MINERvA Collaboration], Phys. Rev. D 94, no. 9, 092005 (2016) Addendum: [Phys.
Rev. D 95, no. 3, 039903 (2017)] doi:10.1103/PhysRevD.94.092005, 10.1103/PhysRevD.95.039903
[arXiv:1607.00704 [hep-ex]].
[13] Alion, Tyler, Systematic Uncertainties in the NOvA νµ - Disappearance Analysis,
doi:10.5281/zenodo.1289274, https://doi.org/10.5281/zenodo.1289274, (2018)
[14] C. Andreopoulos et al., Nucl. Instrum. Meth. A 614, 87 (2010) doi:10.1016/j.nima.2009.12.009
[arXiv:0905.2517 [hep-ph]].
14Systematics and cross-checks
[15] Aaron, Mislivec, Jeremy, Wolcott, Neutrino Interaction Model Tuning at NOvA,
doi:10.5281/zenodo.1300588, https://doi.org/10.5281/zenodo.1300588, (2018)
[16] K. Sachdev, “A Data-Driven Method of Background Prediction at NOvA,” arXiv:1310.0119 [hep-ex].
[17] H. Duyang [NOvA Collaboration], “Cosmic Ray Induced EM Showers in the NOvA Detectors,”
arXiv:1511.00351 [physics.ins-det].
[18] V. Shiltsev, “Fermilab Proton Accelerator Complex Status and Improvement Plans,” Mod. Phys. Lett.
A 32, no. 16, 1730012 (2017) doi:10.1142/S0217732317300129 [arXiv:1705.03075 [physics.acc-ph]].
[19] Junting, Huang, Karol, Lang, The NOvA Test Beam Program, doi:10.5281/zenodo.1300576,
https://doi.org/10.5281/zenodo.1300576, (2018)
15You can also read


