On the impact of policy measures on cars' CO 2 emissions in the EU - eceee
←
→
Page content transcription
If your browser does not render page correctly, please read the page content below
On the impact of policy measures on
cars’ CO2 emissions in the EU
Amela Ajanovic Franz Wirl
Energy Economics Group Department of Economics
Vienna University of Technology University of Vienna
Gusshaussstr. 25-27/370-2 Vienna, Austria
Vienna, Austria franz.wirl@univie.ac.at
ajanovic@eeg.tuwien.ac.at
Reinhard Haas
Energy Economics Group
Vienna University of Technology
Gusshaussstr. 25-27/370-2,
Vienna, Austria
haas@eeg.tuwien.ac.at
Keywords
cars, emissions, transport policies and measures rebound effect without hurting car drivers due to service
vkm driven remaining at same service price. The fuel tax
should compensate the standard to an extent so that fi
Abstract nally the service price before and after policy introduction
Reducing CO2 emissions from cars is essential in order to cur remains the same. Yet, because registration taxes work as
tail global temperature increases. In this paper we analyze how standards, a fuel tax must also accompany an intended in
the following measures contribute to reducing CO2 emissions: troduction of registration taxes.
(i) voluntary agreements with car manufacturers; (ii) man
datory standards on specific CO2 emissions; (iii) fuel taxes;
(iv) registration taxes; (v) subsidies. Our core objectives are:
Introduction
(i) to provide a survey on the implementation of these policy
The transport sector, which is primarily based on fossil en
measures for car transport in EU countries; (ii) to analyze their
ergy, is the second biggest source of greenhouse gas emissions
impact on energy consumption and CO2 emissions, and (iii) to
(GHG) in the EU-28, see Figure 1. The second largest part of
extract the most promising policies to reduce emissions. The
these emissions is caused by road transport. Road transport
approach builds on a formal framework based on the decom
contributes about one-fifth of the EU’s total emissions of car
position of energy into service and intensity and on conducting
bon dioxide (CO2).
econometric analyses for energy consumption as well as kilo
This is a key reason while over the last decade different policy
meters driven. The major results and conclusions are:
measures have been implemented on road transport, especially
• Despite the fact that there are many parameters that con on car passenger transport. The most important implemented
stitute a formal framework to explain energy consumption measures are fuel taxes, registration taxes, ownership taxes, and
and CO2 emissions, there is one key parameter which in CO2 standards for new cars. In spite of implemented policies
fluences final CO2 emissions and this is the service price emissions from road transport were continuously increasing
elasticity. Our results for the service price elasticity of car until 2007. A slight reduction can be noticed starting from 2008
driving in Europe are about -0.4 to -0.45; partly also due to the economic crisis, see Figure 2.
The objective of this paper, which builds on Ajanovic and
• The service price elasticity impacts fuel taxes, standards as
Haas (2014), is to discuss advantages and problems related to
well as registration taxes;
the implemented policy measures. In this paper we will (i) pro
• This result leads to the situation that a mix of policies is vide a survey of policy measures in car transport in EU coun
preferable. A combined tax-standard policy will lead to a tries; (ii) analyse their impact on energy consumption and CO2
win-win situation for the environment and car drivers. A emissions, and (iii) extract the most promising policies to re
simultaneously introduced fuel tax will compensate for the duce emissions.
ECEEE SUMMER STUDY PROCEEDINGS 783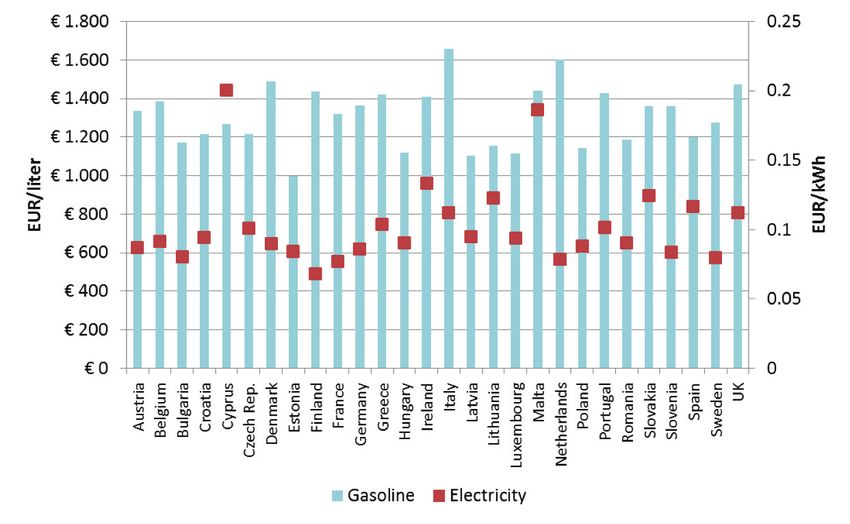
4-109-15 AJANOVIC ET AL 4. MOBILITY, TRANSPORT, SMART & SUSTAINABLE CITIES
countries, the car ownership level was increasing. However,
there are significant differences between EU countries (e.g. in
2011 the lowest car stock per capita was in Spain, 0.36, and
highest in Italy, 0.62). In some countries such as France, Fin
land and Spain stock of cars per capita is stable over the last
few years.
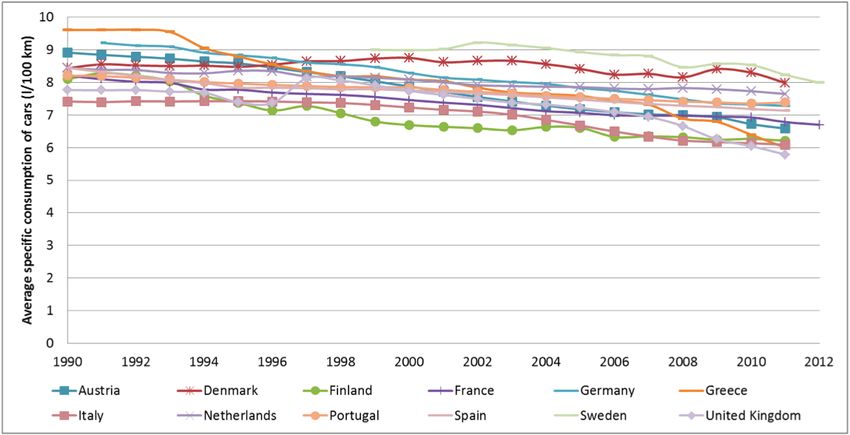
Due to the implemented policy measures in the EU, aver
age specific energy consumption of cars has been reduced in
the last decade. In 1990 average fuel intensity of passenger cars
in analysed countries was between about 7.5 and 9.5 litres per
100 kilometres. Already in 2010 fuel intensity is in the range
between 5.8 and 8.3 l/100 km, see Figure 4. However, the fuel
intensity shown in Figure 4 is distorted because intensity has
been diluted by more powerful cars leading to lower reduction
of energy consumption per km driven, Ajanovic/Haas (2014a).
Impact of car size on fuel intensity is analysed by Ajanovic et
al. (2012).
Figure 1. GHG emissions by sectors, EU-28, (Data source: EC, European CO2-emission targets for new passenger cars have
2014). significantly contributed to emission reduction in the last dec
ade. Figure 5 shows the development of CO2 emissions of new
passenger cars for the period 1995–2012. In all analyzed coun
Major developments in car transport in the EU tries, considerable emissions reductions have been achieved.
The largest part of the total GHG emissions from road transport In 1995 average emissions of new cars have been in the range
is due to cars. Although the fuel efficiency of passenger cars has of 224 (Sweden) and 175 (Spain) gCO2/km. In 2012, the lowest
significantly improved in the last decade, trends towards more emissions were seen in Portugal (117 gCO2/km) and highest in
powerful vehicles and additional services in cars have reduced Germany (142 gCO2/km). The strongest decrease can be no
the possible benefits of fuel efficiency improvements. At the ticed after 2008, (Ajanovic/Haas 2014a).
same time, the vehicle ownership level is continuously increas
ing in all EU countries. These developments have significant
impacts on the EU’s progress in cutting overall GHG emissions. Implemented policy measures in EU countries
In this section the major recent developments in car trans In this paper we analyze the following policy measures imple
port are documented for twelve EU countries: Austria, Den mented in EU countries which can contribute to reducing CO2
mark, Finland, France, Germany, Greece, Italy, The Nether emissions: (i) voluntary agreements with car manufactures;
lands, Portugal, Spain, Sweden and United Kingdom. (ii) mandatory standards on specific CO2 emissions; (iii) fuel
Firstly, car ownership trends (stock of passenger cars per taxes; (iv) registration taxes; (v) subsidies/incentives for electric
capita) are shown in Figure 3 for the period 1990–2012. In all vehicles.
Figure 2. Development of GHG emissions in EU-28 countries (1990=1), (Data source: EC, 2014).
784 ECEEE 2015 SUMMER STUDY – FIRST FUEL NOW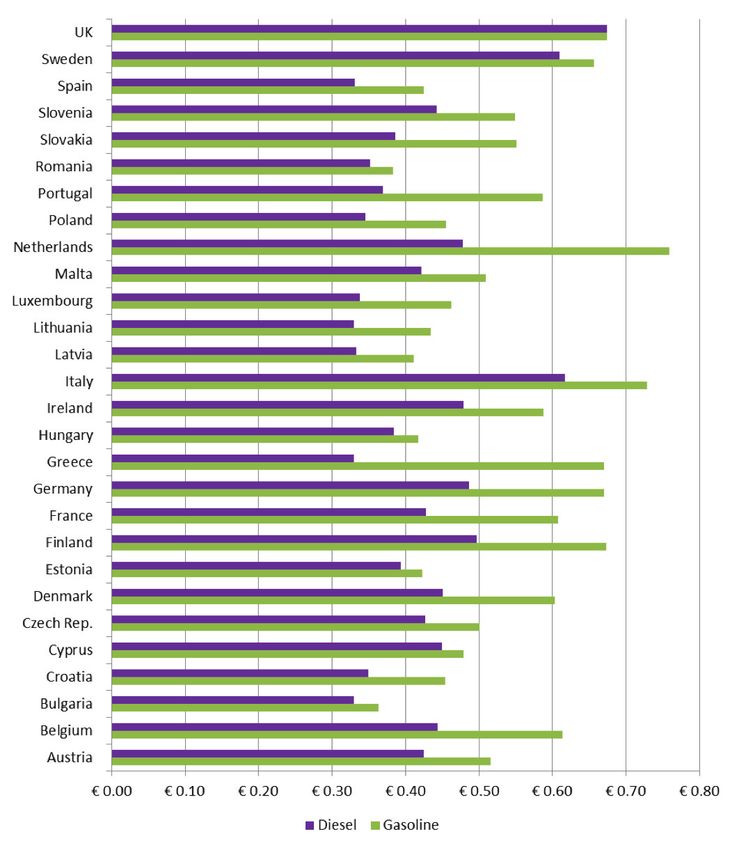
4. MOBILITY, TRANSPORT, SMART & SUSTAINABLE CITIES                                                     4-109-15 AJANOVIC ET AL

Figure 3. Stock of passenger cars per capita (Data source: ODYSSEE Database).

Figure 4. Average fuel intensity of passenger cars (Data source: ODYSSEE Database).

Figure 5. Average CO2 emissions of new passenger cars (Data source: ODYSSEE Database).

                                                                                         ECEEE SUMMER STUDY PROCEEDINGS   785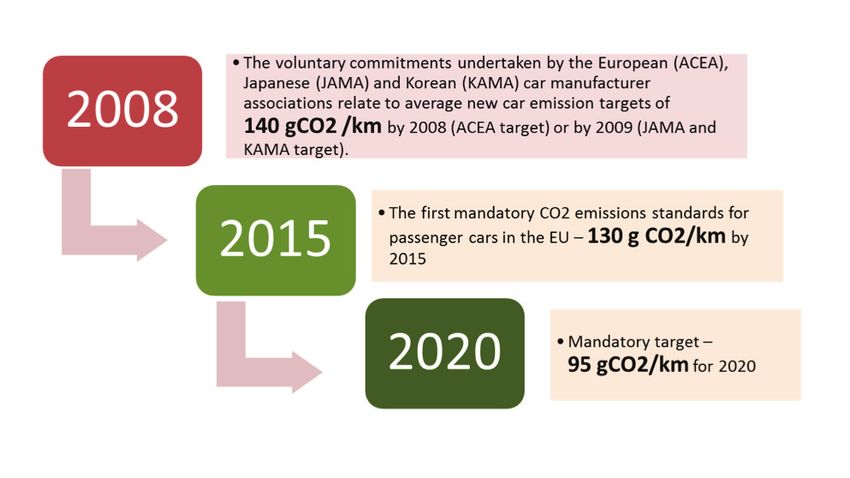
4-109-15 AJANOVIC ET AL 4. MOBILITY, TRANSPORT, SMART & SUSTAINABLE CITIES STANDARDS FOR CO2 EMISSION OF NEW PASSENGER CARS of grams per kilometre (g/km) that an average vehicle regis Unlike taxes and subsidies/initiatives which are set on the local/ tered by the manufacturer is above the target, multiplied by the national, standards for CO2 emissions of new cars are deter number of cars registered by the manufacturer. A premium of mined at the EU level, and car manufacturers must meet the EUR 5 per car registered will apply to the first g/km above the standards or pay penalties for noncompliance, see EU Regu target, EUR 15 for the second g/km, EUR 25 for the third g/km, lation (EC, 2009). According to the Regulation, average CO2 and EUR 95 for each further g/km. From 2019 every g/km of emissions from cars should not exceed 130 grams CO2 per exceedance will cost EUR 95 (EU, 2014). km by 2015 and should drop further to 95 g/km by 2020. The Monitoring reports have already showed significant improve 130 grams target will be phased in between 2012 and 2015. ment of CO2 emissions on new passenger cars, see Figure 7. At first, agreements with car manufacturers were on a vol untary basis. However, since the initial target of 140 gCO2/km PASSENGER CAR TAXATION for 2008 was not met on time (the average for the whole car According to ACEA (2014) there are three major categories market for 2008 was 153.7 g/km), in 2009 the first mandatory of passenger car taxation: (i) taxes on acquisition, (ii) taxes CO2 emission standards for cars were adopted in the EU (de on ownership, and (iii) taxes on motoring. In addition Value Wilde and P. Kroon, 2013), see Figure 6. The target for 2015 Added Tax (VAT) is also applied to all taxes in the range of 18 % is 130 gCO2/km, and for 2020 95 gCO2/km. In practice this to 25 % across EU countries. means that each manufacturer gets an individual annual target A tax on acquisition is a tax paid once, by each vehicle owner, based on the average mass of all its new cars registered in the for each vehicle purchased and entered into service. This tax is EU in a given year. Since targets for 2015 and 2020 are manda also called sales tax or registration tax. The criteria for acquisi tory, manufacturers will have to pay penalties if their average tion taxes are different across EU Member States. Most of the emission levels are above the target set by the limit value curve. criteria are based on fuel consumption, cylinder capacity, CO2 The penalties will be based on the calculation of the number emissions and price. Figure 6. Emission targets for new passenger cars in the EU up to 2020 (Ajanovic and Haas, 2014a). Figure 7. Evolution of CO2 emissions from new passenger cars by fuel in EU-27 (Data source: EEA, 2014). 786 ECEEE 2015 SUMMER STUDY – FIRST FUEL NOW
4. MOBILITY, TRANSPORT, SMART & SUSTAINABLE CITIES 4-109-15 AJANOVIC ET AL
Figure 8. Excise duties on gasoline and diesel (Data source: EEP, 2013).
Taxes on ownership are paid annually, regardless of how of In spite of supporting policies, at the end of 2012 the global
ten the vehicle is used. These taxes are mostly based on CO2 stock of rechargeable electric cars – battery electric vehicles
emissions, weight, cylinder capacity, power and fuel consump (BEV), range extenders (REX) and plug-in electric vehicles
tion. Also this tax is not applied in all countries (e.g. Czech – was circa 180,000, representing just 0.02 % of the total pas
Republic, Estonia, France, Lithuania, Poland and Slovakia). senger car stock (IEA, 2013). The share of rechargeable elec
Taxes on motoring are taxes on fuels. The different excise tric vehicles in the total EVs stock is just 5 %, 95 % of all EVs
duties on gasoline and diesel in EU countries are shown in Fig are non-rechargeable hybrid electric vehicle (HEV) (Ajanovic,
ure 8. 2015).
Figure 9 shows market share of pure battery electric vehicles.
SUBSIDIES AND TAX INCENTIVES FOR ELECTRIC VEHICLES In all analyzed countries the share is very low, under 1 %. In
One possibility to reduce CO2 emissions is to increase the use 2013 the highest market share in the EU was in the Nether
of alternative fuels and alternative automotive technologies. In lands (0.83 %) followed by France (0.79 %). This is relatively
recent years a major focus was put on biofuels. However, rela low compared to Norway (5.75 %).
tively moderate environmental benefits of biofuels and compe The plug-in hybrid market share in 2013 was the highest in
tition with food production, have made 1st generation biofuels the Netherlands with 4.72 %, followed by Sweden (home of the
less attractive than initially presumed. popular Volvo V60 plug-in hybrid) 0.41 %, see Figure 9.
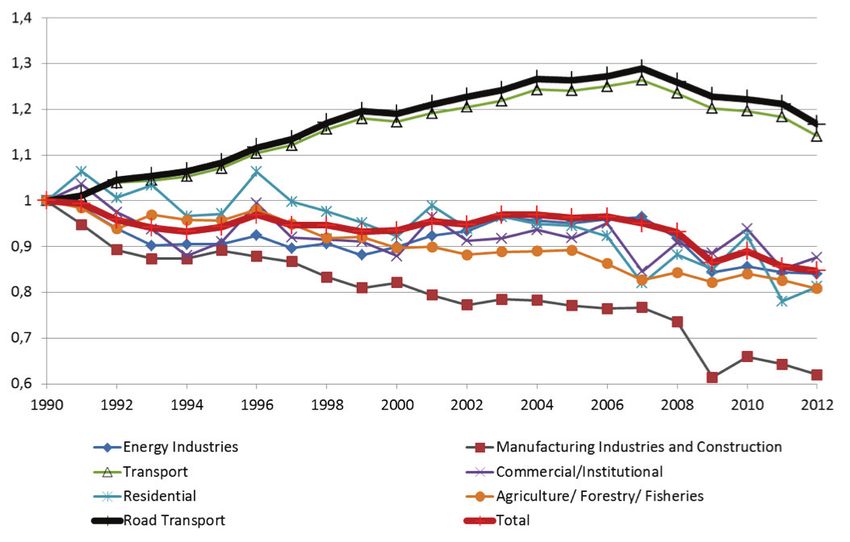
In recent years interest in electric vehicles has significantly Acceptance of electric vehicles is dependent on the sup
increased. This increase is due to improvements in the technol porting policy measures which have been implemented but
ogy as well as purchase and tax incentives for electric vehicles also on prices of electricity and fossil fuels. The countries with
which have been implemented in many EU countries. low electricity price and high gasoline price (e.g. the Neth
Table 1 provides an overview of the incentives for the pur erlands) are basically more interested in electric vehicles.
chase and use of electric vehicles which are currently imple Figure 10 shows differences in gasoline and electricity prices
mented in some EU countries. across the EU.
ECEEE SUMMER STUDY PROCEEDINGS 787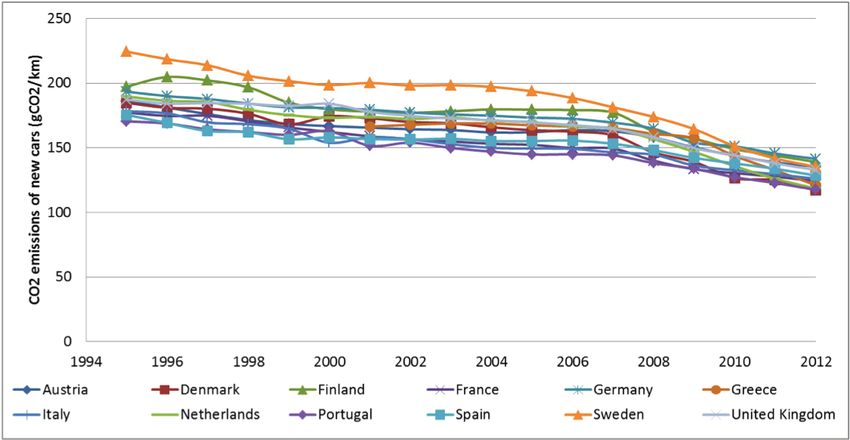
4-109-15 AJANOVIC ET AL                                                               4. MOBILITY, TRANSPORT, SMART & SUSTAINABLE CITIES

Table 1. Incentives (ACEA, 2014).

  Country                                                    Incentives
 AT              Electric vehicles are exempt from the fuel consumption tax and from the monthly vehicle tax.

 DE              Electric vehicles are exempt from the annual circulation tax for a period of ten years from the
                 date of their first registration.

 FI              Electric vehicles pay the minimum rate (5 %) of the CO2 based registration tax.

 FR              Hybrid vehicles emitting 110 g/km or less of CO2 benefit from a premium of €3,300.
                 Electric vehicles are exempt from the company car tax. Hybrid vehicles emitting less than
                 110 g/km are exempt during the first two years after registration.

 DK              Electric vehicles weighing less than 2,000 kg are exempt from the registration tax. This
                 exemption does not apply to hybrid vehicles.

 GR              Electric and hybrid vehicles are exempt from the registration tax, the luxury tax and the luxury
                 living tax. Electric passenger cars and hybrid passenger cars with an engine up to 1,929 cc,
                 are exempt from the circulation tax.
                 Hybrid cars with a higher engine capacity pay 50 % of the normal circulation tax rate.

 IT              Electric vehicles are exempt from the ownership tax for a period of five years from the date of
                 their first registration. After this fiveyear period, they benefit from a 75 % reduction of the tax
                 rate applied to
                 equivalent petrol vehicles in many regions.

 NL              Electric vehicles are exempt from the registration tax. Other vehicles including hybrid vehicles
                 are also exempt from the registration tax if they emit maximum 85 g/km (diesel) or 88 g/km
                 (petrol) of CO2 respectively.

 PT              Electric vehicles are exempt from the registration tax ISV and from the annual circulation tax.
                 Hybrid vehicles benefit from a 50 % reduction of the registration tax.

 ES              None

 SE              Five year exemption from paying annual circulation tax: Electric vehicles with an energy
                 consumption of 37 kWh per 100 km or less are exempt from the annual circulation tax for a
                 period of five years from the first registration. The same five year exemption applies to electric
                 hybrid and plugin hybrid vehicles that fulfill the new green car definition applied for new
                 registrations from 1 January 2013.
                 Moreover, for both electric cars and plugin hybrids the electrical energy consumption per
                 100 km must not exceed 37 kWh to be regarded as a green car.
                 Reduction of company car taxation: For electric and plugin hybrid vehicles, the taxable value
                 of the car for the purposes of calculating the benefit in kind of a company car under personal
                 income tax is reduced by 40 % compared with the corresponding or comparable petrol or
                 diesel car. The maximum reduction of the taxable value is SEK 16,000 per year.
                 Super green car premium new cars: A so called subsidy “Super green car premium” of
                 SEK 40,000 is available for the purchase of new cars with CO2 emissions of maximum
                 50 g/km. The premium is applied both for the purchase by private persons and companies.
                 For companies purchasing a super green car, the premium is calculated as 35 % of the price
                 difference between the super green car and a corresponding petrol/diesel car, with a
                 maximum of SEK 40,000. The premium will be paid for a total of maximum 5,000 cars.

 UK              Purchasers of electric vehicles and plugin hybrid vehicles with CO2 emissions below 75 g/km
                 receive a premium of £5,000 (maximum) or 25 % of the value of a new car or £8,000
                 (maximum) or 20 % of the value of a new LCV meeting eligibility criteria (for example,
                 minimum range 70 miles for electric vehicles, 10 miles electric range for plugin hybrid
                 vehicles).
                 Electric vehicles are exempt from the annual circulation tax. This tax is based on CO2
                 emissions and all vehicles with emissions below 100 g/km are exempt from it.
                 Electric cars are exempt from company car tax until April 2015 and electric vans are exempt
                 from the van benefit charge until that date too.
                 Electric vehicles and other vehicles emitting less than 95 g/km of CO2 can claim a 100 % first
                 year allowance for depreciation.

788 ECEEE 2015 SUMMER STUDY – FIRST FUEL NOW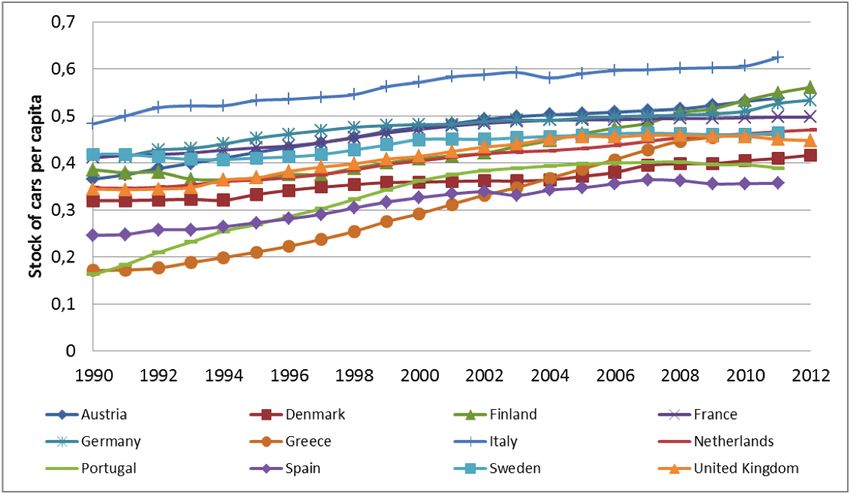
4. MOBILITY, TRANSPORT, SMART & SUSTAINABLE CITIES 4-109-15 AJANOVIC ET AL
Figure 9. Share of electric vehicles (Data source: Shahan, 2014).
Figure 10. Prices of gasoline and electricity by country (Data sources: EEP, 2013;WB, 2014).
Impact of policy measures on reduction of CO2
emissions
To analyse the impact of various policies on overall CO2 emis energy service (vkm) can be defined in a technical way as a
sions, a formal framework based on technical relations between function of the energy input (E) needed to provide energy ser
CO2 emissions, energy and service demand is used. It builds vice and the efficiency (η) of the technology which facilitates
on work by Wirl (1992), Walker/Wirl (1993), Haas (2009) and the required services, see Wirl (1993). Based on contributions
Ajanovic/Haas (2014b). by Walker/Wirl (1993) and Haas et al (2009) vkm in a technical
The basic presumption is that consumers do not demand definition is:
energy or technology per se, but energy services (S), in this
case mobility – vehicle kilometres driven (vkm). They enjoy vkm = f ( E ,η (T )) (1)
utility from consuming a particular service, which is in general
where E is energy, and η(T) is the efficiency of the technology.
provided by combining different inputs of energy, technology,
More precisely Eq. (1) defines that the service mobility (vkm)
human and physical capital, and environment (including natu
is provided by the input of energy and technology. If there are
ral resources). Given the fact that human and physical capital is
no congestion limits Eq. (2) can be simplified as:
largely accumulated in the technical efficiency of the technolo
gies used, conversion technologies as well as infrastructure, the vkm = E ⋅η (T ) (2)
ECEEE SUMMER STUDY PROCEEDINGS 789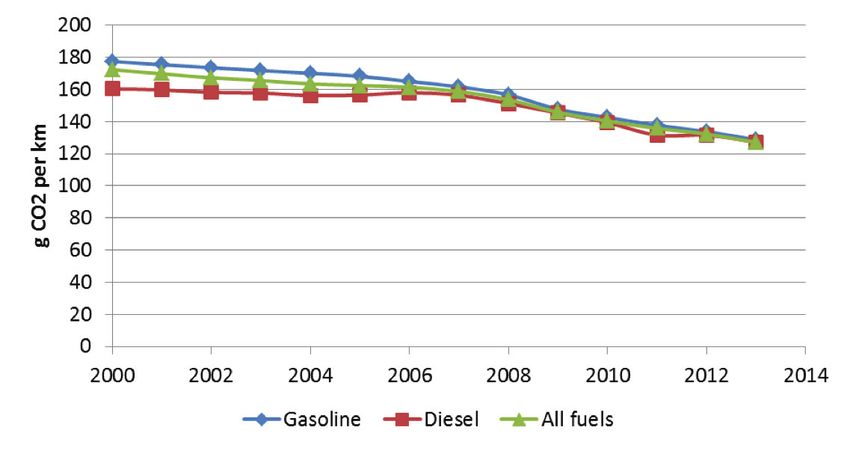
4-109-15 AJANOVIC ET AL 4. MOBILITY, TRANSPORT, SMART & SUSTAINABLE CITIES
Instead of efficiency η(T), its inverse, fuel intensity (FI) is often more or less than lower or higher energy service prices and
used. Total energy used which is mostly dependent on fuel in income. The impacts on vkm driven is analysed in Ajanovic/
tensity of cars and number of kilometres driven per year (vkm) Haas (2012) by applying a cointegration approach to the fol
can then be written as: lowing model:
E = vkm ⋅ FI (3) ln vkmt = C + α s ln PSt + β ln Yt (9)
Emissions from passenger cars depend, in principle, on total
Where C is intercept, vkm is service demand (e.g. vehicle km
energy used in cars as well as on the type of energy used. Dif
driven in year t), Ps is weighted average price of service (calcu
ferent fuels (e.g. gasoline, diesel, biofuels, etc.) have different
lated by means of weighted fuel prices), and Y is real private
specific CO2 emissions coefficients. The average specific CO2
final consumption expenditures.
emissions coefficient (fCO ) can be improved with better quality
2 The most interesting coefficients are the energy service price
fossil fuels, higher share of biofuels with better ecological per
elasticities – αS – because they contain information on the im
formance, more electricity from renewable energy sources, etc.
pact of both price and efficiency.
CO2 emissions (CO2) from passenger cars can be described as:
Empirical analyses of the magnitude of price elasticities
have been conducted in many papers, e.g. Dahl (2012), Dargay
CO2 = E ⋅ f CO 2 = vkm ⋅ FI ⋅ f CO 2 = vkm ⋅ CO2 _ SP (4)
(1993) and Goodwin et al. (2004). Investigations conducted by
the authors of this paper – see e.g. Ajanovic/Haas 2010, 2011
where CO2_SP is specific CO2 emissions in kg CO2/km.
and 2012 – have resulted in long-term service price elasticities
To understand how policies work we have to know how
of about (-0.4) to (-0.45). Related to the above reflections this
consumers make decisions. In principle, consumers try to
leads to the following interpretations: the increase in fuel prices
maximize the benefits they enjoy from the consumption of a
due to a fuel tax of 1 % would result in energy savings of about
specific service or good and to minimize the monetary and
0.4 % to 0.45 %. With a standard which decreases CO2 emis
other efforts related to the consumption of this good or service,
sions by 1 % the savings would be between 0.55 % and 0.6 %.
see Wirl (1992) and Walker/Wirl (1993).
About the same effect would result from a CO2-dependent reg
Consumer decisions can be affected by policy measures,
istration tax.
e.g. fuel tax (τf), efficiency standards (η*) and registration
The principle of how changes in prices, due to taxes, affect
tax (τR). Basically, consumers strive for service demand, and
energy consumption is depicted in Figure 11. For a fuel tax
service demand depends on energy service price (Ps), income
the reduction in energy consumption ΔEτ results from higher
(Y), investment costs (IC) and quality (q) from other possible
service price Ps remaining on the same efficiency level of the
attributes (x): 2τ
technology used – curve η0.
S = f ( Ps , Y , IC, q( x)) (5) Due to the implementation of mandatory CO2 emissions
standards, cars are expected to become more energy efficient
However, the impact of quality q(x) is neglected in this paper. – to consume less fuel per km driven.
In the short-term service demand – in this case vkm – can be Also a CO2 based registration tax leads to the purchase of
described as: more energy efficient cars with lower specific CO2 emissions
per km driven. The higher the registration tax, the lower are
vkm = f ( PS , Y ) (6) the specific CO2 emissions of the average car sold. For every
required emission standard, a corresponding registration tax
with (τR_CO *) could be implemented to meet this standard and vice
2
versa. It should be noted that the relationship between a regis
Ps = Pf ⋅ FI (7) tration tax and the specific CO2 emissions will also depend on
the elasticity of investment costs (γ).
This service price can be changed with policies: A high registration tax will lead to the purchase of cars with
lower specific CO2 emissions. Cars with lower specific CO2
• by raising the fuel tax τf which increases Pf and consequently
emissions have lower fuel intensity. If we introduce specific
Ps or
CO2 emissions the corresponding fuel intensity (FI*) will affect
• by reducing fuel intensity by means of a standard (FI*) service price Ps:
which decreases Ps *
PS = ( Pf + τ f ) ⋅ FI * (10)
* *
P = ( Pf + τ f ) ⋅ FI
S (8) Where FI* is a function of specific CO2 emissions: FI*=f(CO2_SP*)
Since FI*=f(CO2_SP*) and CO2_SP*=f(τR_CO2*) this leads to the
The level of short-term service demand with respect to kilo
following reflections:
metres driven depends on available income (Y)1 and the ser
vice price of a km driven (PS). In other words we assume that PS* = PS (τ f ,τ R* _ CO2 ) (11)
once a car is purchased there are no other attributes for driving
Therefore, the service price does not just depend on the fuel tax
τf but also on the registration tax τR_CO2.
1. Note, that further on in the empirical analyses of this paper we use Private
Consumption Expenditures (PCE) as a proxy for income.
Finally, from Eq. (6) we obtain:
790 ECEEE 2015 SUMMER STUDY – FIRST FUEL NOW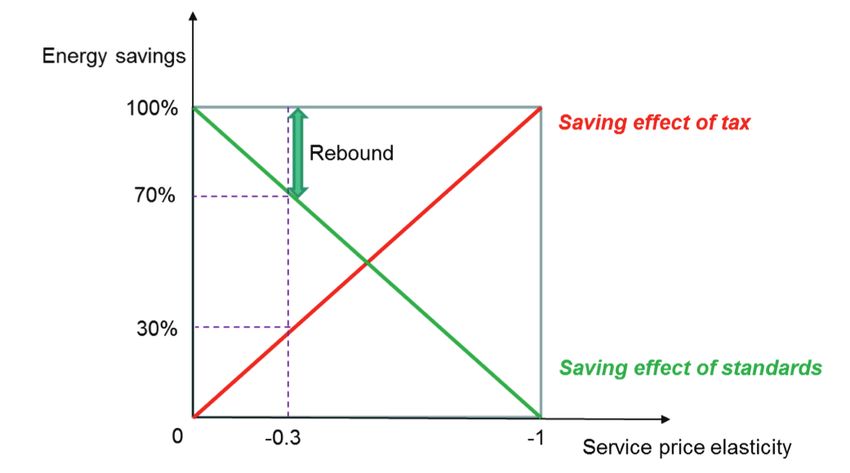
4. MOBILITY, TRANSPORT, SMART & SUSTAINABLE CITIES 4-109-15 AJANOVIC ET AL
Figure 11. How a tax works (based on Ajanovic/Haas 2014b). Figure 12. How a standard works (based on Ajanovic/Haas
2014b).
Using the definition of the service price elasticity, the difference
vkm* = f ( PS* ) = f (τ f ,τ R* _ CO2 ) (12) in vkm driven caused by the rebound effect is calculated as:
From this equation it is clear that a registration tax based on
Δ( Pf FI )
ΔvkmREB = α vkm, Ps vkm1 (15)
CO2 emissions will also have an impact on service demand - Pf FI 1
vehicle kilometer driven. In principle a CO2 based registration
Where αvkm,Ps is the elasticity of vehicle kilometres driven with
tax works like a standard and leads to the same effect. With
respect to service price PS.
a higher CO2 based registration tax, demand for cheaper and
Using previous equations and the fundamental definition de
more energy efficient vehicles rises. Due to the higher efficiency
scribed in Greene (1997), the elasticity of energy consumption
of cars, service price decreases and leads to a direct rebound
with respect to a change in fuel intensity is derived, (for detail
effect caused by more km driven.
see Ajanovic/Haas, 2012):
The principle of how changes in efficiency due to standards
and/or registration taxes affect energy consumption is depicted γ E , FI = 1 + α vkm, P (16)
in Figure 12. When a standard is implemented we switch from S
less efficient vehicles η0 to more efficient alternatives η1 leading From Eq. (16) it can be seen that the elasticity of energy con
to a reduction ΔEη in energy consumption. However, due to a sumption with respect to a change in fuel intensity (γE,FI) is one
lower service price Ps2η this saving is lower than what is theo plus the elasticity of the energy service (in our case vkm) with
retically possible, due to rebound effect. respect to service price (Ps).
Figure 13 depicts the effect of a fuel tax versus a standard
Interactions of policies depending on the service price elasticity. For example, if a tax
in the magnitude of 100 % is introduced and the price elasticity
The rebound effect is one of the most critically discussed issues
is (-0.3) then the energy saving effect is 30 %. If a standard in
with respect to the implementation of standards for fuel in
the magnitude of 100 % is introduced and the price elasticity is
tensity or corresponding CO2 emissions as well as registration
e.g. (-0.3) then the energy saving effect is 70 % and the rebound
taxes. Fuel cost savings usually lead to the changes in driving
effect due to more km driven is 30 %.
behavior, e.g. cars are used more frequently and/or on longer
The preference for taxes versus standards depends solely on
distances. The behavioral response to the introduction of a new,
the magnitude of the service price elasticity αvkm. However, the
more efficient technology or other measures implemented to
best result could be reached with a combination of taxes and
reduce energy use is called the direct rebound effect.
standards.
In the case that a standard for maximal fuel intensity (FI*) is
If αPs is small (e.g. -0.1) the fuel tax effect is almost negligible.
introduced, theoretical savings due to a standard are reduced
In this case a standard is clearly preferable with an empirical
due to the rebound effect, so that practical energy saving is
saving effect of about 90 % of the theoretically calculated 100 %.
lower:
If, however, αvkm is high, the tax is preferable. As mentioned
pr
ΔE save th
= ΔE save − ΔE REB (13) previously αvkm is in the range of -0.4 to -0.45. This leads to an
ambiguous situation and it is likely that a combined introduc
tion of standards and fuel taxes depending on the service price
with:
elasticity will lead to the most beneficial solution for society.
Also, a mix of different monetary and non-monetary meas
ΔEREB = FI * (vkm2 − vkm1 ) (14)
ures can lead to the best results in promotion of electric vehi
cles, see Ajanovic, 2015. One good example is Norway where
ECEEE SUMMER STUDY PROCEEDINGS 791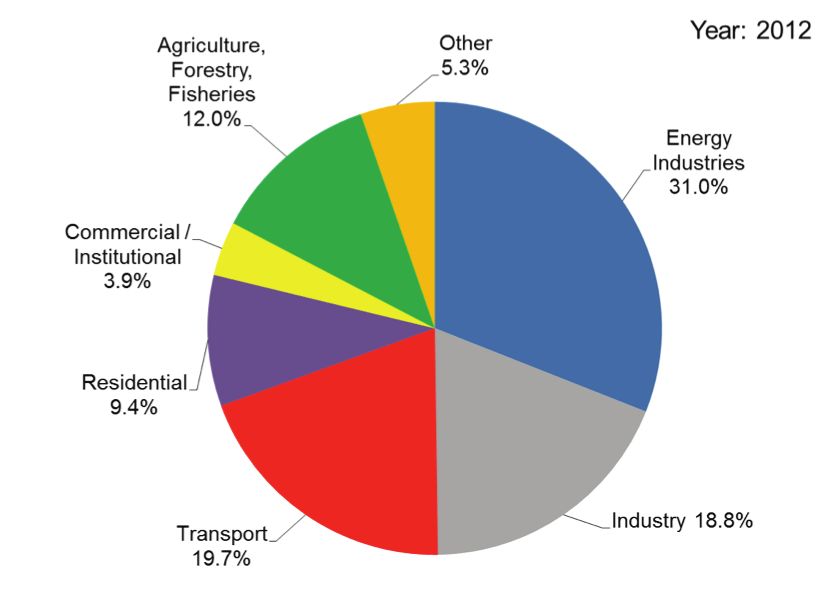
4-109-15 AJANOVIC ET AL 4. MOBILITY, TRANSPORT, SMART & SUSTAINABLE CITIES
Figure 13. Effect of a tax versus standard depending on service price elasticity.
electric vehicles are exempted from registration tax, value add tax should compensate the standard to an extent so that fi
tax, annual car tax, road toll and congestion charges. Addition nally the service price before and after policy introduction
ally, drivers of electric vehicles have access to bus lines and free remains the same. Yet, because registration taxes work as
parking spaces (Malvik et al., 2013). Moreover, a good public standards, a fuel tax must also accompany an intended in
charging network is provided, with about 10,000 charging sta troduction of registration taxes.
tions (LeSage, 2013).
References
Conclusions
ACEA. 2014. Tax Guide 2014. www.acea.be
The major conclusions from this analysis are:
Ajanovic A., Haas R. (2014a), The impact of fiscal policies
1. Despite the fact that there are many parameters that con and standards on passenger car CO2 emissions in EU
stitute a formal framework to explain energy consumption countries, Energy Production and Management in the
and CO2 emissions, there is only one key parameter which 21st Century: The Quest for Sustainable Energy. ENERGY
influences final CO2 emissions and this is the service price QUEST 2014. WIT press 2014, ISBN: 978-1-84564-816-9
elasticity. Our results for the service price elasticity of car (p. 609–624).
driving in Europe are about -0.4 to -0.45. Ajanovic A., Haas R. (2014b), Evaluating the impact of
standards and fiscal policies on CO2 emissions of cars in
2. The service price elasticity impacts fuel taxes, standards as
Europe, 2014 IEPPEC Conference, 9–11 September 2014,
well as registration taxes.
Berlin, Germany.
3. The major reason is that standards and fuel taxes are linked Ajanovic A., L. Schipper, R. Haas. The impact of more efficient
via the service price elasticity and are not independent. The but larger new passenger cars on energy consumption in
magnitude of the service price elasticity defines which in EU-15 countries. Energy 48 (2012), 346–355.
strument is more effective – the tax or standard. Ajanovic A. (2015). The future of electric vehicles: prospects
and impediments WIREs Energy Environ 2015. doi:
4. Another finding is that the introduction of a registration tax
10.1002/wene.160.
is in principle the same as the introduction of a standard
Ajanovic A, R. Haas. 2011.“ On the effectiveness of standards
and leads to the same rebound problems. The registration
vs. taxes for reducing CO2 emissions in passenger car
taxes may cover a specific part of the standards’ component.
transport Europe”. Proceedings, Risø International Energy
5. The intended introduction of standards as announced by Conference (RIEC).
the EU will not lead to the theoretically possible energy sav Ajanovic A., R. Haas. 2010. “The impact of fiscal policies
ings and CO2-reduction. The major reason is that the re on passenger car transport energy demand in OECD
bound effect due to more km driven and larger cars will take countries”. Proceedings, 29th USAEE/IAEE Annual North
back part of the theoretically calculated savings. American Conference in Calgary. Canada.
Ajanovic A., R. Haas. 2010a.”On extracting the impact of con
6. This result leads to the situation that a mix of policies is
sumer behaviour and the rebound effect in passenger car
preferable. A combined tax-standard policy will lead to a
transport in selected EU countries”. Proceedings, 8th BIEE
win-win situation for the environment and car drivers. A
Academic Conference, Oxford.
simultaneously introduced fuel tax will compensate for the
Ajanovic A., R. Haas, 2012. “The role of efficiency improve
rebound effect without hurting car drivers due to service
ments vs. price effects for modeling passenger car
vkm driven remaining at the same service price. The fuel
792 ECEEE 2015 SUMMER STUDY – FIRST FUEL NOW4. MOBILITY, TRANSPORT, SMART & SUSTAINABLE CITIES 4-109-15 AJANOVIC ET AL
transport demand and energy demand — Lessons from Haas, R., Nakicenovic, N., Ajanovic, A., Faber, T., Kranzl, L.,
European countries”. Energy Policy 41, 36–46. Mueller, A., Resch, G., 2009. “Towards sustainability of
Dahl C.A. 2012. “Measuring global gasoline and diesel price energy systems: a primer on how to apply the concept of
and income elasticities”. Energy Policy 41. energy services to identify necessary trends and policies”.
Dargay, J.M., 1993. “Are price and income elasticities of Energy Policy 36, 4012–4021.
demand constant? The UK Experience” EE16. Oxford H.P.J. de Wilde, P. Kroon. Policy options to reduce passenger
Institute for Energy Studies. cars CO2 emissions after 2020. ECN. ECN-E-13-005.
EC. 2014. Directorate-General for Mobility and Transport February 2013.
(DG MOVE), http://ec.europa.eu/transport/facts- IEA, 2013. Global EV Outlook, OECD/IEA, 2013.
fundings/statistics/pocketbook-2014_en.htm accessed on Malvik H.V., Hannisdahl O.H., Wensaas G.B. The future is
4.11.2014. electric! The EV revolution in Norway – explanations and
EC, 2009. European Commission. Regulation (EC) No lessons learned. In: eceee, 2013.
443/2009 of the European Parliament and of the Council LeSage J. Strong Incentives Help Norway Love Electric Vehi
of 23 April 2009 setting emission performance standards cles after All these Years. Autoblog Green, 7
for new passenger cars as part of the Community’s inte January 2012. Available at: http://green.autoblog.com/
grated approach to reduce CO2 emissions from light-duty 2013/01/07/strong-incentives-help-norway-love-electric-
vehicles. June 2009. vehicles/. (Accessed November 17, 2013.)
EEA, 2014. European Environment Agency Monitoring CO2 ODYSSEE Database. http://www.odyssee-indicators.org/.
emissions from passenger cars and vans in 2013. ISBN Shahan Z., Electric vehicle market share in 19 countries. http://
978-92-9213-494-5, doi:10.2800/23352. www.abb-conversations.com/2014/03/electric-vehicle-mar
EEP. 2013. Europe’s Energy Portal. http://www.energy.eu/ ac ket-share-in-19-countries/ (Accessed January 10, 2014).
cessed on 1.10. 2013. WB, 2014. http://databank.worldbank.org/data/databases.
EU website on Climate action in the transport sector: http:// aspx (Accessed January 10, 2014).
ec.europa.eu/clima/policies/transport/vehicles/cars/ Walker, I.O., Wirl, F., 1993. “Irreversible price-induced effi
faq_en.htm, accessed on 15.5.2014. ciency improvements: theory and empirical application to
Goodwin, P.B., Dargay, J.M., Hanly, M., 2004. “Elasticities road transportation”. The Energy Journal 14 (4), 183–205.
of road traffic and fuel consumption with respect to Wirl F. 1992. “The impact of conservation, technology and the
price and income: a review”. Transport Reviews 24 (3), new registration tax on automobiles on energy consump
292–375. tion”. Empirica – Austrian economic paper. Vol.19, No. 1.
ECEEE SUMMER STUDY PROCEEDINGS 793You can also read