Review of WLTP and vehicle taxes - Response to UK HM Treasury consultation February 2019 - Transport & Environment
←
→
Page content transcription
If your browser does not render page correctly, please read the page content below
Review of WLTP and vehicle taxes
Response to UK HM Treasury consultation
February 2019

Summary

  This paper has been prepared by Transport and Environment (T&E) UK in response to the
  consultation from HM Treasury, Review of WLTP and Vehicle Taxes. T&E is a federation of almost
  60 national organisations campaigning for greener transport and has recently established a new
  presence in the UK.

  Data comparing official NEDC and WLTP test results is sparse. Data compiled by T&E based upon
  just 24 models showed an average uplift in WLTP values of 23% - 36% depending on how the NEDC
  value was derived Other authoritative studies also show widely differing uplifts of between 1%
  and 25%. Large variabilities in the uplift of NEDC to WLTP values in different studies arise from:
  carmakers exploiting flexibilities in both test procedures; the use of different research methods
  between studies; and, real differences in the WLTP to NEDC ratio between models and brands.
  Recent manipulation of the WLTP test results confirmed by the European Commission
  exaggerates the WLTP uplift but should be partly addressed by 2022 by which time a much larger
  and more robust dataset will be available to analyse the most appropriate ratio. The appropriate
  factor to uplift NEDC based tax bands to WLTP is uncertain at present and the use of a single factor
  could create significant market distortions between brands. The Government is advised to
  continue to use the NEDC as the basis for taxation until March 2022, until then NEDC results can
  continue to be used.

  The Government should nevertheless reform vehicle taxes to support policies to lower both air
  pollution and CO2 emissions by increasing incentives for zero emissions vehicles. Changes should
  not only send a clear political message to encourage consumers to choose the most
  environmentally friendly vehicles, but also provide a meaningful incentive to do so. Areas in
  particular need of reform are:

      •   Committing to the 2% benefit in kind rate for zero emission company cars considerably
          beyond 2020/1. This is particularly important to avoid market disruption once grants for
          zero emission vehicles are phased out in 2020.

      •   Ensuring taxes on zero emission vehicles are always lower than those with ultra low
          emissions by raising the company car tax rates for PHEVs to create a larger differential to
          zero emission models. The Treasury should also explore developing a system so the lowest
          tax rates for PHEVs require the vehicle to be driven mainly on the battery.

      •   Revising tax rates and bands for average and high emitting vehicles to account for the
          widening gap between test and real world emissions; and, the anticipated 17% reduction
          in emissions that will occur by 2021 to meet EU regulatory targets.

      •   Considerably increasing the differentials in first year vehicle excise duty tax rates between
          vehicles with widely differing emissions (or introducing a a CO2 differentiated registration
          tax). Such a tax in other countries has driven the shift to zero emissions solutions the
          Government is seeking.

                                                                                                          1
                                                             a briefing by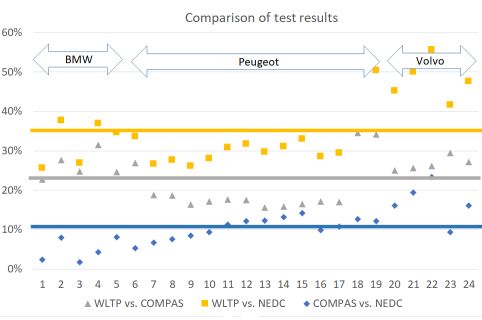
1. Introduction
This response has been prepared by Transport and Environment (T&E) UK in response to the consultation
from HM Treasury, Review of WLTP and Vehicle Taxes.

T&E is Europe’s foremost sustainable transport NGO, a federation of almost 60 national organisations
campaigning for greener transport. T&E has been closely involved in defining the WLTP test; development
of the CO2MPAS tool to convert WLTP to NEDC CO2 values; and new regulations setting 2020/1 and 2025/30
standards. T&E also highlighted the risk of carmakers inflating WLTP test results in order to create an
artificially high baseline for the new 2025/30 car CO2 regulation; and has published several reports on the
size and causes of the widening gap between NEDC test results and real world emissions. T&E has recently
established a presence in the UK.

2. Question 1: Comparison of NEDC and WLTP test results
There are few comprehensive studies comparing official NEDC and WLTP test results and the findings of
other credible studies are highly inconsistent as illustrated in the table below (and documented in the annex
to this response).

 Source           Method        Average gap      Other findings
                                NEDC - WLTP

 ICCT 2014      Simulation          7.7%         2% from lower test temperature

 TNO 2016         Testing           c10%         Result depending on NEDC test conditions

 JRC 2016        Testing &          1-11%        8% gap between NEDC tests and official values also found.
                 modelling                       Higher gap for diesels and RDE compliant models

 JRC 2017        Modelling           21%         Higher gap for lower emission vehicles; no gap for high
                                                 emitting

 JRC 2018       Testing and          25%         Worst case assumptions on test flexibilities including
                 modelling                       some that are now no longer permitted

 T&E 2018       Official data     23% tests Wide differences between models & OEMs; also between
                                36% CO2MPAS measured and simulated NEDC values. Exposed WLTP test
                                            manipulation

 JRC 2018       Official data          -         Confirmed WLTP results are being artificially inflated

 KBA 2019       Official data        26%         Comparison of January 2018 (NEDC) fleet average values
                                                 and January 2019 values. Range 1- 88% depending on the
                                                 brand; no correlation with emissions

2.1. Analysis based upon official data (2018)
In 2018, T&E undertook analysis to explore the uplift of NEDC CO2 values to WLTP using upon official
homologated CO2 data from 24 cars from 3 carmakers. On average CO2MPAS CO2 equivalent results were
11% higher than NEDC values (range 2-23%) this was surprising as similar results were expected. On
average, the WLTP results were 23% higher than the CO2MPAS values (range 16-34%); WLTP results were
36% higher than the NEDC test values (range 26 - 56%). The results showed the WLTP results were being
deliberately inflated to raise the baseline for 2025/30 CO2 regulations. This will also inflate NEDC equivalent

                                                                                                          2
                                                              a briefing by
test results (derived using CO2MPAS) that were intended to be used for compliance with 2020/1 targets. To
help ensure 2020/1 targets are met, carmakers are now double testing vehicles and optimising WLTP results
to produce high results; and optimising the NEDC test to be as low as possible. As a result the gap between
NEDC and WLTP is exaggerated.
Subsequent analysis by the Joint Research Centre for the European Commission confirmed T&E’s
findings and concluded, “ ...there is a clear risk of an artificial increase in the WLTP emissions in 2020 as a
result of i) manufacturers declaring too high WLTP values; and (ii) changes made to the vehicle configuration
for the WLTP test compared to the NEDC test.” As a result various legislative changes were introduced to the
post 2020 car CO2 regulation to avoid deliberately declaring high WLTP values and check official test results.
2.2. Reasons for widely differing uplift factors
There are several reasons for the variability of the findings of different study as to a WLTP to NEDC
conversion factor:
1. There are several versions of the NEDC which each produce different results. The original version of
the NEDC test; new version of the NEDC test (results are about 8% higher); and NEDC equivalent
results derived using the CO2MPAS tool from WLTP measurements. Different studies use a different
baseline for comparison.
2. Each NEDC test procedure allows optimisation of the test (to slightly different extents) enabling the
test results to be artificially lowered.
3. NEDC tests are not conducted on every model but families of models making it difficult to compare
with WLTP values that use an approach that provides a more representative value for each model
and variant.
4. Flexibilities exist in the WLTP test procedure that can be used to either inflate or deflate the test
result, notably through the selected gear shift strategy. Some companies have also been optimising
WLTP results by switching off the stop-start system or starting with a low state of battery charge.
5. The studies use different methods including their own tests and simulations using a range of tools.
Only the T&E study and Commission analysis by the JRC relies on official homologated test results
(in the case of the JRC from about 100 models) but these tests have been proved to be manipulated.
6. The average difference between NEDC and WLTP values varies between high and lower emission
vehicles; and between diesel, gasoline and hybrid vehicles and between carmakers. There is no
single appropriate factor for all models. Any single factor that was applied would
3
a briefing byadvantage/disadvantage one model over another and therefore affect the relatively
competitiveness of different companies. This is why ACEA opposed the adjustment of the 2020/1
95g/km into a WLTP equivalent target and instead the European Commission developed the
CO2MPAS tool to produce NEDC equivalent values for each model.
2.3. Comparison of 2018 and 2019 fleet average data from Germany
T&E (2019) has also recently compiled official data from Germany comparing the fleet average emissions
measured using the NEDC system in 2018; and fleet average emissions in January 2019 using the WLTP
system. This is a large dataset of over 500 thousand models, but the measured uplift will also reflect real
differences in the sales mix between the years and some improvements in real CO2 emissions as a result of
model upgrades. This cannot therefore be considered a robust basis for deriving an uplift factor. The values
for some carmakers or models may also have been distorted by test manipulation and the NEDC values are
likely to include a mix of both NEDC test results and NEDC values derived from WLTP test results using
CO2MPAS. The results show an average uplift of 26% with a wide range from 1% for Mitsubishi to 81% for
Smart. There is no correlation between the uplift from NEDC to WLTP and the brand WLTP emissions
overall.
There are several notable features of the data:
• For most brands the uplift is in the range 1.15 to 1.35
• The uplift for DS and Smart are particularly high. For DS this is due to the introduction of the new
DS7 SUV; for Smart because the 2018 sales including 30% electric models that were not sold in 2019.
• The uplift for Nissan, Renault and Mitsubishi is particularly low. This is due to strong electric and
plug-in hybrid sales in 2019.
• Ford and Opel have similar NEDC average emissions (127 g/km) but the equivalent WLTP values vary
widely (Ford 164 g/km and Opel 154 g/km).
The analysis suggests deriving the WLTP uplift using a simple analysis comparing the 2018 and 2019 fleet
average emissions is unlikely to produce a robust basis for comparison.
4
a briefing by2.4. In conclusion
Based upon the available evidence, it is not possible to derive a robust and representative single conversion
factor at the present time as there are a wide range of influences on uplift factor - including test
manipulation The German data indicates such a single factor could create significant market distortions
between brands. However, it is not necessary to uplift NEDC tax bands at present, as NEDC CO2 values will
continue to be available until at least the end of 2021. Rather than switching to the WLTP system now the
Government is advised to continue to use the NEDC as the basis for taxation until March 2022. This
approach has several advantages:
• By delaying the switchover a much larger dataset of new NEDC and WLTP values for individual
models will be available on which to base a future assessment
• Some of the measures the Commission are introducing to prevent manipulation of the WLTP test
should have been implemented and ensure WLTP values are more representative. This is important
as some factors leading to high ratios, like declaring a CO2 value 5% different from the test result,
will not be possible in the future. This is one of the factors leading to the 25% estimated in the JRC
2018 paper.
• By March 2022, almost all company cars will have WLTP values so no conversion of NEDC values will
be needed.
The main disadvantage of persisting with an NEDC based system is that tax rates will continue to be based
upon CO2 measurements that are around 40% less than real world performance for a few more years.
However the new WLTP values will still deviate markedly. The Government previously announced that it
planned to transition to WLTP in 2020. However, this was before the concerns identified by T&E and
confirmed by the European Commission regarding manipulation of the WLTP test. In view of this cheating
it is entirely reasonable to delay the transition until a larger and more robust dataset is available.
3. Question 2: Impact of WLTP tests on zero and low emission
vehicles
3.1. PHEVs
For plug-in (battery electric and plug-in hybrid vehicles) and fuel cell vehicles the impact of the switch in the
test procedure will make a difference in terms of the energy consumption (affecting the range) and for PHEV
the CO2 emissions. Research by the JRC (2017) found ratios of 0.8 - 0.83 in the range of battery electric
models with the higher ratio for smaller cars. For hydrogen fuel cell cars the ratio was 0.91 to 0.94, again
with a higher ratio for larger cars. However, it is important to note the JRC study is based upon modelled
not measured values and cannot account for all test flexibilities.
For PHEV models the situation is more complex and dependant on the size of the battery and range. Larger
batteries lead to a decrease in the ratio as results using the WLTP procedure are more dependent on the
electric range than the NEDC one. As a result WLTP emissions will be higher than the NEDC equivalent
ones. However, at present, the PHEV market is relatively homogeneous with most models having an electric
range of between 39 and 55 miles. For this reason the JRC propose a WLTP-NEDC correlation factor of 1 for
all plug-in hybrid vehicles based upon their modelling.
Sales of some PHEV models have been halted following the introduction of WLTP, reportedly because the
vehicles no longer quality for supercredits (emissions are over 50 g/km) or other tax benefits based upon
this threshold. Volkswagen, Porsche and Mercedes-Benz models are particularly badly affected. Mitsubishi,
upgraded the Outlander PHEV which has a new WLTP electric range of 28 miles (33 miles NEDC) and CO2
emissions of 46 g/km (40.3 g/km NEDC). However, to achieve these WLTP results the petrol engine was
reduced in size and the battery increased so a direct comparison of WLTP and NEDC values is not
appropriate.
5
a briefing byIt is also important to take into account that the average emissions of PHEV and hybrid models on the road are significantly higher than in tests. Research by the Fraunhofer Institute (2018) found PHEVs with an all electric range of 61 km (Opel Ampera and Chevrolet Volt) performed relatively well being driven using their battery (utility factor) more than 70% of the time. Vehicles with a medium all electric range of about 38 kms (Volvo V60 and Mitsubishi Outlander) had a utility factor of about 48%. However, the PHEV Toyota Prius with a short electric range of just 18 km was only driven on the battery 40% of the time. These results are broadly consistent with early TNO (2016) findings. The extent to which PHEVs are driven using their battery significantly affects the real world emissions. For the longest electric range PHEVs the specific CO2 emissions are 34-42 g/km; for the medium electric range models 101 - 106 g/km; and for the shortest electric range 95 g/km (the Plug-in Prius is a much smaller and lighter model than the medium range models). On average conventional vehicle also have emissions about 40% higher than the official NEDC value. However, compared to a genuinely zero emission vehicle the tailpipe emissions of PHEVs are significantly higher than homologated values - even for longer range models. PHEVs should be taxed at a higher rate than zero emission models and at different rates depending on their electric range. The Government should also consider developing the company car tax system to require a minimum level of charging for drivers to qualify for the lower rate. 3.2. Hybrid cars For hybrid cars the same JRC research proposes WLTC to NEDC factors of 1.23 to 1.38. The smallest ratio applies to a gasoline with more than a 2.0 l engine; the largest ratio to a diesel with a small
4. Question 3: Accounting for competing factors
4.1. Reducing emissions - the priority for tax reform
Changes to the test procedure have a range of important implications for other Government policies. For
T&E the priority is to tackle the environmental issues created by vehicles, both air pollution and CO2.
Accordingly, the WLTP should be introduced in a way that does not raise VED or company car tax bands.
Instead, reform of vehicle taxation should focus on encouraging the shift to zero emissions vehicles and
imposing higher taxes on higher emitting vehicles.

The UK has failed to meet its air pollution standards for the past 9 years and it is estimated that there are
28-36 thousand premature deaths a year as a result of air pollution. Public Health England estimates that
the health and social care costs of air pollution (PM2.5 and NO2 ) in England will reach £5.3 - £18.6 billion by
2035. Reductions in air pollution lower UK Government health and social costs and in urban areas vehicles
are main source of air pollution and need to be cleaned up. The Government Clean Air Strategy recognises
transport “... has a key role to play in reducing emissions and meeting the government’s objectives on the
environment and public health.” Reform of vehicle taxation could make an important contribution.

Updated CO2 emissions show that in 2017 the UK failed to reduce transport CO2 which is now the single
biggest source of CO2 emissions accounting for 28% of UK greenhouse gas (GHG). Failing to lower
transport emissions will lead the UK to miss its legally binding long term climate targets and the medium
term goals in the fourth and fifth carbon budgets. Reform of vehicle taxation is essential to lower vehicle
emissions - particularly since other policies, like the £15Bn investment in new roads only worsen the
problem.

The UK currently has some effective policies to incentivise sales of low and zero emissions vehicles but the
current commitment to £3,500 grants for electric cars to 2020 is not a sustainable solution to support the
shift to zero emission vehicles the Road to Zero strategy seeks to achieve. T&E welcomed the recent
revision of the grant to focus support on zero emission vehicles; but with grant funding expected to run-out
in 2020 a supportive tax framework must be put in place to continue to incentivise the shift to zero
emission vehicles in the early 2020’s. If this does not happen a collapse in market confidence is likely once
grants are exhausted discrediting the good work to date and undermining the Government intention to be
a leader in the shift to zero emission vehicles. Such a tax framework could include a lower rate of VAT on
zero emission vehicles.

4.2. Tax reform as an alternative to grants
T&E expect a significant increase in sales of ultra low emission vehicles (ULEVs) across the EU as a result of
CO2 regulations that come into force in 2020/21, with significant fines for non-compliance. We estimate that
as a result of the regulation EU wide sales of sub-50g/km vehicles to grow to 5-7% of new car sales by
2021. This is expected to increase to around 10% of new car sales by 2023 once additional incentives
(supercredits) in the car CO2 regulation are phased out. New CO2 targets for 2025 should result in sales of
ULEVs continuing to grow to at least 15% by 2025. Current market supply constraints are being relaxed by
companies to ensure they meet their targets. T&E forecast there will be 5 times more battery electric models
on the market by 2021 and nine times by 2025 and marketing spend will leap from the 1.5% currently
invested in promoting zero emission solutions. Whether the UK experiences a similar level of grown as the
EU as a whole will depend upon whether the UK sales continue to count towards meeting carmakers targets
after Brexit.

Any increase in sales of zero emission vehicles will make it prohibitively expensive to continue with the grant
scheme. If UK sales of zero emission vehicles grew to 5% of new car sales in 2021 the cost would be £437.5
M pa. By 2025, the cost could approach £1bn pa. But zero emission vehicles will still need to be incentivised

                                                                                                            7
                                                               a briefing by
to attract customers in the early 2020’s and tax breaks, particularly in the company car sector, are the most
effective mechanism. T&E encourages the UK Government to commit to continue the 2% benefit in kind
rate for zero emission vehicles considerably beyond 2020/1.
4.3. Maintaining tax revenues
It is also important that any change to VED and company car tax must balance the need for revenues to
remain sustainable over the longer term. Ultimately road pricing is the best solution (with differential rates
for zero emission and high emission vehicles); but in the medium term retaining tax revenues is best
achieved by increasing the tax rates for average and high emission vehicles for both VED and company car
tax. This will also have the benefit of encouraging the shift to shared rather than owned vehicles where this
is practicable in cities. This in turn will increase the share of trips made by walking, cycling and public
transport as households using shared vehicles make more multimodal trips with health and emissions
benefits.
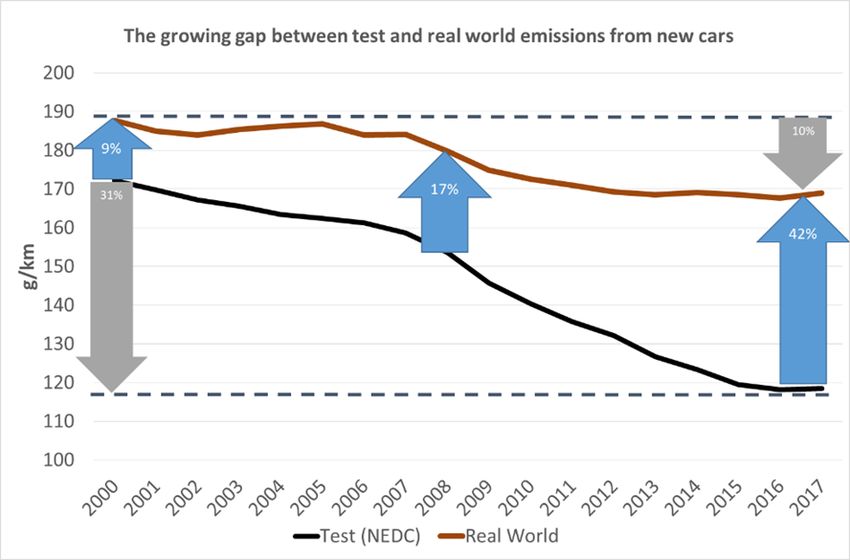
Exploitation of NEDC test flexibilities has considerably lowered official NEDC CO2 emissions but with much
less improvement on the road. Since VED was linked to CO2 emissions in 2000 the gap between test and real
world emissions has grown from 9% to 42%. Over the same period CO2 emissions on the road have
declined by just 10% compared to 31% in the laboratory. Government vehicle tax revenues have been
hugely reduced as a result (although revenues from fuel excise duty have remained high than would have
been forecast). The Government should reform vehicle tax bands and rates to recognise the distortion
created by manipulation of laboratory tests.
Analysis for the Climate Change Committee shows the same issue of a widening gap between test and real
world emissions will continue after the introduction of the WLTP test. The Commission are planning steps
to prevent this and this is a further reason for the Government to delay the switch to WLTP based taxation.
In the next 3 years there will be a sharp reduction in CO2 emissions from many models to contribute to
meeting regulatory targets. Nearly half of the top 50 EU-selling models will receive a full model upgrade by
2021 and consequently fleet average emissions will drop sharply as a result of more efficient conventional
8
a briefing bytechnologies and increased sales of zero and ultra low emission vehicles. The average UK emissions (121
g/km) are close to the EU average (119 g/km) and would be expected to follow a similar trend to 2020/1
(assuming sales in the UK continue to count towards EU regulations). Fleet average emissions are expected
to decline to about 100g/km in 2021 (with the remainder of the 5g/km needed to meet the target met
through supercredits). The UK can therefore anticipate around a 17% reduction in emissions and a sizable
impact on vehicle and fuel excise duty tax revenues as a result by 2021. To tackle declining vehicle tax
revenues the Government should increase VED and company car tax bands for average and high
emission models for 2020/1 to take account of the anticipated reduction in fleet average CO2 emissions.
The Government should also raise the diesel supplement and apply this to all diesel cars by removing
the exemption for RDE2 compliant models as most of these still generate higher levels of nitrogen oxides
than petrol models.
4.4. Short term market effects
Whilst there was a sales drop in September 2018 as a result of some carmakers failing to complete WLTP
testing in time; sales in August had been 23% higher as dealers offloaded old models (although the market
was smaller overall). The car market also partly recovered in October. T&E is not convinced moving the tax
system to WLTP would create further significant market distortions beyond some short-term effects as
some consumers bring forward purchasing decisions. Neither are we concerned the overall level of the
market will be materially influenced by changes to the tax system. Company car drivers will continue to
renew their vehicles at the end of the period, but will increasingly choose lower emission models if these
are incentivised by the company car tax rates. For private buyers VED rates are a small part of the total costs
of ownership and do not significantly influence sales or the rate of fleet renewal. Whilst the model specific
testing of cars under WLTP does mean cars with more optional extras will attract a higher rate of tax these
models have higher CO2 and the system is entirely fair. Economic uncertainties or realities arising from a
disorderly exit from the EU have a far greater influence on market volumes than tax changes.
5. Question 4: Should changes to the vehicle tax system be simple?
It is important that the vehicle taxation system sends clear messages about the relative environmental
performance of different powertrain cars to encourage consumers to choose the most environmentally
friendly. For example:
• There should be clearly lower taxes on zero emission vehicles than those with ultra low emissions
(not presently the case)
• Lower BIK rates for PHEVs should only apply if the car is driven on the battery most of the time (not
presently the case)
• There should be higher taxes the higher the emissions (a strength of the UK system)
• There should be higher taxes on all diesel cars (because emissions of NOx are higher from diesels
than gasoline cars, even most RDE2 compliant models)
• The first owner should be more strongly encouraged to select a zero or low emission vehicle and
taxed more heavily if they do not.
A clear weakness of the UK system is that the differentials in tax rates between vehicles with widely differing
emissions are far too low to make an impact on sales. For example, there is only a £200 difference for the
first year VED between a zero emission car and one emitting 149g/km. This is a political signal not a
meaningful incentive and illustrates why tax rates on average and higher emitting cars should be raised.
The absence of any new vehicle registration tax is also a failing of the UK system. It is notable the countries
with the lowest new car CO2 emissions all have new car registration taxes that strongly differentiate the
level of tax by the emissions. Norway is the most obvious example that has transformed the market to favour
electric cars by doing so. France and The Netherlands are other notable cases.
9
a briefing byThe Government should either replace the first year VED tax with a more meaningful registration tax
or considerably increase the first year VED rate for average and higher emitting cars.
The UK vehicle tax system sends consumers some positive environmental messages but the differentials in
tax between average and zero emission models are far too small to create a real incentive. Whilst high rates
of tax apply to the most polluting cars these comprise the luxury and most expensive share of the market
where tax rates are a minor consideration. As the UK shifts away from grants for zero emission cars it will be
essential to provide a real incentive for these technologies both through VED and especially company car
tax systems.
Further information
Greg Archer
UK Director, Transport & Environment
Greg.Archer@transportenvironment.org;
Tel: +44 (0)7970371224
10
a briefing byAnnex
Summary of key research on the gap between NEDC and WLTP emissions:
● In 2014, based upon a comparison of different test cycles; test conditions (including temperature)
and vehicle test mass using a simulation model, the ICCT estimated the fleet average emissions
measured under the WLTP test would be 7.7% higher than the NEDC
● In 2016, a testing programme conducted by TNO for the Dutch Ministry of the Environment found
more realistic WLTP vehicle test mass and road load settings would raise WLTP CO2 emissions by
about 10g/km (about 10% in 2020 for an average model). It concluded, the precise difference
between these tests is dependant on how and where a vehicle would have been tested in the
original NEDC
● In 2016, 31 cars tested by the JRC found WLTP CO2 results were 1 - 11% higher than NEDC values
depending upon the vehicle test mass. This is in addition to the 8% average difference between
the JRC NEDC test results and the official type approval values. A bigger gap was observed for
diesel vehicles with vehicles that comply with EURO 6 limits (14% increase in CO2 emissions from
NEDC to the simulated worst case WLTP) that also had the largest difference between JRC
measured NEDC tests and declared type approval values (11% difference).
● In 2017, a modelling study using a tool similar to CO2MPAS by the JRC found an average increase
in CO2 emissions from NEDC to WLTP of 21% with no gap for high emitting cars but a larger
difference for low emission models. Results for hybrid electric vehicles show an average WLTP to
NEDC CO2 ratio of 33%.
● In 2018, a JRC study compared measured WLTP values and derived NEDC equivalent values using
CO2MPAS. This paper concluded the biggest impact on CO2 emissions arose from changes in the
road load determination procedure (∼10% increase) whilst procedural changes concerning the
test in the laboratory added another 8% and post-processing and declaration of results a
difference of approximately 5% (each). The paper concludes that overall, the WLTP is likely to
increase the type-approval CO2 emissions by approximately 25%. However, in discussion with the
author is is clear this is a worst case situation as the tested vehicles had a low roadload and mass
and assumed extensive optimisation of the test and CO2MPAS tool.
● In 2018, T&E published research based upon official homologated CO2 data from 24 cars.. On
average CO2MPAS CO2 equivalent results were 11% higher than NEDC values (range 2-23%)
whereas similar results were expected. On average, the WLTP results were 23% higher than the
CO2MPAS values (range 16-34%); WLTP results were 36% higher than the NEDC values (range 26 -
56%). The paper highlighted that the results strongly suggested the WLTP results (and
consequently NEDC results derived using CO2MPAS) were being deliberately inflated in order to
uplift the CO2 values that would be used to derived the 2021 baseline for the car CO2 regulation
for 2025 and 2030.
● In 2018, a subsequent paper prepared by the JRC for the European Commission confirmed T&E’s
concerns that there was deliberate manipulation of the WLTP test results by the car industry and
concluded, “ ...there is a clear risk of of an artificial increase in the WLTP emissions in 2020 as a result
of i) manufacturers declaring too high WLTP values; and (ii) changes made to the vehicle
configuration for the WLTP test compared to the NEDC test.” As a result various legislative changes
were introduced to the car CO2 regulation to avoid deliberately declaring high WLTP values. The
Commission has also been required to monitor and develop a system to check real world
emissions. These changes will, for example make declaring a CO2 value 5% different from the test
result unlikely - one of the factors leading to the 25% estimated in the JRC 2018 paper.
11
a briefing byYou can also read