Source or Sink? The Carbon Footprint of Vietnam Robusta Coffee - March 2019 - IDH the ...
←
→
Page content transcription
If your browser does not render page correctly, please read the page content below
Source
or Sink?
The Carbon Footprint of
Vietnam Robusta Coffee

March 2019
Source
or Sink?
The Carbon Footprint of
Vietnam Robusta Coffee
March 2019
Authors: Michiel Kuit, Lieke Guinée,
Don Jansen, Claudia Schlangen
Commissioned and co-authored by:
IDH the Sustainable Trade Initiative
March, 2019
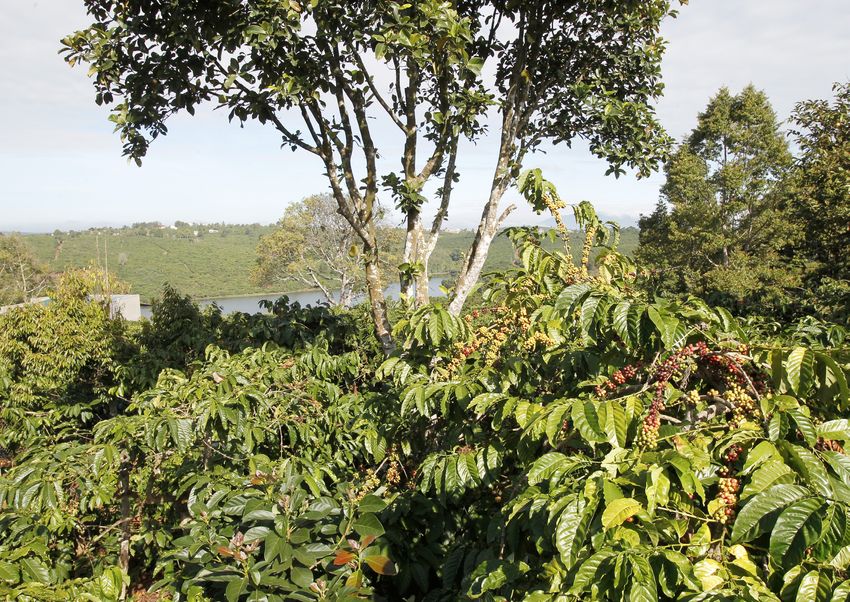
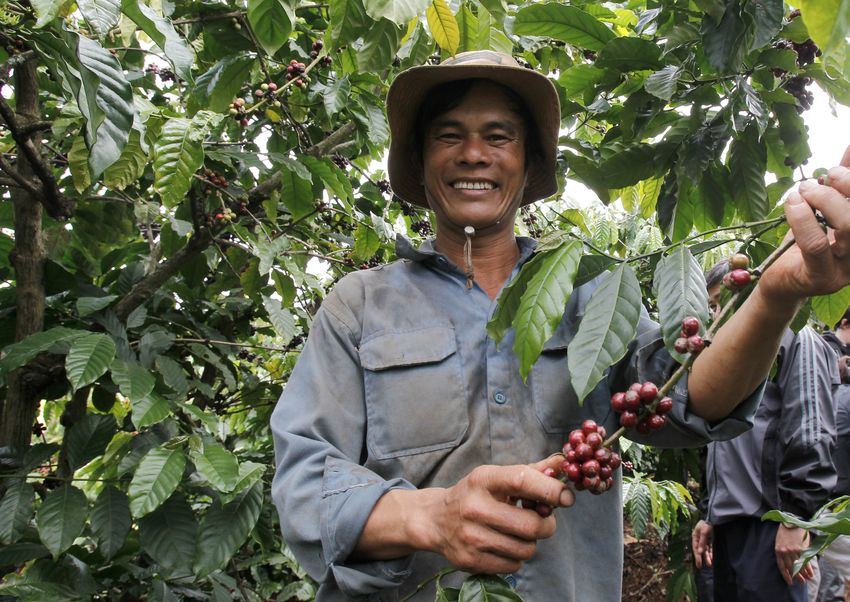
Photos: Agri Logic
summary

Using daily farming records from 300 robusta coffee farms in
Vietnam’s Dak Lak and Lam Dong provinces spanning a two-year
period, we analyzed the carbon footprint of robusta production.
We found that the level of diversification is influencing the carbon
footprint. Highly diversified farmers who grow more than 30% of
non-coffee trees on their farm have higher carbon emissions, but
their higher rate of carbon sequestration more than offsets this.

Consequently, such farms can act as carbon sinks, while main-
taining high levels of coffee production. Monocrop coffee farms
are net sources of carbon, releasing 0.37 metric tons of CO2e per
metric ton of coffee produced. While the period on which this
data analysis is based covers only two years, we can draw a ten-
tative conclusion that diversification of monocrop coffee farms
in Vietnam’s Central Highlands is a viable strategy to transform
the coffee sector’s contribution to climate change from being a
carbon source to a carbon sink. Apart from the effect of diver-
sification, we found that CO2e emission can also be reduced by
optimizing fertilizer management, in particular through reducing
the amount of Nitrogen applied through fertilizers into the soil.

                                                                       3
1.
Initiative for                                    background
Sustainable
Landscapes (ISLA)                                 Vietnam is the second largest producer of coffee after Brazil, and
                                                  the largest exporter of robusta coffee. The Vietnamese coffee
Vietnam                                           sector primarily consists of small-scale farmers who grow coffee
                                                  on farms ranging from 0.5 to 3.5 hectares. Robusta coffee is main-
                                                  ly produced in the southern provinces of Dak Lak, Lam Dong, Dak
IDH’s landscape program in Central Highlands
                                                  Nong and Gia Lai. Within Vietnam, productivity levels vary region-
addresses three key issues: extreme climate
                                                  ally and from year to year, but typically average 2.5 metric tons per
events, particularly recurring droughts; defor-
                                                  hectare1. The sector uses more irrigation water and fertilizer than is
estation; and agrochemical overuse. Through
                                                  required, which leads to high levels of greenhouse gas (GHG) emis-
the Initiative for Sustainable Landscapes
                                                  sions. Climate change is a looming threat that requires rethinking
(ISLA), we joined forces with coffee compa-
                                                  the farming systems in which coffee is produced.
nies and the government in public-private
platforms to support coffee farmers to be-
come more climate resilient, cost efficient,           Climate change is a looming threat that
to diversify their incomes and reduce their            requires rethinking the farming systems
carbon footprint. This includes diversifying
                                                       in which coffee is produced
agricultural systems, conserving water and
soil resource, reducing water and agrochem-
ical overuse, and developing a deforesta-         IDH, the Sustainable Trade Initiative and coffee roasters JDE and
tion-free coffee sourcing area - thus ensuring    Lavazza fund a number of coffee landscape projects in the Dak
the landscape is a sustainable sourcing area      Lak and Lam Dong provinces through the Initiative for Sustainable
for coffee and other commodities. We focus        Landscapes (ISLA). The two provinces alone produced around
on the Lam Dong and Dak Lak provinces, and        970,000 metric tons of green robusta coffee per annum in the
aim to reach 20,000 farmers by 2020.              2017/18 season, which makes up around 10% of global production.
                                                  Two of the implementers of ISLA landscape projects are Olam Viet-
                                                  nam Ltd. (Olam) and Atlantic Commodities Vietnam Ltd. (Acom).
                                                  As part of their respective projects, the two companies implement
                                                  a data collection method called the Farmer Field Book (FFB),
                                                  developed by Agri-Logic. A range of questions that flow from the
                                                  objectives of the landscape facility can be answered by using this
                                                  data. One of these looks at whether more diversified coffee farm-
                                                  ing systems in Vietnam can be highly productive and profitable for
                                                  farmers while acting as carbon sinks.

                                                  In this report, we analyze the carbon footprint of robusta produc-
                                                  tion using data from the FFB for the coffee seasons of 2016/17 and
                                                  2017/18. We apply the Carbon Footprint Product Category Rules
                                                  for green coffee (UN CPC 016102), hereafter referred to as PCR.

                                                  1.   http://gcp-connect.coffee/sites/gcp-connect.org/files/170725_FFB%20report%20
                                                       ISLA%20programme.pdf
                                                  2    The Product Category Rules for green coffee were valid until November 27, 2016. The SAI
                                                       Platform coffee working group who made the PCR is no longer active. To date, neither of
                                                       the two coffee and sustainability alliances, the Global Coffee Platform and the Sustainable
                                                       Coffee Challenge, has taken up the task of revizing the PCR.
                                                                                                                                                     4
2.
Methods
Sampling
In each province, 150 farmers keep daily FFB records of all activities, inputs used,
                                                                                                                     The FFB software contains a module that calculates these CO2e emissions for
and outputs produced on their farms. The sample of 300 farmers is stratified,
                                                                                                                     each farmer based on the types and volumes of inputs used. The FFB carbon
based on the agroforestry class of their farm (Table 1). Much of the diversification
                                                                                                                     footprint calculation module was largely designed using the guidelines in the
comes from the intercropping of coffee with pepper. There is a confounding geo-
                                                                                                                     PCR, including its recommendation to estimate carbon sequestration as well.
graphical factor in that most of the monocrop farms are in Lam Dong province,
while most of the highly diversified farms are located in Dak Lak.                                                   To estimate carbon sequestration, at each of the 300 farms a complete tree
                                                                                                                     stock inventory was made, listing all the species grown, the age of each tree, and
                                                                                                                     the number of trees per species/age-group combination. From this base, chang-
                                                                                                                     es in the tree stocks are taken into account when farmers plant new trees and
Table 1. Agroforestry classification used for this study in 2016
                                                                                                                     stump or uproot existing trees. For each of the species, we attempted to obtain
 Agroforestry class          Description                      Definition                    Nr Farmers               region- and species-specific allometric models. Where these proved unavailable,
 Monocrop                    Nearly fully sun grown           30% non-coffee trees   3     106                      eter at breast height5 and the overall height of 14 to 35 trees of each species and
                                                                                                                     age group for that species. The prevalence of species on farms determined how
                                                                                                                     many measurements were taken, with more commonly planted species receiving
                                                                                                                     a greater number of measurements.
In Lam Dong province, the FBB farms are in the communes of Tan Lam, Tan Chau,                                        The measurements were taken across six districts in Dak Lak province. These
Di Linh, Gung Re and Tan Nghia, whereas those of Dak Lak province are located                                        measurements, in combination with the allometric models, allowed us to model
in the communes of Ea Drong, Ea Pok and Ea Tan.                                                                      the biomass increase over time for each species. Pairing this with carbon content
                                                                                                                     values per species gave us insight into the above-ground carbon stocks and the
The PCR sampling recommendation is to take the square root of the number of
                                                                                                                     rate of carbon sequestration. These biomass models do not take below-ground
farmers in situations where little variation in production practices is prevalent.
                                                                                                                     biomass change into account, as this requires destructive analysis in which trees
While robusta coffee production practices in Vietnam differ between provinces,
                                                                                                                     are completely uprooted to be analyzed, which is beyond the scope of this study.
the variability within provinces is more limited. Based on the PCR guidelines, the
                                                                                                                     Carbon stock values are adjusted for the number of trees in a species/age group
samples in the provinces are each representative of 22,500 farmers. Coffee farm-
                                                                                                                     that a farmer uproots or stumps. Pruning waste is not taken into account.
er numbers in Dak Lak and Lam Dong are estimated at 170,000 and 123,0004
respectively. Our sample cannot therefore be considered representative for both                                      CO2e emissions from agriculture come from various sources such as land clear-
provinces. To achieve that, the program would require 413 FFB farmers (square                                        ing, energy, fertilizers and pesticides. Emissions from energy usage are calculated
root of 170,000 plus 1 for rounding) in Dak Lak and 351 in Lam Dong. However,                                        by multiplying the volume of the energy sources used by the appropriate emis-
this study represents our best estimate to date, and to our knowledge the first                                      sion factors for Vietnam6. Emissions from electricity usage are calculated by mul-
attempt in the Vietnam coffee sector to include carbon sequestration as well as                                      tiplying the amount used by the Vietnam conversion factor for grid electricity7.
greenhouse gas (CO2e) emissions.

3   Three farmers in the sample had no yields due to large scale renovation of their farms. These are not taken      6   IPCC (2006). 2006 IPCC Guidelines for National Greenhouse Gas Inventories. Vol 1-5
    into account in this report as much of the analysis is done on a per Mt coffee basis.                            7	Ecometrica (2011). Technical Paper. Electricity-specific emission factors for grid electricity (Matthew Brander
4   IDH (2013): http://www.sustainablecoffeeprogram.com/site/getfile.php?id=203                                        et al.) https://ecometrica.com/assets/Electricity-specific-emission-factors-for-grid-electricity.pdf
5   Diameter at Breast Height is the international standard to measure diameter of trees at 4.5 feet or 1.3 meters
    above the ground

                                                                                                                                                                                                                                         5
Emissions from agrochemicals are caused by production, transport and direct                                          coffee drying. Emissions from pesticide usage also fall into this category. We
and indirect emissions from applications of fertilizer, manure and organic matter,                                   have measured them, but they contribute less than 2 kilograms of CO2e per
mainly in the form of N2O8. To estimate total emissions from agrochemical use,                                       metric ton of coffee. This effectively leaves us with emissions from fertilizer and
we therefore first multiply emission factors for fertilizer and pesticide produc-                                    energy to be taken into account.
tion9 by the type and volume farmers have applied to cover emissions related
                                                                                                                     The medium and highly diversified farms grow more crops than coffee alone. The
to production and transport. Direct and indirect N2O emissions are estimated
                                                                                                                     emissions associated with fertilizer must be allocated to the specific crops har-
based on the type and volume of fertilizer applied, its N content and the type of
                                                                                                                     vested on a farm, as different crops have different rates of nitrogen uptake and
N contained in it, combined with the N2O emission factors for the appropriate
                                                                                                                     use. To do so, we use the allocation rates for other crops grown from the PCR.
agro-ecological zone10. N2O emissions from different types of fertilizer that con-
tain nitrogen, compost and manure are then converted to the amount of CO2e                                           In coffee supply chains where wet processing takes place, significant methane
per kilogram of N from each type that was applied to the field.                                                      emissions occur from decomposing organic material contained in waste water11.
                                                                                                                     Robusta coffee grown on the sample farms is dry processed, which means meth-
                                                                                                                     ane emissions from processing do not play a major role. Should farmers decide
      CO2e emissions from agriculture come from                                                                      to apply composted coffee pulp to their farm, then emissions associated with the
      various sources such as land clearing, energy,                                                                 composting process are factored into the emissions associated with fertilizer.
      fertilizers and pesticides
                                                                                                                     Validity
                                                                                                                     Crop surveys from industry sources estimate the total production from Dak Lak
Methane (CH4) is an greenhouse gas that is predominantly produced in wetlands                                        and Lam Dong at 16.2 million 60-kilogram bags of coffee in the 2017/18 season.
(such as paddy rice and marshes) and by ruminants (e.g. cows, sheep). As both                                        According to the USDA’s PS&D database12, global coffee production was 159.9
wetlands and ruminants almost do not occur in the Vietnamese coffee produc-                                          million 60-kilogram bags in the 2017/18 market year, of which 65.9 million bags
ing areas, we have left CH4 out in this paper.                                                                       are robusta. The two provinces are therefore responsible for around 10% of glob-
                                                                                                                     al coffee production and 25% of global robusta production.
Calculations of carbon emissions are subject to certain boundary conditions set
by the PCR. Emissions from land-use change, for example when clearing a forest                                       The PCR requires averages taken from three years’ worth of data to be used
to plant coffee, need to be taken into account if these changes occurred within                                      in carbon footprint calculations, but in this case only two years of data were
the preceding 20 years. Large-scale land clearing took place in the development                                      available at the time of writing13. We focus on the carbon footprint at farm level,
of the Vietnam coffee sector, but among the farmers in this sample, and indeed                                       whereas the PCR requires GHG emissions to be calculated from farm to port of
for most of the Vietnam coffee sector, the clearing took place more than 20                                          origin (FOB) or the warehouse of a domestic roaster (CIF).
years ago and is therefore not included in this calculation. Production of dura-
                                                                                                                     The carbon stock and sequestration modelling is a first attempt. For several of
ble goods that are expected to be used for more than three years are also not
                                                                                                                     the species, including robusta coffee, there are no allometric models available. It
included as per the PCR guidelines.
                                                                                                                     was beyond the scope of this study to fill those research gaps. We recommend
Aspects of production that individually make up less than 1% of the total emis-                                      not taking the sequestration rates and stocks as 100% accurate; rather, they
sions are considered insignificant and are not required to be taken into account.                                    provide a starting point from which we expect to introduce increasing levels of
These include plastics used for coffee packaging, buckets, and tarpaulins for                                        refinement as future projects allow for more detailed estimations.

                                                                                                                     next steps
8   Nitrous Oxide (N2O) is a greenhouse gas with a global warming potential of more than 300 times greater              Summary
                                                                                                                     • If   we are  of available
                                                                                                                                        serious   measurement data. GLOBAL
                                                                                                                                                    about halting           BIOGEOCHEMICAL
                                                                                                                                                                      imported                 CYCLES, VOL. 16, NO. 4, 1058,
                                                                                                                                                                                    deforestation,governments,             NGOs
    than carbon dioxide (CO2). Nitric Oxide (NO) is also emitted from the soil, but is not a greenhouse gas, so is      doi:10.1029/2001GB001811, 2002
    not included in our calculation of emission of greenhouse gasses (http://www.soest.hawaii.edu/mguidry/Un-        11 and
                                                                                                                        Killian,the
                                                                                                                                 B. et private     sector
                                                                                                                                       al (2013). Carbon   in EUacross
                                                                                                                                                         Footprint timber    importingcountries
                                                                                                                                                                        the Coffee                      need
                                                                                                                                                                                   Supply Chain: The Case       a deforestation
                                                                                                                                                                                                          of Costa Rican Coffee.
    named_Site_2/Chapter%202/Chapter2C3.html).                                                                            Journal of Agricultural Science and Technology B 3 (2013) pp. 151-170
9   Cremaschi, D.G. (2016). Sustainability metrics for agri-food supply chains. PhD thesis, Wageningen University,   12   https://apps.fas.usda.gov/psdonline/app/index.html#/app/downloads
    Wageningen, NL
                                                                                                                     13   As the FFB program in Vietnam will run for at least another season, we expect to be able to update this report
10 Bouwman, A.F., L.M.J. Boumans and N.H. Batjes (2002). Emissions of N2O and NO from fertilized fields:                  with three years of data after the 2018/19 season.

                                                                                                                                                                                                                                           6
3.
RESULTS
Carbon emissions Figure 2. CO2e Emissions by Source and Yield, Level of Diversification and Season
Total emissions of farm-level robusta coffee production were 1.52 metric tons of
CO2e per metric ton of coffee in 2016/17 and 1.26 metric tons of CO2e per met-
ric ton of coffee in 2017/18, bringing the two-year average to 1.39 metric tons of 1.8 4.5
CO2e per metric ton of coffee (Figure 1). The two sources of emissions are fer- 1.6 4
(Mt CO2e/Mt Coffee)
tilizer and energy use, as emissions from pesticide usage were found to be less 1.4 3.5
Carbon Emissions
Yield (Mt/ha)
than 2 kilograms CO2e per metric ton of coffee, and were therefore not taken into 1.2 3
account as prescribed by the PCR. On average, 73% of total emissions are from 1.0 2.5
fertilizer use and 27% from energy use. 0.8 2
0.6 1.5
0.4 1
0.2 0.5
0 0
Figure 1. CO2e Emissions by Source and Season
‘16/’17 ‘17/’18 ‘16/’17 ‘17/’18 ‘16/’17 ‘17/’18
1.6 MONOCROP MEDIUM DIVERSIFIED HIGHLY DIVERSIFIED
(n=156) (n=35) (n=106)
1.4
(Mt CO2e/Mt Coffee)
Fertilizer Energy Yield
1.2
Carbon Emissions
1.0
0.8
0.6
Yield levels among the monocrop farms went down by 17%, compared to a 7%
0.4 reduction among the medium diversified and highly diversified farms. The lower
0.2 absolute yield levels among highly diversified farms are largely explained by loca-
0
tion effects as most of them are situated in Dak Lak province, while the majority
2016/2017 2017/2018 of monocrop farms are in Lam Dong province. Fertilizer application levels among
monocrop farms did not show any statistically significant change between the
Fertilizer Energy
seasons. This explains the slight increase in emissions associated with fertilizer
applications among farms in this group. The project agency that works with most
of the highly diversified farms seems to have put more emphasis on optimizing
In the 2016/17 season, rainfall during the flowering of the coffee was low, which fertilizer applications. We see this reflected in lower application levels per hect-
required farmers to irrigate more water than normal. This explains the rela- are in 2017/18. We cannot reliably allocate part of the emissions to other crops in
tively much higher energy use of 0.47 metric tons of CO2e for pumping water 2016/17; but given lower fertilizer use in 2017/18 and a relatively small yield decline
compared to the 0.29 metric tons of CO2e in 2017/18. Emissions from fertilizer of 7%, we think it likely that the carbon efficiency of medium diversified and high-
amounted to around 1 metric ton of CO2e per metric ton of green bean. The total ly diversified farms has improved over time. Nonetheless, the highly diversified
emissions from fertilizer have not changed significantly, but when broken down farms have statistically significantly higher emissions than the monocrop farms.
by level of diversification of the farm, the picture changes (Figure 2). On diver-
Also notable is that emissions from energy use decreased for each agroforestry
sified farms, the PCR requires allocation of fertilizer emissions to the different
class as a result of higher rainfall during the coffee flowering period in 2017/18.
crops harvested. During the 2016/17 season, no harvest information was collect-
This resulted in significantly lower volumes of irrigation water being applied, and
ed for crops other than coffee. We have therefore applied the 2017/18 allocation
therefore less energy used for pumping (Figure 3).
factors to the 2016/17 data for those farms that grow other crops.
7Figure 3. Change in CO2e Emissions and Yields from 2016/17 to 2017/18 by Figure 4. Carbon Stocks per ha by Agroforestry Type and Season
Agro-Foresty Type
5% 60 10%
Change on Previous
50
Carbon Stocks
(Mt CO2e/ha)
0% 8%
-5 % 40
6%
-10 % 30
4%
20
-15 %
10 2%
-20 %
0 0%
-25 % ‘16/’17 ‘17/’18 ‘16/’17 ‘17/’18 ‘16/’17 ‘17/’18
-30 %
MONOCROP MEDIUM DIVERSIFIED HIGHLY DIVERSIFIED
-35 %
-40 %
Coffee Other trees Change on previous
-45 %
MONOCROP MEDIUM DIVERSIFIED HIGHLY DIVERSIFIED
(n=156) (n=35) (n=106) The secondary Y-axis shows the rate of change in total carbon stocks from 2016/17 to 2017/18
Fertilizer Energy Yield
In conclusion, when looking only at emissions per unit of coffee, the three agro- diversified farms, we expect the contribution of non-coffee trees to increase sig-
forestry classes show an inter-seasonal reduction in emissions. The highly di- nificantly over the coming five to ten years, as the diversification on these farms
versified farms are consistently less carbon-efficient per unit of coffee than the is a fairly recent phenomenon and many of the non-coffee trees have not yet
monocrop farms. The data period we have so far is not without its limitations, but matured.
we do see tentative indications that lower yield change correlates with a higher
For our purposes, the carbon sequestration is defined as the change in car-
percentage of non-coffee trees on the farm.
bon stocks per hectare or metric ton of coffee over a defined period of time, in
this case the coffee seasons. Figure 4 shows a larger total carbon stock rate of
Carbon stocks and sequestration
change on the highly diversified farms. In absolute terms, their carbon seques-
Estimated average carbon stocks were 42 metric tons of CO2e per hectare across
tration is 3.9 metric tons of CO2e per hectare per season compared to 2.8 metric
all farms in the 2016/17 season. This increased to 44.9 metric tons of CO2e per
tons of CO2e per hectare per season for the monocrop farms, and 3.0 metric tons
hectare in the 2017/18 season. The medium diversified and highly diversified farm-
of CO2e per hectare per season for the medium diversified farms.
ing systems show a slightly better performance, with their carbon stock being
15% and 11% higher respectively than the monocrop farms in the 2017/18 season.
Carbon footprint
The highly diversified farms show a slightly higher rate of carbon stock change
One of the questions posed by the ISLA landscape program is whether an in-
from 2016/17 to 2017/18: 8.7% compared to 7.0% and 6.8% respectively for the
creased level of diversification with other tree crops can offset part of the emis-
monocrop and medium diversified farms (green circles related to right hand axis
sions, or even transform farms from carbon sources into carbon sinks.
on percentage change; Figure 4).
The carbon footprint is calculated by subtracting the sequestration from the
Irrespective of the agroforestry class, coffee is the largest contributor to the total
emissions. A negative carbon footprint therefore means that the farm acts as a
carbon stocks per hectare. Coffee planting density is slightly lower among the
carbon sink, removing more carbon from the air than is emitted during produc-
highly diversified farms, but not by much. The contribution of non-coffee trees to
tion. We found that the majority of the highly diversified farms act as carbon
the total carbon stock is 11% among the highly diversified farms, compared to 5%
sinks (Figure 5).
on the medium diversified farms and 1% on the monocrop farms. On the highly
8Figure 5. CO2e emissions and sequestration by farm and agroforestry class Figure 6. Share of Farmers and Emission-Sequestration Balance by Farming System
for 2017/18
Agroforestry Class
6 HIGHLY DIVERSIFIED
FARMS THAT ARE CARBON SINKS
5 MEDIUM DIVERSIFIED
(MT CO2e/MT coffee/year)
Carbon sequestration
4 MONOCROP
0% 20% 40% 60% 80% 100%
3 Share of farmers
net carbon sources net carbon sinks
2
Figure 7. Carbon emissions, sequestration and footprint by agroforestry class
1
in 2017/18
FARMS THAT ARE CARBON SOURCES
0
(MT CO2e /MT coffee/year)
2.0
0 1 2 3 4 5 6 1.5
1.0
Volume CO2e
Carbon emissions (MT CO2e/MT coffee/year)
0.5
MONOCROP MEDIUM DIVERSIFIED HIGHLY DIVERSIFIED LINEAR (X-=Y)
0
0.5
-1.0
The X=Y line indicates where emissions equal sequestration. Farms above the line act as carbon sinks,
-1.5
those below it as carbon sources. -2.0
MONOCROP MEDIUM DIVERSIFIED HIGHLY DIVERSIFIED
(n=156) (n=35) (n=106)
Of the highly diversified farms, 73% are carbon sinks while 27% are sources of Emissions Sequestrations Footprint
carbon (Figure 6). The latter tend to be farms that have quite recently diversified,
and we would expect them to start acting as carbon sinks when their non-coffee
trees mature. For the monocrop farms, the picture is reversed, with 70% acting sions. Recall that fertilizer-related emissions are allocated to coffee and other
as carbon sources. The 30% of monocrop farms that do act as carbon sinks (on crops based on harvest volumes and N uptake rates of each crop. Fertilizer used
a per-metric-ton-of-coffee basis), are those that are both highly productive and for other crops is therefore not part of emissions, even though sequestration by
highly efficient in terms of fertilizer use. On those farms, the CO2e volume cap- non-coffee trees is included.
tured with the biomass increase of coffee trees exceeds the emissions. Combined
When we remove the allocation factors from the emissions and assign all fertil-
with the emissions data, we found that highly diversified farms have a negative
izer-related emissions solely to coffee, irrespective of other crops grown on the
carbon footprint (Figure 7). On average, these farms remove 0.16 metric tons of
farm, the footprint of monocrop farms hardly changes. However, the footprint for
CO2e per season from the atmosphere for every metric ton of coffee they pro-
medium diversified farms changes from 0.11 to 0.13 metric tons of CO2e per met-
duce. The medium diversified farms and monocrop farms on the other hand emit
ric ton of coffee per year, while the footprint of highly diversified farms changes
0.11 and 0.37 metric tons of CO2e per metric ton of coffee produced, respectively.
from -0.16 to -0.13 metric tons of CO2e per metric ton of coffee per year. We can
It is arguable that the comparison shown in Figure 7 is not entirely fair given that therefore conclude that including fertilizer-related emissions from other crops
non-coffee crops are included in the sequestration values, but not in the emis- slightly changes the footprint values, but the overall pattern remains the same.
94.
Conclusion
Fertilizer is by far the most important contributor to carbon emis-
sions in Vietnam’s coffee production, followed by energy. Fertilizer
application levels are fairly stable from one year to the next, but
energy use varies with rainfall levels during the coffee flowering
period. When rainfall is lower than usual, energy usage goes up as
farmers increase the volumes of irrigation water they apply. Other
sources of emissions such as pesticides are negligible, contribut-
ing around 2 kilograms of CO2e per metric ton of coffee.
Despite a significant number of highly diversified farms, the
majority of carbon stocks are in coffee trees. The rate of seques-
tration on highly diversified farms is higher than that of farms in
the other agroforestry classes. Coupled with the fact that diversi-
fication is a more recent phenomenon on a number of farms, this
leads us to believe that the role of highly diversified farms in act-
ing as carbon sinks will continue to grow over the coming years.
This report shows that coffee farms in Vietnam can act as carbon
sinks without sacrificing yields. Highly diversified farms with more
than 30% non-coffee trees on their farm on average act as carbon
sinks, and sequester 0.16 metric tons of CO2e per year for every
metric ton of coffee they produce. This is in contrast with mono-
crop farms, which emit 0.37 metric tons of CO2e per year for every
metric ton of coffee produced.
We also found that 30% of the monocrop farms and 49% of the
medium diversified farms are carbon sinks. In these cases, the use
of fertilizer tends to be better optimized and more efficient rela-
tive to the yields the farms achieve.
While the period on which this analysis is based covers only two
years, it appears that diversification of monocrop coffee farms in
Vietnam’s Central Highlands is a viable strategy to transform the
sector’s contribution to climate change from carbon source to
carbon sink. Another priority is to optimize fertilizer management
on those farms that are currently carbon sources.
Enquiries
On the ISLA landscape facility: Lisa Ståhl, stahl@idhtrade.com
On the FFB and content of this report:
Michiel Kuit, michiel@agri-logic.nl
www.idhtrade.org
10You can also read