EXPLAINING EXTREME EVENTS OF 2018 - From a Climate Perspective - AMS ...
←
→
Page content transcription
If your browser does not render page correctly, please read the page content below
EXPLAINING EXTREME
EVENTS OF 2018
From a Climate Perspective

                                                       Downloaded from http://journals.ametsoc.org/bams/article-pdf/101/1/S1/4918831/bams-d-19-0275_1.pdf by guest on 30 November 2020

                 Special Supplement to the
     Bulletin of the American Meteorological Society
               Vol. 101, No. 1, January 2020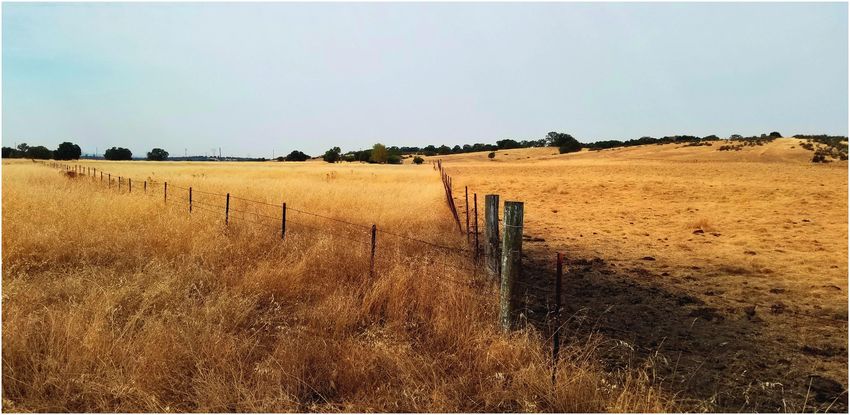
EXPLAINING EXTREME
EVENTS OF 2018 FROM A
 CLIMATE PERSPECTIVE

                                                              Downloaded from http://journals.ametsoc.org/bams/article-pdf/101/1/S1/4918831/bams-d-19-0275_1.pdf by guest on 30 November 2020
                            Editors

   Stephanie C. Herring, Nikolaos Christidis, Andrew Hoell,
            Martin P. Hoerling, and Peter A. Stott

          BAMS Special Editors for Climate

              Andrew King, Thomas Knutson,
         John Nielsen-Gammon, and Friederike Otto

                Special Supplement to the

          Bulletin of the American Meteorological Society

                  Vol. 101, No. 1, January 2020

       American Meteorological Society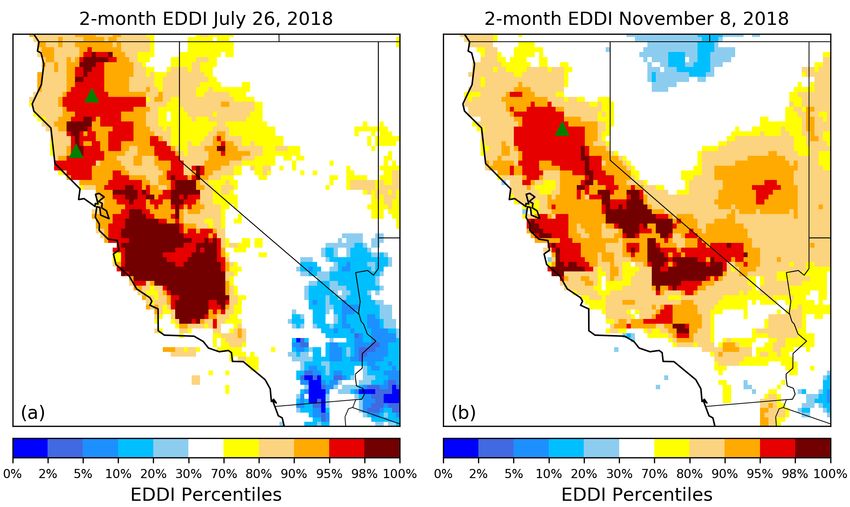
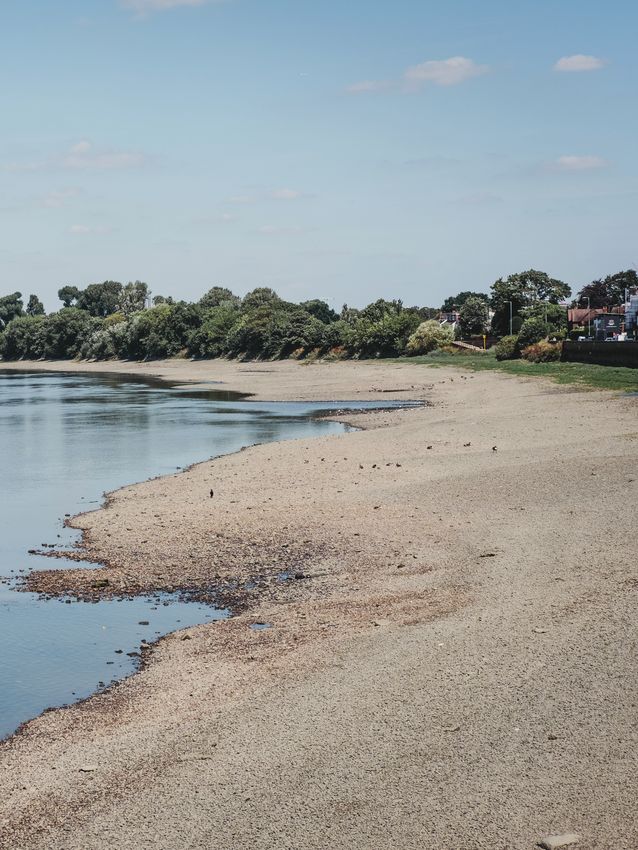
Downloaded from http://journals.ametsoc.org/bams/article-pdf/101/1/S1/4918831/bams-d-19-0275_1.pdf by guest on 30 November 2020
Corresponding Editor:

Stephanie C. Herring, PhD
NOAA National Centers for Environmental Information
325 Broadway, E/CC23, Rm 1B-131
Boulder, CO, 80305-3328
E-mail: stephanie.herring@noaa.gov

Cover Credit: iStock.com/Alena Kravchenko—River Thames receded during a heatwave in summer 2018 in London, United
Kingdom.

HOW TO CITE THIS DOCUMENT

Citing the complete report:

Herring, S. C., N. Christidis, A. Hoell, M. P. Hoerling, and P. A. Stott, Eds., 2020: Explaining Extreme Events of 2018 from a
Climate Perspective. Bull. Amer. Meteor. Soc., 101 (1), S1–S128, doi:10.1175/BAMS-ExplainingExtremeEvents2018.1.

Citing a section (example):

Mahoney, K., 2020: Extreme Hail Storms and Climate Change: Foretelling the Future in Tiny, Turbulent Crystal Balls? [in
“Explaining Extremes of 2018 from a Climate Perspective”]. Bull. Amer. Meteor. Soc., 101 (1), S17–S22, doi:10.1175/BAMS-
D-19-0233.1.

Sii   |        JANUARY 2020
TABLE OF CONTENTS

       1. The Extreme 2018 Northern California Fire Season. . . . . . . . . . . . . . . . . . . . . . . . . . . . . . . . . 1
       2. Anthropogenic Impacts on the Exceptional Precipitation of 2018
          in the Mid-Atlantic United States . . . . . . . . . . . . . . . . . . . . . . . . . . . . . . . . . . . . . . . . . . . . . . . . 5
       3. Quantifying Human-Induced Temperature Impacts on the 2018 United States
          Four Corners Hydrologic and Agro-Pastoral Drought. . . . . . . . . . . . . . . . . . . . . . . . . . . . . . 11

                                                                                                                                                                                Downloaded from http://journals.ametsoc.org/bams/article-pdf/101/1/S1/4918831/bams-d-19-0275_1.pdf by guest on 30 November 2020
       4. Extreme Hail Storms and Climate Change: Foretelling the Future in Tiny,
          Turbulent Crystal Balls?. . . . . . . . . . . . . . . . . . . . . . . . . . . . . . . . . . . . . . . . . . . . . . . . . . . . . . . 17
       5. The Extremely Cold Start of the Spring of 2018 in the United Kingdom. . . . . . . . . . . . . . . . 23
       6. The Exceptional Iberian Heatwave of Summer 2018. . . . . . . . . . . . . . . . . . . . . . . . . . . . . . . . 29
        7. Analyses of the Northern European Summer Heatwave of 2018. . . . . . . . . . . . . . . . . . . . . . 35
       8. Anthropogenic Influence on the 2018 Summer Warm Spell in Europe:
          The Impact of Different Spatio-Temporal Scales. . . . . . . . . . . . . . . . . . . . . . . . . . . . . . . . . . . . . . . . . . 41
       9. On High Precipitation in Mozambique, Zimbabwe and Zambia in February 2018. . . . . . . . . 47
      10. The Record Low Bering Sea Ice Extent in 2018: Context, Impacts,
          and an Assessment of the Role of Anthropogenic Climate Change. . . . . . . . . . . . . . . . . . . . 53
      11. The Late Spring Drought of 2018 in South China. . . . . . . . . . . . . . . . . . . . . . . . . . . . . . . . . . . 59
      12. Anthropogenic Influence on 2018 Summer Persistent Heavy Rainfall
          in Central Western China. . . . . . . . . . . . . . . . . . . . . . . . . . . . . . . . . . . . . . . . . . . . . . . . . . . . . 65
      13. Conditional Attribution of the 2018 Summer Extreme Heat over Northeast China:
          Roles of Urbanization, Global Warming, and Warming-Induced Circulation Changes . . . . . . 71
      14. Effects of Anthropogenic Forcing and Natural Variability
          on the 2018 Heatwave in Northeast Asia. . . . . . . . . . . . . . . . . . . . . . . . . . . . . . . . . . . . . . . . . 77
      15. Anthropogenic Influences on the Persistent Night-Time Heat Wave
          in Summer 2018 over Northeast China . . . . . . . . . . . . . . . . . . . . . . . . . . . . . . . . . . . . . . . . . . 83
      16. Anthropogenic Contributions to the 2018 Extreme Flooding over the
          Upper Yellow River Basin in China. . . . . . . . . . . . . . . . . . . . . . . . . . . . . . . . . . . . . . . . . . . . . . 89
      17. Attribution of the Record-Breaking Consecutive Dry Days in Winter 2017/18
          in Beijing. . . . . . . . . . . . . . . . . . . . . . . . . . . . . . . . . . . . . . . . . . . . . . . . . . . . . . . . . . . . . . . . . . . 95
      18. Quantifying Human Impact on the 2018 Summer Longest Heat Wave
          in South Korea. . . . . . . . . . . . . . . . . . . . . . . . . . . . . . . . . . . . . . . . . . . . . . . . . . . . . . . . . . . . . 103
      19. The Heavy Rain Event of July 2018 in Japan Enhanced by Historical Warming. . . . . . . . . . . 109
      20. Deconstructing Factors Contributing to the 2018 Fire Weather
          in Queensland, Australia . . . . . . . . . . . . . . . . . . . . . . . . . . . . . . . . . . . . . . . . . . . . . . . . . . . . . 115
      21. A 1-Day Extreme Rainfall Event in Tasmania: Process Evaluation
          and Long Tail Attribution . . . . . . . . . . . . . . . . . . . . . . . . . . . . . . . . . . . . . . . . . . . . . . . . . . . . . . . . . . . . . .  123

AMERICAN METEOROLOGICAL SOCIETY                                                                                                          JANUARY 2020                  | Siii
Downloaded from http://journals.ametsoc.org/bams/article-pdf/101/1/S1/4918831/bams-d-19-0275_1.pdf by guest on 30 November 2020
JANUARY 2020
|
Siv1
chapter
THE NORTHERN CALIFORNIA
2018 EXTREME FIRE SEASON
Timothy Brown, Steve Leach, Brent Wachter, and Billy Gardunio
T
he fire season of 2018 was the most extreme on that period caused 22 fatalities and the loss of 5,636
record in Northern California in terms of the structures, and at the time was California’s most
number of fatalities (95), over 22,000 structures destructive fire on record dating back to the early
destroyed, and over 600,000 ha burned (https:// 1900s. Instead, a series of climate and fuels condi-
www.fire.ca.gov/media/5511/top20_destruction. tions aligned to create an exceptional and explosive
pdf; accessed 24 November 2019). The most deadly fire environment between June to November 2018 in
Downloaded from http://journals.ametsoc.org/bams/article-pdf/101/1/S1/4918831/bams-d-19-0275_1.pdf by guest on 30 November 2020
and destructive fire in California history, the Camp naturally fire-prone areas with a substantial wild-
Fire, occurred in Butte County in the Sierra Nevada land–urban interface—a zone where human devel-
foothills in early November, and caused 85 fatalities opment meets and intermingles with wildland fuels.
and destroyed nearly 19,000 structures. The largest
fire complex in state history, the Mendocino Complex, CLIMATE AND FUELS. Climate enables fire and
which included the Ranch fire, the largest single fire weather drives fire. The 2018 Northern California fire
in state history, burned nearly 186,000 ha. It occurred season origins began during the winter of 2016/17.
in July and August, killing one firefighter. In western Precipitation, which was much above normal, ex-
Shasta County nearly 138,000 ha burned from July ceeded the 90th percentile ranking across much of
through September in the Carr, Hirz, and Delta Fires. the state at low to middle elevations. Some of the
These fires caused multiple closures of Interstate 5 and higher elevations in the Sierra Nevada range were
exhibited some of the most extreme fire behavior ever the wettest on record. November through April is
observed in California. The Carr Fire caused eight climatologically the wet season in northern Califor-
fatalities, including two firefighters and two workers nia. This particular wet winter ended the statewide
supporting firefighting efforts, burned over 1,100 hydrologic drought from 2011–17. The significance of
homes in west Redding, caused the evacuation of one- this wet season was that it led to the second consecu-
third of the city, and produced an extreme fire vortex tive spring with above average fine fuel (grasses) crop
with an Enhanced Fujita scale rating between 136 to across much of Northern California.
165 mph, making it arguably the strongest tornado The 2017–18 Northern California wet season was
type event in state history, and one of the strongest drier than normal, and temperatures were generally
documented cases in the world (Lareau et al. 2018). above normal, with the warmest conditions from the
Actual weather during the onset of these large fires Cascade–Sierra foothills through the Sacramento
was not outside of what would normally be expected Valley and into the northern Coast Range. A lack
during periods of higher fire danger that occur during of stormy weather during this period allowed above
most fire seasons, as opposed to the extreme offshore normal standing carry-over fine fuels from the previ-
wind event that led to the October 2017 wine coun- ous wet year. April 2018 was warmer and wetter than
try fires (Nauslar et al. 2018). The Tubbs fire during normal. This was perfectly timed to produce above
normal spring brush growth and grow a record fine
fuel crop at elevations below 1,200 m, despite the
overall wet season rainfall deficit (Fig. 1). This was
AFFILIATIONS: B rown —Western Regional Climate Center, the third straight spring with an above average fine
Desert Research Institute, Reno, Nevada; Leach —Bureau fuel crop based on data taken at the University of
of Land Management, Redding, California; Wachter and California Sierra Foothill Research and Extension
Gardunio —USDA Forest Service, Redding, California
Center. The Brown’s Valley, California, research
CORRESPONDING AUTHOR: Timothy Brown, tim.brown@
dri.edu
station forage production data have been reported
continuously since the 1979/80 growing season.
DOI:10.1175/BAMS-D-19-0275.1
Three straight above normal growing seasons had
© 2020 American Meteorological Society not occurred in the dataset prior to the 2017/18
For information regarding reuse of this content and general copyright
information, consult the AMS Copyright Policy. growing season. Peak forage production toward the
end of spring was 150% of normal (https://ucanr
AMERICAN METEOROLOGICAL SOCIETY JANUARY 2020 | S1Downloaded from http://journals.ametsoc.org/bams/article-pdf/101/1/S1/4918831/bams-d-19-0275_1.pdf by guest on 30 November 2020
Fig. 1. Photo of fine fuel grass loading taken on 12 Sep 2018 about 60 miles northwest of the Camp Fire location.
Left of the fence line shows a continuous bed of fine fuel. The paddock to the right of the fence line has less fuel
due to grazing. Photo: Brent Wachter, Predictive Services.
.shinyapps.io/SFREC_Web_Application/; accessed -overnight-heat-california-and-great-basin-july-2018;
24 November 2019) and the maximum value during accessed 24 November 2019). These warm tempera-
the 40-yr history. As a testament to the abundant and tures led to more nights of poor overnight humidity
continuous fine fuel growth, firefighters during 2018 recovery, which has direct implications on the flam-
often described arriving to a larger fire compared to mability of fuel. The poor recoveries led to unusually
what was normally observed during initial attack long active burn periods during the overnights and set
situations, thus making the fires harder to contain the stage for earlier active burning during the daytime
(Northern California Predictive Services, personal hours. This created more hours of active to extreme
communication, 24 July 2019). fire behavior and provided less opportunity for direct
The summer of 2018 in Northern California had attack by firefighters (Northern California Predictive
two notable climate anomalies—lack of rain and Services, personal communication, 24 July 2019).
warmer than average temperatures. This led to a rapid
curing of the annual fine fuels and drying of live fuels. WEATHER. Long periods dominated by strong
For the most part, rain shut off in late April and did high pressure occurred in July, which hastened the
not return until late November. In the Sacramento summer drying of fuels. The hottest day of the year
Valley and foothills only two light rain events pro- in the Sacramento Valley was 26 July, setting all-time
duced approximately 15 mm each, one in late May and records for the date, and was a key element in the
the other in late September to early October. The lack conditions that rapidly brought the Carr Fire into
of precipitation from late spring through the middle Redding, California. Other large-scale fires started
of November caused fuels to dry out to record levels. that week as well, including the Mendocino Complex.
The summer of 2018 was warmer than average in Interestingly, temperatures were slightly cooler than
Northern California. Afternoon maximum tempera- normal during August and September in areas where
tures were not extraordinarily high compared to 2017. thick smoke from nearby wildfires persisted for un-
Rather, it was the warm morning minimum tempera- usually long periods. Northern California had a very
tures that pushed the overall average temperature in low occurrence of lightning during the 2018 fire sea-
July 2018 to record high levels. Record high lows for son. Roughly 12,000 lightning strikes were recorded
California were observed in July, continuing a positive during the fire season, compared to the long-term
trend of nighttime warming since 1895, (https://www average of more than 30,000 strikes (in Northern
.climate.gov/news-features/event-tracker/extreme California lightning accounts for the majority of fire
S2 | JANUARY 2020ignitions, while in Southern California human causes radiation. These are also key factors in determining
dominate ignitions; Balch et al. 2017). Dry offshore dead fuel moisture calculated in the newly updated
wind events, which typically increase in occurrence National Fire Danger Rating System (https://gacc.
after the middle of September, occurred with fuels nifc.gov/eacc/predictive_services/fuels_fire-danger
at extreme and record dry levels. The Camp Fire on /documents/Overview%20of%20NFDRS2016%20
8 November was the result of an ignition occurring and%20Implementation%20and%20Evaluation.pdf;
in extremely dry fuels during an enhanced strong and accessed 24 November 2019). Starting in late July, fire
dry downslope wind pattern. danger indicators in northern California such as the
energy release component (the amount of energy at
FIRE ENVIRONMENT. The precipitation deficit the head of fire’s flaming front) approached all-time
at the close of the 2017/18 rainy season combined with record high values accentuating the impact of the
drier and warmer than normal summer conditions anomalously warm and dry summer on fuels. In ef-
caused an expansion and intensification of short-term fect, fuel regimes found at all elevations (sea level to
Downloaded from http://journals.ametsoc.org/bams/article-pdf/101/1/S1/4918831/bams-d-19-0275_1.pdf by guest on 30 November 2020
drought across northern California. The Evaporative over 3,000 m) had a large fire potential by July.
Demand Drought Index (EDDI; Hobbins et al. 2016;
McEvoy et al. 2016) clearly illustrates the intensity of SUMMARY. Both 2017 and 2018 were extreme fire
short-term drought conditions during late July when years in California. While this paper has focused on
significant fires started (Fig. 2a), and even more so in Northern California in 2018, Southern California
November as dry northeast/offshore wind patterns that year also saw its share of extreme fire including
became more frequent and the Camp Fire broke out the Ferguson (two firefighter fatalities, 19 structures
(Fig. 2b). Evaporative demand relates to the thirst of destroyed, and approximately 39,000 ha burned),
the atmosphere which directly corresponds to fuel Cranston, and Holy Fires. On the same day as the
stress (higher values equate to more stress). There Camp Fire, 8 November, two large fires developed
is a close correlation between EDDI values and fire in Ventura and Los Angeles County, including the
danger (McEvoy et al. 2019) including extreme fire Woolsey Fire (approximately 39,000 ha burned and
behavior and spread rates. EDDI comprises inputs over 1,600 structures destroyed). Following the un-
of temperature, humidity, wind speed, and solar usually late season December 2017 Thomas Fire in
Fig. 2. Evaporative Demand Drought Index 2-month categories for (a) 26 Jul 2018, and (b) 8 Nov 2018. Triangles
represent the Mendocino (lower),Carr (upper), and Camp fire locations, respectively.
AMERICAN METEOROLOGICAL SOCIETY JANUARY 2020 | S3the Ventura and Santa Barbara county area, a post- Balch, J. K., B. A. Bradley, J. T. Abatzoglou, R. C. Nagya,
fire debris flow event occurred over the burn area on E. J. Fuscod, and A. L. Mahood, 2017: Human-started
9 January resulting in 23 fatalities and 246 structures wildfires expand the fire niche across the United
destroyed (Oakley et al. 2018). States. Proc. Natl. Acad. Sci. USA, 114, 2946–2951,
Climate, fuels, and people are the three confluent https://doi.org/10.1073/pnas.1617394114.
factors for California’s recent destructive wildfires. Bedsworth, L., D. Cayan, G. Franco, L. Fisher, and S.
The wildland–urban interface has been growing ex- Ziaja, 2018: Statewide Summary Report. California’s
tensively within the state during the past few decades Fourth Climate Change Assessment, California Pub-
(e.g., Radeloff et al. 2018), placing people in fire-prone lic Utilities Commission Publication SUM- CCCA4-
areas. Climate is an enabler of wildfire by provid- 2018-013, 133 pp.
ing seasonal moisture to grow fuels, and seasonal Hobbins, M., A. Wood, D. McEvoy, J. Huntington,
warming and drying that increases fuel flammabil- C. Morton, M. Anderson, and C. Hain, 2016: The
ity. Increasing temperature trends enable longer and evaporative demand drought index. Part I: Link-
Downloaded from http://journals.ametsoc.org/bams/article-pdf/101/1/S1/4918831/bams-d-19-0275_1.pdf by guest on 30 November 2020
more extreme fire seasons. California’s annual tem- ing drought evolution to variations in evaporative
peratures have been increasing substantially during demand. J. Hydrometeor., 17, 1745–1761, https://doi.
the past four decades and are expected to continue org/10.1175/JHM-D-15-0121.1.
warming this century (California’s Fourth Climate Jolly, W. M., M. A. Cochrane, P. H. Freeborn, Z. A.
Assessment; Bedsworth et al. 2018). Abatzoglou and Holden, T. J. Brown, G. J. Williamson, and D. M. J. S.
Williams (2016) have shown that California (as well Bowman, 2015: Climate-induced variations in global
as all of the West) has had significantly enhanced fuel wildfire danger from 1979 to 2013. Nat. Commun., 6,
aridity due to anthropogenic increases in temperature 7537, https://doi.org/10.1038/ncomms8537.
and vapor pressure deficit over the past several de- Lareau, N. P., N. J. Nauslar, and J. T. Abatzoglou, 2018:
cades. This can also be seen in the increasing number The Carr fire vortex: A case of pyrotornadogenesis?
of days of fire weather season length based on fire Geophys. Res. Lett., 45, 13 107–13 115, https://doi.
danger indicators (e.g., Jolly et al. 2015). Nighttime org/10.1029/2018GL080667.
temperature trends especially may be playing an im- McEvoy, D. J., J. L. Huntington, M. T. Hobbins, A.
portant role in more extreme fire behavior. Research Wood, C. Morton, M. Anderson, and C. Hain, 2016:
is currently underway to examine the specific rela- The evaporative demand drought index. Part II:
tionship of this warming to nighttime fuel drying and CONUS-wide assessment against common drought
subsequent extreme fire behavior that was observed indicators. J. Hydrometeor., 17, 1763–1779, https://
during the California 2018 fire season. doi.org/10.1175/JHM-D-15-0122.1.
An estimated 54% of California ecosystems are fire —, M. Hobbins, T. J. Brown, K. VanderMolen, T. Wall, J.
dependent and most of the rest are fire adaptive (Pyne L. Huntington, and M. Svoboda, 2019: Establishing
2016). California has always had fire given its climate, relationships between drought indices and wildfire
topography, and distinctive varieties of combustible danger outputs: A test case for the California–Nevada
vegetation. Today it is a state of nearly 40 million drought early warning system. Climate, 7, 52, https://
people, and one in four Californians live in a “high doi.org/10.3390/cli7040052.
risk” wildfire area (https://www.latimes.com/local/ Nauslar, N. J., J. T. Abatzoglou, and P. T. Marsh, 2018: The
lanow/la-me-california-braces-for-new-wildfires- 2017 North Bay and Southern California fires: A case
20190614-story.html; accessed 24 November 2019). study. Fire, 1 (1), 18, https://doi.org/10.3390/fire1010018.
California insured losses in 2018 from wildfire topped Oakley, N. S., F. Cannon, R. Munroe, J. T. Lancaster, D.
$13 billion (https://www.insurancejournal.com/news/ Gomberg, and F. M. Ralph, 2018: Brief communica-
west/2019/05/08/525930.htm; accessed 24 November tion: Meteorological and climatological conditions
2019). The year 2018 now holds the record for the associated with the 9 January 2018 post-fire debris
most destructive wildfire, the largest wildfire, and the flows in Montecito and Carpinteria, California, USA.
costliest wildfire season in California state history. Nat. Hazards Earth Syst. Sci., 18, 3037–3043, https://
doi.org/10.5194/nhess-18-3037-2018.
Pyne, S. J., 2016: California: A Fire Survey. The Univer-
REFERENCES sity of Arizona Press, 203 pp.
Abatzoglou, J. T., and A. P. Williams, 2016: Impact of an- Radeloff, V. C., and Coauthors, 2018: Rapid growth of
thropogenic climate change on wildfire across western the US wildland–urban interface raises wildfire risk.
US forests. Proc. Natl. Acad. Sci. USA, 113, 11 770– Proc. Natl. Acad. Sci. USA, 115, 3314–3319, https://
11 775, https://doi.org/10.1073/pnas.1607171113. doi.org/10.1073/pnas.1718850115.
S4 | JANUARY 2020You can also read