The webinar will begin shortly - Advancing Understanding, and Informing Prevention of Public Mass Shootings: Findings from NIJ Funded Studies
←
→
Page content transcription
If your browser does not render page correctly, please read the page content below
Advancing Understanding, and Informing Prevention of
Public Mass Shootings: Findings from NIJ Funded Studies –
                          Part 1

                     November 17, 2020

            The webinar will begin shortly.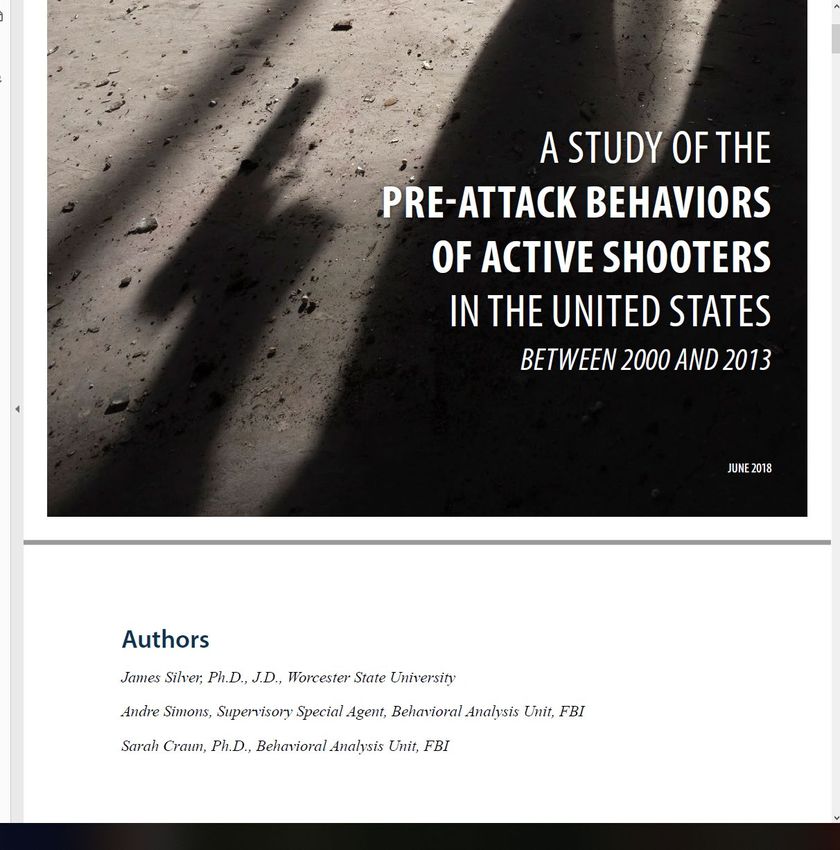
Presentations
Presentation Title                                                         Presenter
Trends and Contagion in Mass Public                                        James Alan Fox, Ph.D., Northeastern
Shootings                                                                  University
Forecasting the Severity of Mass Public                                    Grant Duwe, Ph.D., Minnesota Department
Shootings                                                                  of Corrections
The Effect of State Gun Laws on Mass Public                                Michael Rocque, Ph.D., Bates College
Shootings; and Exploring Averted Incidents

Disclosure: This project is supported by Award No. 2018-75-CX-0025, awarded by the National Institute of Justice, Office of Justice Programs, U.S.
Department of Justice. The opinions, findings, and conclusions or recommendations expressed in these presentations and during this webinar are those
of the authors/presenters and do not necessarily reflect those of the U.S. Department of Justice.
Trends and Contagion in Mass Public Shootings

                  James Alan Fox
              Northeastern University

                    NIJ Webinar
                   November 2020
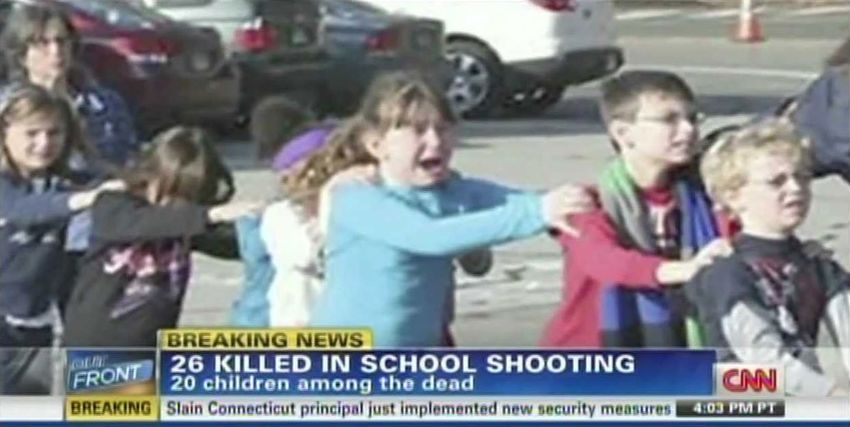
Littler interest until 2012 trio of mass shootings
                   NEW YORK (AP) — The horrific massacre of 26
                   children and staff at a Connecticut elementary school,
                   along with other mass shootings, was the top news
                   story of 2012, narrowly edging out the U.S. election,
                   according to The Associated Press' annual poll of U.S.
                   editors and news directors
Heightened scholarly interest

                   Scholarly publications on mass shooting, 1980-2019
               12,000
                                                                                               10,100
               10,000

                8,000
Publications

                6,000

                4,000                                                                 2,930

                2,000                                                       1,170
                                                       324           623
                          22        48       109
                   0
                        1980-84   1985-89   1990-94   1995-99   2000-04    2005-09   2010-14   2015-19
Source: Google Scholar                                       Years
Then came the data
                                                                                                                      Victims Average
                                                                                             Years         Incident
              Source                      Definition of Mass Shooting Incident                                        Fatally Victims per
                                                                                           Included          Total
                                                                                                                       Shot    Incident
                                 4+ victims killed by gunfire in public within a 24-hour
    Fox/Duwe/Rocque                                                                      1976-2019           164      1,164       7.1
                                 period excluding felony-related incidents
    Peterson/Densley             4+ victims killed by gunfire in public                    1966-2019         172      1,210       7.0

    Turanovic/Pratt              4+ victims killed by gunfire in a 24-hour period          1976-2019         808      4,035       5.0

    AP/USA Today/NUa             4+ victims killed by gunfire                              2006-2019         326      1,783       5.5

                                 4+ victims killed by gunfire in public excluding
    The Washington Post                                                                    1966-2019         174      1,237       7.1
                                 felony-related incidents
    Everytown for Gun Safety     4+ victims killed by gunfire                              2009-2019         236      1,337       5.7

                                 4+ victims (3+ since 2013) killed by gunfire in public
    Mother Jones                                                                           1982-2019         118       948b       8.0
                                 excluding domestic and felony related incidents
    Gun Violence Archive         4+ victims killed or injured by gunfire                   2013-2019        2,345     2,651c      1.1
a
  The AP/USA TODAY/Northeastern University database also track mass killings by means other than gunfire
b
  The fatality counts in the Mother Jones databse frequently (but not always) include offender deaths
c
  The fatality counts in the Gun Violence Archive include offender deaths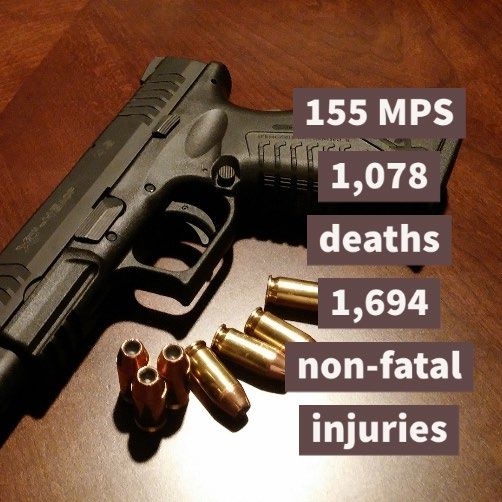
Defining characteristics
• Why mass public shootings with 4+ victim fatalities?
• What kind of event does the public tend to associate with the term
  “mass shootings”?
• What frightens Americans? The more common or the more deadly?
                         What is a mass shooting?
                                             #Incidents Average
Meaning of "mass shooting"          Source    2013-19 #Fatalities
4+ victims shot                      GVA        4345     1.1*
4+ victims fatally shot           AP/USAT/NU     183      5.7
4+ victims fatally shot in public     FDR         40     10.0
*GVA includes assailant deaths in its fatality count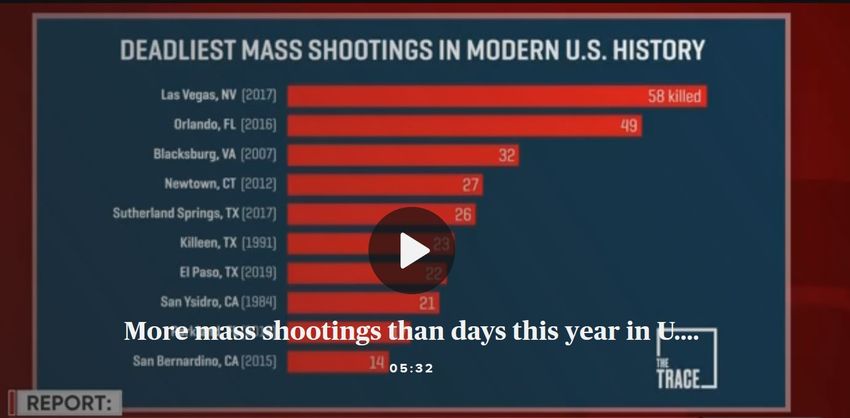
A minority of cases, but the most frightening
• Mass public shootings are more deadly and often indiscriminate
• Can happen at any place, at any time, to anyone
                                            Trends in Mass Shoootings by Type
                                     Source: Associated Press/USA Today/Northeastern Univ. Project
                    20

                    15
                                                                                                       Family (44%)
        Incidents

                    10                                                                                 Felony (18%)

                                                                                                       Public (23%)
                     5
                                                                                                       Other/Unk. (15%)

                     0
                         2006 2007 2008 2009 2010 2011 2012 2013 2014 2015 2016 2017 2018 2019 2020*
                                                            Year
        *2020 projection as of 11/5
Trends in MPS incidence
                    • Modest increase in cases from mid-2000s to mid-2010s
                    • A clear spike in 2018-19

                           Mass public shootings (MPS), 1976-2019                                                             Rate of mass public shootings (MPS), 1976-2019
            12                                                                                                     3.5

                                                                                                                   3.0
            10

                                                                                              Incidents per 100M
                                                                                                                   2.5
             8
                                                                                                                   2.0
Incidents

             6
                                                                                                                   1.5
             4                                                                                                     1.0

             2                                                                                                     0.5

             0                                                                                                     0.0
                 1976 1979 1982 1985 1988 1991 1994 1997 2000 2003 2006 2009 2012 2015 2018                              1976 1979 1982 1985 1988 1991 1994 1997 2000 2003 2006 2009 2012 2015 2018
                                                    Year                                                                                                    Year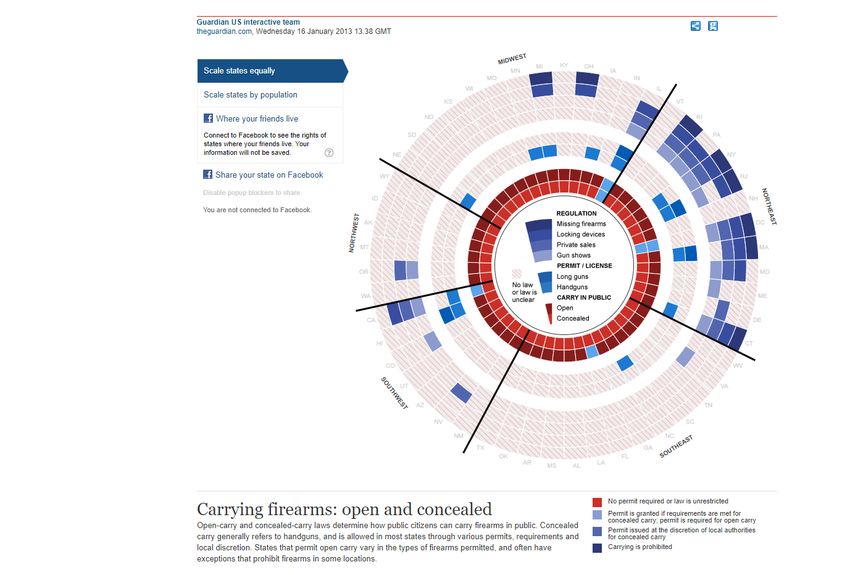
Trends in MPS severity
                • Recent rise in severity (6 ave. victim fatalities pre-2015, 12 since)
                • Notably Las Vegas, Orlando, Sutherland Springs, and El Paso

                            MPS victims fatally shot, 1976-2019                                              Average number of MPS victims fatally shot, 1976-2019
          120                                                                                          18

          100                                                                                          15

           80                                                                                          12

                                                                                             Average
Victims

           60                                                                                           9

           40                                                                                           6

           20                                                                                           3

            0                                                                                           0
                1976 1979 1982 1985 1988 1991 1994 1997 2000 2003 2006 2009 2012 2015 2018                  1976 1979 1982 1985 1988 1991 1994 1997 2000 2003 2006 2009 2012 2015 2018
                                                   Year                                                                                        Year
A mass shooting epidemic? “We Are In The Midst Of An Epidemic Of Mass Shootings” Joe Scarborough, Morning Joe MSNBC, 2/15/2018
An epidemic of fear

       Afraid or very afraid of mass shootings
50%                                                     ABC News/Wash Post Poll (Sept 2019):
                                   41.5%     41.5%
40%                                                     Six in 10 fear a mass shootings in
30%
               29.9%     28.1%                          their community
      16.4%
20%

10%
                                                        Ipsos/USA Today Aug 2019 Poll:
 0%
       2015     2016      2017      2018         2019
                                                        21% skipped public events where
                          Year                          there would be a lot of people.
Source: Chapman University Survey of American Fears
Why the exaggerated sense of risk? • Misinterpreted data sets • Confusion from conflicting definitions • Amount and nature of media coverage
Mass confusion and mass shootings
                                                     GVA 2013-2019
                                               Incidents           2,345
                                               With 4+ killed        187
                                               %4+ killed             8%
                                               Injuries          12,426
                                               Fatalities*         2,651
                                               Ave. fatalities       1.1
                                               *Includes some assailants

                                                GVA Mass Shootings (4+ Shot)
                                 500

                                 400

                     Incidents
                                 300

                                 200

                                 100

                                   0
                                        2013     2014   2015   2016   2017     2018   2019
                                                               Year

                                       No benchmark to assess long-term trend
Seeing is believing
What gets covered the most?
                                                          Factor impacting news coverage
• MPS receive far greater coverage than            #Victims killed                 +   0.005
  family and felony cases (Duwe, 2000)             #Victims injured
                                                   Region
                                                                                   +
                                                                  East             +
• Which MPS are particularly newsworthy?                          Midwest
                                                                  South
                                                                                   +
                                                                                   -
                                                                                       0.074

    • N=97 MPS incidents, 2000-2019                Location
                                                                  West*
                                                                  Government
                                                                                   +
                                                                                   +   0.059

  • Amount of AP State & Local wire coverage                      School
                                                                  Worship
                                                                                   +
                                                                                   +
                                                                                       0.053
                                                                                       0.044
                                                   Off. Age
  • Major factors: higher death toll, younger                     Under 24
                                                                  25-39
                                                                                   +
                                                                                   +
                                                                                       0.036
                                                                                       0.067
    offenders, schools and churches,               Off. Race      If White
                                                   Contributor Terrorism
                                                                                   +
                                                                                   +   0.020
    terrorism, white victims, arrested assailant                  Hate             +
                                                                  Grievance        +
  • Fox, Gerdes, Duwe, & Rocque, “The                             Mental illness   +
                                                   Outcome        If Arrested      +   0.030
    newsworthiness of mass public shootings:       %Victims strangers              +
    What factors impact the extent of              %Victims female
                                                   %Victims < 18 yo
                                                                                   +
                                                                                   +
    coverage.” Homicide Studies, forthcoming.      %Victims white
                                                   Interracial event
                                                                                   +   0.008
                                                                                   +
                                                   N = 97
Contagion of mass shootings
• Is there a price to news coverage?
• “Mass Shootings Can Be Contagious, Research
Shows,” NPR, Aug.2019
• “…mass killings involving firearms are incented
by similar events in the immediate past. On
average, this temporary increase in probability
lasts 13 days, and each incident incites at least
0.30 new incidents…” Towers et al. (2015)
• Analyzed the timing of USA Today mass shooting
data (2006-13), but no measurement of media
• Most mass shootings receive little coverage
“Don’t name them; don’t show them”A study of contagion
• Analysis of contagion should reflect the extent of media coverage
• N=6,940 daily counts of mass shooting stories (2000-2018) in the AP wire, major U.S.
newspapers, and network TV news programs and timing of 89 MPS
• Fox, Sanders, Fridel, Duwe, & Rocque, “The contagion of mass shootings: The
interdependence of large-scale massacres and mass media coverage.” (under review)
250 70
Coverage Victims killed
60
200
50
150 40
Victims
MP Coverage
100 30
20
50
10
0 0
DateMedia coverage pre/post MPS
20.0
17.5
15.0
2 day lag in peak
12.5
13 major daily
MP Mean
newspapers 10.0
weighted by 7.5
circulation
5.0
2.5
0.0
-30 -28 -26 -24 -22 -20 -18 -16 -14 -12 -10 -8 -6 -4 -2 0 2 4 6 8 10 12 14 16 18 20 22 24 26 28 30
Lag/Lead Days3.0
2.5
1 day lag in peak
2.0
Associated Press
AP Mean
1.5
National Wire
1.0
0.5
0.0
-30 -28 -26 -24 -22 -20 -18 -16 -14 -12 -10 -8 -6 -4 -2 0 2 4 6 8 10 12 14 16 18 20 22 24 26 28 30
Lag/Lead Days
5.0
4.5
No lag in peak
4.0
3.5
Network TV 3.0
TV Mean
News 2.5
2.0
1.5
1.0
0.5
0.0
-30 -28 -26 -24 -22 -20 -18 -16 -14 -12 -10 -8 -6 -4 -2 0 2 4 6 8 10 12 14 16 18 20 22 24 26 28 30
Lag/Lead DaysResponsible coverage • The act v. the actor • Report facts, not fluff • Don’t give perpetrator a platform by publishing rants • Focus more on strength and resilience, less on pain and suffering
Rise and fall of social contagion (and public obsession)
 • Eight multiple victim school shooting in 1996-2001
 • “School shootings are an epidemic.” Dan Rather, March 5, 2001
 • Not another for 4 years

Date        Shooter, Age                                  School                  Location           Killed Injured
2/2/1996 Barry Loukaitis, 14                              Frontier Junior H.S. Moses Lake, WA           3       1
2/19/1997 Evan Ramsey, 16                                 Bethel Regional H.S. Bethel, AL               2       2
10/1/1997 Luke Woodham, 16                                Pearl H.S.              Pearl, MS             3       7
12/1/1997 Michael Carneal, 14                             Heath H.S.              West Paducah, KY      3       5
3/24/1998 Mitchell Johnson, 13 & Andrew Golden, 11 Westside M.S.                  Jonesboro, AR         5      10
5/21/1998 Kipland Kinkel, 15                              Thurston H.S.           Springfield, OR       4      25
4/20/1999 Eric Harris, 18 & Dylan Klebold, 17             Columbine H.S.          Littleton, CO       13       23
3/5/2001 Charles "Andy" Williams, 15                      Santana H.S.            Santee, CA            2      23
3/21/2005 Jeffrey Weise, 16                               Red Lake H.S.           Red Lake, MN          9       5
Note: Incidents with 4+ victims and at least two deaths (not including the assailant)
Looking ahead
• The Sept. 11, 2001 attack on America diverted attention away from
  the threat of multiple victim school shootings
• Might the COVID-19 pandemic pause in mass public shootings
  dissipate the social contagion and panic over these incidents?
                                                            The 2020 drop in MPS
                    12

                     9
        Incidents

                     6

                     3

                     0
                         2006   2007   2008   2009   2010    2011   2012   2013   2014   2015   2016   2017   2018   2019   2000
                                                                           Year
       Source: AP/USA Today/Northeastern Univ. Project
Mass public shootings (MPS), 1976-2019
12
10
8
Incidents
6
4
Speaking of trends and what
2
0
might lie ahead, what does
1976 1979 1982 1985 1988 1991 1994 1997 2000 2003 2006 2009 2012 2015 2018
Year
MPS victims fatally shot, 1976-2019
the future hold in terms of
120
100
the severity of MPS?
80
Victims
60
40
20
0
1976 1979 1982 1985 1988 1991 1994 1997 2000 2003 2006 2009 2012 2015 2018
YearForecasting the Severity of Mass
Public Shootings in the United States
‖ Grant Duwe, Ph.D.
‖ November 2020
‖ NIJ WebinarStudy Overview
• The incidence and severity of mass public shootings have increased since the
mid-2000s
• 2017 Las Vegas: 60 people killed and another 411 victims wounded by gunfire
• 2016 Orlando: 49 people killed and another 53 victims injured by gunfire
• What is the likelihood of attacks as catastrophic as Orlando or Las Vegas
occurring in the next 10 years? Or 20 years?
• What is the probability of an even worse mass public shooting taking place in the
future?
• Presentation provides results from our study (under review)
• “Forecasting the Severity of Mass Public Shootings in the United States” by Grant
Duwe, Nathan Sanders, Michael Rocque and James Alan FoxForecasting the Likelihood of Catastrophic Events
• Research in other fields has shown it’s possible to develop valid estimates of
future likelihood of rare catastrophic events
• Seismology Earthquake > 7.0 on Richter scale
• Terrorism Attack similar in magnitude to 9/11
• Heavy-tailed distributions
• Most events are relatively small (low severity) while a small number are very severe
• Mass Public Shootings
• Tend to follow a heavy-tailed distribution
• Relatively few have had more than 10 fatal victims or more than 25 total victims who were shotWhy It Matters
• Estimates can help inform decisions about resources
• If the likelihood is very low, then it may be more prudent to divert resources
elsewhere
• But what if the likelihood is greater than 10% (or higher) over the next 5 or 10
years?
• Such an estimate might be relevant for:
• Modeling trauma capacity of regional hospital systems
• Understanding potential consequences of policies relating to firearms or mental health
• Law enforcement assessing risk around large public gatheringsDefining Mass Public Shootings
• Mass murder = incidents in which 4 or more victims are killed within
24-hour period
• “Mass shooting” = any gun-related mass murder
• “Mass public shooting” = incidents in which 4 or more victims are killed
with a gun in a public location
• Exclude cases in connection w/ other criminal activity
• MPS = most newsworthy mass murders/mass shootings
• Infamous Examples of MPS
• Columbine school shooting: 1999
• Virginia Tech school shooting: 2007
• Las Vegas massacre: 2017
• Make up about 12% of all mass murdersMeasuring Mass Public Shootings
•Triangulated data collection strategy
• FBI’s Supplementary Homicide Reports (SHR)
• Identify when and where mass murders have occurred since 1976
• No information on number of wounded victims or type of location
• News reports
• More detailed info but relying only on news coverage underreporting
• See Mother Jones or Gun Violence Archive
• Use both Strategy also adopted by Congressional Research Service and USA
Today
• Consulted both published and unpublished lists
• Consensus review by FDR (Fox, Duwe and Rocque)
• Sample = 156 mass public shootings from 1976-2018
• 2,360 total victims shot, of whom 1,092 were killedMass Public Shooting Rate, 1976-2018
3.50
3.00
Mass Public Shooting Rate Per 100 Million
2.50
2.00
1.50
1.00
0.50
0.00
1976 1981 1986 1991 1996 2001 2006 2011 2016
YEAR
MPS Rate 5 per. Mov. Avg. (MPS Rate)Severity of Mass Public Shootings, 1976-2018
35.00
30.00
MPS Fatality Rate Per 100 Million
25.00
20.00
15.00
10.00
5.00
0.00
1976 1981 1986 1991 1996 2001 2006 2011 2016
YEAR
MPS Fatality Rate 5 per. Mov. Avg. (MPS Fatality Rate)Severity of Mass Public Shootings, 1976-2018
50.00
45.00
40.00
MPS Total Shot Rate Per 100 Million
35.00
30.00
25.00
20.00
15.00
10.00
5.00
0.00
1976 1981 1986 1991 1996 2001 2006 2011 2016
YEAR
MPS Total Rate 5 per. Mov. Avg. (MPS Total Rate)Forecast Assumptions
• Forecasts influenced by assumptions about future prevalence of mass public
shootings
• Following Clauset and Woodard (2013), 3 sets of assumptions about future
incidence of MPS
• Grounded in historical data from 1976-2018
• Pessimistic: highest prevalence of MPS
• Status Quo: average prevalence of MPS
• Optimistic: lowest prevalence of MPS
• Relied on U.S. Census Bureau projections of U.S. population from 2019-2039
• Calculated anticipated future number of MPS for each year based on size of
U.S. population and MPS rates for each scenarioForecast Parameters
• Generated 108 independent forecasts
• 3 scenarios (pessimistic, status quo and optimistic)
• 3 distributions (Pareto, Weibull and lognormal)
• 3 forecast horizons
• 5 years
• 10 years
• 20 years
• 2 minimum severity cutoffs: 4 victims and 10 victims
• 2 severity outcomes
• Number of victims killed
• 49 (Orlando)
• 60 (Las Vegas)
• 75
• 100
• Number of victims shot (killed and wounded)
• 100
• 250
• 500
• 1,000Results for Number of Victims Killed by Gunfire • Estimates varied across forecast parameters but… • …even under optimistic conditions over next 10 years: • At least 38% for attack as lethal as Orlando • At least 26% for attack as lethal as Las Vegas • At least 16% for MPS with at least 75 fatal victims • At least 9% for MPS with at least 100 fatal victims • …and under pessimistic conditions over next 10 years: • At least 51% for attack as lethal as Orlando • At least 37% for attack as lethal as Las Vegas • At least 24% for MPS with at least 75 fatal victims • At least 13% for MPS with at least 100 fatal victims
Fatal Victim Results for Lognormal Model
Results for Total Number of Victims Shot
•     Under optimistic conditions over next 10 years:
    •   At least 41% for MPS with at least 100 victims shot
    •   At least 5% for MPS with at least 250 victims shot
    •   At least 0.6% for MPS with at least 500 victims shot
    •   At least 0.05% for MPS with at least 1,000 victims shot

•     Under pessimistic conditions over next 10 years:
    •   At least 56% for MPS with at least 100 victims shot
    •   At least 8% for MPS with at least 250 victims shot
    •   At least 1% for MPS with at least 500 victims shot
    •   At least 0.08% for MPS with at least 1,000 victims shot
Summary of Results
• Regardless of forecast parameters used, odds are very low we’ll see MPS with as
many total gunfire victims as Las Vegas (500+) in near future.
• Odds are higher when focusing on fatalities
• Even under optimistic conditions, at least:
• 26% for a MPS with 60 victims killed
• 9% for a MPS with 100 victims killed
• Likelihood of a MPS as bad as Las Vegas or worse is not trivial
• Resource allocation decisions
• Law enforcement
• Medial professionals
• PolicymakersFinal Thoughts
• Main Limitations
• Study cannot tell us where or exactly when a severe MPS may transpire
• Variability across parameters
• Estimates strongly depend on assumptions made about type of
distribution and tail location
• Drew upon strategy used in other disciplines that’s novel for criminology
• Provides sound methodology to predict probability of mass casualty
events
• May be applied to other types of violence (often heavy-tailed
distribution)
• Example: serial murderThe Effect of State Gun Laws on Mass
Public Shootings; and
Exploring Averted Incidents
Michael Rocque, PhD
Bates College
1
Findings from NIJ funded studies to advance understanding and inform prevention of public November 18, 2020
mass shootings, Part 1.Gun laws vary by state Public/Policy interest
• Fear
• Media attention
https://www.theguardian.com/world/interactive/2013/jan/15/gun-laws-united-states
State gun laws & MPS 2
November 18, 2020• Theory-gun availability (Cook, 1983)
• Mechanisms
• Direct, routine activities Motivated Gun MPS
offender availability
• Indirect, motivation Gun Motivation MPS
availability
Background 3
November 18, 2020• Three studies find support for stricter gun laws
• Gius (2015)
• AWB lower severity
• Klarevas et al. (2019)
• LCM bans lower severity
• Webster et al. (2020)
• LCM bans lower incidence
• Limitations
• Unclear definitions of state laws
• Mass shooting data
Previous work 4
November 18, 2020• Data from 1976 to 2018 on 89 state gun laws and MPS by state
State Laws:
1) AWB
2) LCM bans
3) Permits
4) Extreme-risk protection orders
5) Universal background checks
6) May-issue concealed-carry laws
7) Relinquishment of guns for those prohibited
8) Violent misdemeanor prohibitions
• MPS dataset: triangulated approach
• SHR, existing databases, news stories
Current study
Siegel, M., Goder-Reiser, M., Duwe, G., Rocque, M., Fox, J. A., & Fridel, E. E. (2020). The relation between state gun laws and the incidence and severity of
mass public shootings in the United States, 1976–2018. Law and Human Behavior, 44(5), 347.
5
November 18, 2020Models:
1) Logistic regression for incidence
2) Zero-inflated negative binomial for incidence and number of fatalities/victims
Controls:
a) State pop
b) Pop density
c) Black (proportion)
d) Male 15-29 (proportion)
e) Poverty rate
Red=in count models f) Unemployment rate
g) Alcohol consumption
h) Divorce rate
i) Firearm homicide rate
j) Suicide rate
k) Incarceration rate
l) Household gun ownership
Current study m) Violent crime rate 6
November 18, 2020Total numbers
Varying incidence
Created with Adobe Spark
Results 7
November 18, 2020Statistically sig p
AVERTED MASS PUBLIC SHOOTINGS
(with Madison Gerdes and Maddy Clark)

• Research on MPS
  • Individual, contextual, historical factors
  • Leakage, threats (Duwe, 2017; Lankford et al., 2019; Silver et al., 2018 (FBI))
• But what about planned events that were stopped?
  • Do they look like completed cases?
  • Can we learn points of intervention to help prevent future events?

Studying averted MPS                                                                     9
                                                                           November 18, 2020
• Pre-attack behaviors:
• 77% >week
• 4-5 concerning behaviors
• Averted MPS
• Warning signs common
• Younger, white, more partners,
Existing research less target specific
10
November 18, 2020• Different completed data
• Different credibility assessment
• Different data sources
Our project 11
November 18, 2020• “Any plot, plan, or threat to shoot four or more individuals in a
public location within a 24-hour period, absent of other criminal
activity (e.g., robberies, drug deals, gang conflict, etc.), in which no
injuries (other than to the perpetrator) occurred.”
• Must be credible (specific plan or threat with access to weapon)
• Plan must be detailed (e.g., maps, targets) or weapons must be
accessible. Silva required gun or plan to acquire gun.
Definition 12
November 18, 2020A multi-pronged approach
Existing databases: Potential cases identified:
• Madfis, n=237 • Each case reviewed (2 researchers)
• Agnich, n=32 • Disagreements resolved
• Sarteschi, n=38 credible, 22
non
• Averted School Violence
• K-12 School Shooting
Database
• Online lists (e.g., ABC)
• Lexis Uni searches
Methods 13
November 18, 2020• Codebook • Variable information
developed and gathered via open sources
data collection (news stories, online
starting in corrections databases)
summer 2019
• Three coders, with discussion
to resolve questions
Methods 14
November 18, 2020• Reliability Assessment (Summer, 2020)
• First a trial, then 10 case reliability assessment
• Coding focused on “subjective” fields (mental illness, plan/threat
length, response, motivation, and credibility)
• Percent agreement: 47-93%
• Gwet’s AC: MI=.73; Threat=.40; Plan=.86, Credibility=.92
• Response and Motivation=text but good agreement, 100% for
response and 93% for motivation
Methods 15
November 18, 2020• Lots of missing data, information hidden
• When to move on
• Coding
• Length variables problematic, initially in days, recoded to categories
• Focused on credibility for agreement
• At least two coders reviewed every case
• WhatsApp to the rescue!
Challenges 16
November 18, 2020• As of November, 2020: 210 cases
• Date range: 1999-2019
• Offender/incident structured
• Mostly quantitative, some text (motivation/response, location)
• Database is in progress
Database 17
November 18, 2020MI=mental illness; any discussion or diagnosis of mental illness for any suspect involved in a case
Comparison 18
November 18, 2020• Permit/LCM bans related to incidence and severity of MPS across
states
• Mechanism unclear
• Averted MPS project continuing
• Some similarities and differences
• Future work will explore the plans in detail to help guide
intervention efforts
Conclusion 19
November 18, 2020Thank you
Questions and Answers
Please submit questions to “all panelists” in the Q&A box.
Indicate which presenter the question is for.You can also read