Climate action: The ripple became a swell and real progress is underway
←
→
Page content transcription
If your browser does not render page correctly, please read the page content below
Climate action: The ripple became a
swell and real progress is underway
Over the past few decades, climate change has moved from the fringe to the main stage, a process which
was accelerated by the 2015 United Nations Climate Change Conference (COP 21) and the resulting Paris
Agreement in 2015. Today, nobody can ignore the reality of climate change or the powerful momentum to
effect change from all corners of society: governments, central banks, companies, academics, innovators
and citizens are collectively focused on solving this existential issue. What started as a ripple, driven
primarily by environmentalists and idealists, has become a tsunami of actions by all stakeholders. Hence,
we think it is worth taking stock of where we are and what actions are being taken, with the caveat that we
cannot capture all the initiatives and policies across geographies and industries.
Where we are
The Paris Agreement, adopted in December 2015 by 189 state parties further to COP 21, sets a goal of limiting
global warming, the increase in average global temperatures compared to pre-industrial levels (1850-1900), to
“well below 2°C” in the second half of this century. The parties to the Paris Agreement will also pursue efforts to
limit the increase to 1.5°C.
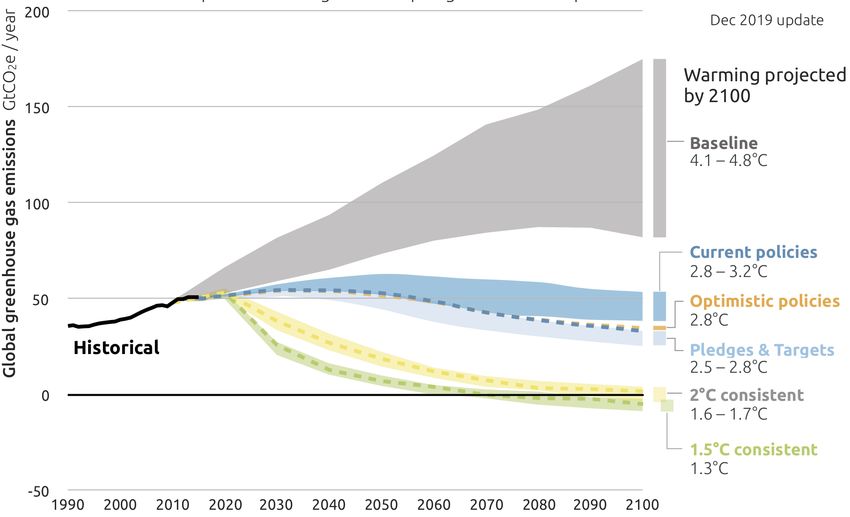
To achieve either of these goals – limiting warming to 1.5 or 2 degrees Celsius by 2100 – emissions must be
reduced very significantly from here on. In 2018, according to the Intergovernmental Panel on Climate Change
(IPCC), global warming already reached approximately 1°C above pre-industrial levels. The world is therefore on a
path to much higher temperatures, and hence drastic actions are necessary.
2100 Warming projections
Emissions and expected warming based on pledges and current policies
Source: Climate Action Tracker, December 2019.
© 2020 Ecofin www.ecofininvest.com
Page 1Global timeline to reach net-zero emissions
Net zero Net zero
Limiting global CO2 GHG
warming to 1.5oC entails
2020 2030 2040 2060 2070 2080 2090
Limiting global
warming to 2.0oC entails
Net zero
Net zero
CO2
GHG
Source: IPCC Special Report on Global Warming of 1.5oC
Main sources of emissions
In order to achieve tangible results soon, it is important to focus on the main sources of emissions:
1. By energy fuel source, coal and oil are responsible for 44% and 35%, respectively, of global CO2 emissions, for
a total of 79%, and have the highest intensity of emissions per unit of heat or electricity generated. As such,
they should feature front and centre in the global effort to reduce emissions.
2. By sector, electricity & heat, transportation and industry represent 41%, 24% and 19%, respectively, of global
CO2 emissions, for a total of 84%. Clean power, clean mobility and clean manufacturing are therefore critical to
meaningful emissions reductions.
3. By geography, China, the U.S. and Europe combined are responsible for over 50% of global emissions,
therefore if those countries don’t address the issue head-on, no significant progress will be made at the global
level.
4. In summary, more than 50% of the CO2 emissions in China, India and South Korea come from coal while over
40% of the CO2 emissions in Saudi Arabia, the U.S., the E.U. and Canada come from oil. Among the top 10
CO2 emitting countries, only the U.S. and E.U. countries show substantial declines in emissions. Considerable
acceleration of reductions will therefore be needed by all participants in the next 10 years.
CO2 emissions by energy source CO2 emissions by energy sector
1%
1% 3% 1%
5%
20% 6%
44% 19% 41%
35%
24%
Coal Oil Gas Other Electricity & heat Transportation Industry Residential
Other energy industries Commercial & public services
Source:: IEA, 2017 Agriculture & fishing Other
© 2020 Ecofin www.ecofininvest.com
Page 2CO2 emissions (kg/MW) Pounds of CO2 emitted per mBtu
450 250
400 200
350 150
300
100
250
50
200
0
150
(bituminous)
(anthracite)
(subbituminous)
Natural gas
(without ethanol)
Coal (lignite)
Propane
and heating oil
Diesel fuel
100
Coal
Coal
Gasoline
Coal
50
0
Hard Coal Oil LPG Natural Gas
CO2 emissions by country CO2 emissions by source
2%
2% 100%
2%
90%
3% 80%
5% 70%
7% 28% 60%
50%
10% 40%
30%
20%
14% 26%
10%
0%
China US EU India Russia Japan South Iran Canada Saudi
China Other U.S. E.U India Russia Japan Korea Arabia
South Korea Iran Canada Saudi Arabia Coal Oil Gas Other
Source: IEA, 2017
Key actions required to reduce CO2 emissions
There are many opportunities to tackle CO2 emissions. Some solutions are readily available today while others are
a challenge as they require innovation, large investments or a change in behaviour.
Looking at the charts above, the world needs to address issues collectively and individually and, at the risk of
stating the obvious, solutions are global but implementation is local. Hence, the following solutions should be put
into effect with a sense of urgency as they would have the greatest impact using currently available technologies,
creating no/little financial burden and requiring only manageable adjustments:
• Shut down all coal power plants and replace with renewables. As we have described in previous papers,
renewables are now cheaper to build and operate than the operating costs of coal plants in most countries
around the world. At a minimum, in places where renewables resources are not adequate, switching from
coal to natural gas in the interim would accomplish a major reduction in emissions. Given the current cost of
renewables and storage and their declining cost curves, we fully expect to see an acceleration in migration
away from fossil fuels in the world’s electricity system over the next decade.
© 2020 Ecofin www.ecofininvest.com
Page 3• Replace Internal Combustion Engine cars (ICEs) with electric vehicles (EVs). As battery costs have fallen
dramatically, driving range has increased to acceptable levels and EV manufacturing capacity is ramping up. We
see no reason why all ICEs could not be replaced by EVs in the next 10-20 years. Why 10-20 years? Today the
average age of cars on the road is 11.8 years in the U.S., 10.8 years in the E.U., 8.6 years in Japan and 5 years in
China. Hence, if the political, industrial and societal will is summoned, we could aim to replace all ICEs over the
next one or two car replacement cycles. Numerous states and cities around the world have already announced
bans on diesel and petrol cars and busses by 2025 or 2030 and have been introducing a mix of restrictions and
incentives around ICEs/EVs. For instance, in 2019 and 2020:
- California introduced the Advanced Clean Truck regulation requiring manufacturers of commercial vehicles to
start selling electric trucks in 2024 and to sell only electric trucks by 2045. The California Air Resources Board
(CARB) claims this is the first rule of its kind in the world – and trucks represent fully 70% of vehicular air
pollution.
- London introduced an Ultra Low Emission Zone (ULEZ) charge of £12.50 per day on vehicles which fail to meet
more stringent emissions standards; this is applied on top of a Congestion Zone charge of £11.50 per day
(introduced in 2003).
- India has ordered Uber and Ola to electrify 40% of their fleets by 2026. Uber and Ola must convert 2.5% of
their fleets of cars by 2021, 5% by 2022 and 10% by 2023.
- Seoul has barred high-emission/diesel vehicles from entering the city-centre.
Other routes to lower emissions, such as green hydrogen, clean fuel for ships and planes and even reduced meat
consumption are more complex and will require more time and money. These also apply to processes and habits
that are less significant in terms of emissions than the processes for which we have suitable and available options
today.
What are countries doing
Further to COP 21, most countries have translated their commitments to the Paris Agreement into laws, policy
documents and national targets, and these are evolving and being updated constantly. For instance, at the
Climate Action Summit in September 2019, 77 countries, ten regions and more than 100 cities committed to net-
zero carbon emissions by 2050. By June 2020, more than 20 countries and regions had progressed from simple
commitment to full adoption of net-zero targets: Austria, Bhutan, Chile, Costa Rica, Denmark, the E.U., Fiji,
Finland, France, Germany, Hungary, Iceland, Ireland, Japan, the Marshall Islands, New Zealand, Norway, Portugal,
Singapore, Slovenia, Spain, Sweden, Switzerland, Suriname and the United Kingdom. Moreover, as of June 2020,
120 countries are committed to working on net-zero targets through the Climate Ambition Alliance.
Given their weight in global emissions, we provide below an update on China, the U.S. and the E.U.
China
• As of December 2019, China claimed to have met its carbon intensity target further to the Copenhagen Accord
which was signed by participants of COP 15 in 2009. At that time, China aimed to lower its carbon intensity by
40-45% by 2020 (from 2005 levels). The country’s new climate goal, further to the Paris Agreement, is to lower
carbon intensity by 60-65% and to have its total emissions peak by 2030. It is likely this ‘peak emissions’ target
is no longer acceptable to the international community and will be constrained via carbon-footprint trade tariffs
or net zero supply chain requirements by vendors and retailers purchasing Chinese finished goods.
© 2020 Ecofin www.ecofininvest.com
Page 4• There are high expectations that China’s Emission Trading Scheme (ETS) will be up and running by the end of
2020.
• The 14th Five Year Plan (2021-2025) is expected to set a more ambitious goal to increase energy produced from
non-fossil fuel sources to at least 20% by 2030 (from 15% in 2020, as per the 13th Five Year Plan).
• Autos: In October 2019, China announced its draft EV development plan for 2021-35; the targets for EV sales as
a % of total auto sales are 20% by 2025 and 40% by 2030, compared to 4.7% in 2019.
The U.S.
After the current Administration withdrew from the Paris Agreement, federal and state targets and policies have
had conflicting objectives.
• As of June 2020, 23 states and the District of Columbia have implemented state-wide greenhouse gas (GHG)
reduction targets (see full table in the appendix).
• California has long been acting to curb GHG emissions through the state’s Global Warming Solutions Act of
2006, legislation AB 32, which mandates a reduction in California’s man-made GHG emissions (1.4% of global
emissions in 2004) to 1990 emission levels by 2020. Subsequent bills aim for GHG emissions to be 40% below
1990 levels by 2030 and 80% below 1990 levels by 2050. California has also introduced a new building code
(effective January 2020) that requires new single-family and multi-family homes up to three stories high to have
a solar photovoltaic system.
• Politics aside, it is worth noting the proposals of U.S. Democratic Presidential candidate Joe Biden:
- Eliminate carbon pollution from power plants by 2035.
- Install 500 million solar panels, including eight million solar roof and community solar energy systems, and
60,000 onshore and offshore wind turbines that are manufactured in America
- Net-zero emissions for all new buildings by 2030, on the pathway to a 100% clean building sector
- Retrofit four million buildings, prioritizing hospitals, schools, and municipal buildings
- Retrofit two million households making energy saving upgrades
- Advance appliance and equipment efficiency standards
- Transition the entire fleet of 500,000 school buses to American-made, zero-emission alternatives within five
years
- Transition 3 million vehicles in the federal, state, and local fleets to zero-emission vehicles
- Install at least 500,000 public charging stations
- Re-join the Paris Climate Agreement and announce a more ambitious Nationally Determined Contribution
(climate pledge to reducing emissions) by 2030
• Autos: In 2018, the Environmental Protection Agency cancelled the planned 2022-25 fuel economy standards
for passenger cars and light trucks. California set its own targets for a 3.7% annual reduction in emissions
through 2026. In July 2020, 15 states and the District of Columbia announced a joint memorandum of
understanding to ensure that 100 percent of all new medium- and heavy-duty vehicle sales be zero-emission
vehicles by 2050 with an interim target for 30 percent zero-emission vehicle sales by 2030.
© 2020 Ecofin www.ecofininvest.com
Page 5The E.U.
• The E.U. formally ratified the Paris Agreement on 5 October 2016, thus enabling its entry into force on 4
November 2016.
• The E.U. 2020 climate & energy package (enacted in 2009) was a set of binding legislation to ensure the E.U.
meets its climate and energy targets for the year 2020. The package set three key targets:
- 20% cut in greenhouse gas emissions (from 1990 levels)
- 20% of E.U. energy from renewables
- 20% improvement in energy efficiency
• The E.U. then introduced the 2030 climate and energy framework which includes E.U.-wide targets and policy
objectives for the period from 2021 to 2030. Key targets for 2030 are:
- At least 40% cut in greenhouse gas emissions (from 1990 levels)
- At least 32% of E.U. energy from renewables
- At least 32.5% improvement in energy efficiency
• The European Green Deal aims for the E.U. to be climate-neutral by 2050.
• Finally, in June 2020, the European Parliament has adopted the Taxonomy Regulation, a classification system
for sustainable economic activities. This will allow investors to identify and direct investments into sustainable
activities.
• Autos: In 2020/21, a new carbon limit of 95g/km has been introduced across the region with penalties for any
manufacturer failing to meet the regulation.
What companies are doing
A great deal. Irrespective of the actions of governments, many companies are developing and implementing
strategic and operational shifts – some directional, some seismic – to make their businesses more sustainable,
less carbon-intensive and more energy efficient. Below are examples of the growing momentum in commitments
by companies around the world:
MSCI ACWI universe as of 12/31/2019
60% 55%
54%
Perceent of issuers
50%
41% 42% 42% 42% 41%
40% 38% 37%
35%
32%
30%
30%
20%
10%
0%
Industrials
Information
Utilities
discretionary
Financials
Health care
Materials
Communication
Consumer
Energy
Real estate
MSCI ACWI
technology
Consumer
staples
services
Confirmed emissions reduction target
Sources: ISS-ESG, MSCI Index, Morgan Stanley analysis
© 2020 Ecofin www.ecofininvest.com
Page 6• As of July 2020, 14,832 entities (including 11,311 companies) in over 160 countries are participants in the
United Nations Global Compact (UNGC), the largest corporate sustainability initiative thus far, which encourages
businesses to adopt socially responsible and climate friendly principles; these companies include Marvell, Citrix,
Whirlpool, Cushman & Wakefield, Mastercard, Terna, Enel, Elia and many more.
• As of July 2020, according to the Science Based Targets initiative, a collaboration between CDP, the UNGC,
the World Resources Institute (WRI) and the World Wide Fund for Nature (WWF), 930 companies are taking
science-based climate action – by committing publicly to GHG emissions reduction targets – and 411 companies
have approved science-based climate action targets (including Coca Cola, P&G, Republic Services, Orsted,
Iberdrola, SSE).
• As of 18 June 2020, 249 companies have signed the Business Ambition for 1.5 °C commitment (UNGC)
(including Pepsico, Ecolab, Moody’s, EDP, REN).
• 155 companies with a combined market capitalization of over U.S.$ 2.4 trillion have signed a statement urging
governments around the world to align their COVID-19 economic aid and recovery efforts with the latest
climate science. The signatories span 34 sectors and have headquarters in 33 countries (including Adobe, HP,
Salesforce.com, EDF, Nestle, AstraZeneca).
• Companies are also increasingly integrating carbon reduction targets into executive compensation
arrangements with CDP reporting that 47% of companies, together accounting for three quarters of Europe’s
market capitalisation, reward their senior management for managing climate topics and 25% of them tie
incentives to climate targets.
Conclusion
It is hard to avoid the conclusion that mitigation of the damaging consequences of global warming is now, finally,
the top priority for policy makers, companies and most stakeholders. A myriad of initiatives is pulling in the same
direction to drive greenhouse gas emissions lower, adopt cleaner and renewable energy sources, and promote
more efficient use of those resources. Companies at the sharp end of innovation and strategies that will enable
sustainability goals to be accomplished are growing and we expect their shares to be rewarding for investors.
© 2020 Ecofin www.ecofininvest.com
Page 7Appendix
Climate goals by state
State Type Description
Alaska House bill 50% of electrical generation from renewables by 2025
Arizona Standard 15% by 2025
California Standard 44% by 2024; 52% by 2027; 60% by 2030; Also requires 100% clean energy by 2045
Colorado Standard 30% by 2020 (IOUs); 100% clean energy by 2050 for utilities serving 500,000 or more customers
Connecticut Standard 44% by 2030
Delaware Standard 25% by 2025-2026
Hawaii Standard 30% by 2020; 40% by 2030; 70% by 2040; 100% by 2045
Illinois Standard 25% by 2025-2026
Indiana Goal 10% by 2025
Iowa Law 105 MW of generating capacity for IOUs
Kansas Goal 20% by 2020
Maine Standard 80% by 2030; 100% target by 2050
Maryland Standard 30.5% in 2020; 50% in 2030
Massachusetts Standard 35% by 2030 and additional 1% each year after
Michigan Standard 15% by 2021; goal of 35% by 2025
Minnesota Standard 26.5% by 2025
Missouri Standard 15% by 2021
Nevada Standard 50% by 2030; non-binding 100% carbon-free by 2050
New Hampshire Standard 25.5% by 2025
New Jersey Standard 50% by 2030
New Mexico Standard 40% by 2025; 80% by 2040; 100% of electricity supplied by zero-carbon resources by 2045
New York Standard 70% renewables by 2030; 100% zero-emissions electricity requirement by 2040
North Carolina Standard 12.5% by 2021
Ohio Standard 8.5% by 2026
Oregon Standard Utilities with >=3% of states load; 25% by 2025; 50% by 2040
Pennsylvania Standard 8% by 2020-2021
Rhode Island Standard 14.5% by 2019, with 1.5% increases/year until 38.5% by 2035
South Carolina Standard 2% by 2021
Texas Goal 10,000 MW by 2035 goal
Utah Goal 20% by 2025
Vermont Standard 75% by 2032
Virginia Standard 100% renewables by 2045 for Phase II utilities and 2050 for Phase I utilities
Washington Standard 15% by 2020; 100% GHG neutral by 2030; 100% renewable or zero-emitting by 2045
Washington D.C. Standard 20% by 2020; 100% by 2032
Source: RBC
This commentary contains certain statements that may include “forward-looking statements.” All statements, other than statements of historical fact, included
herein are “forward-looking statements.” Although Ecofin Advisors Limited (“Ecofin”) believes that the expectations reflected in these forward-looking
statements are reasonable, they do involve assumptions, risks and uncertainties, and these expectations may prove to be incorrect; actual events could differ
materially from those anticipated in these forward-looking statements as a result of a variety of factors. You should not place undue reliance on these forward
looking statements, which speak only as of the date of this publication. Ecofin does not assume a duty to update these forward-looking statements. The views
and opinions in this commentary are as of the date of publication and are subject to change. This material should not be relied upon as investment or tax advice
and is not intended to predict or depict performance of any investment or any fund managed by Ecofin. This publication is provided for information only and
shall not constitute an offer to sell or a solicitation of an offer to buy any securities.
© 2020 Ecofin www.ecofininvest.com
Page 8You can also read