Assessment of Ambient Air Quality of Lucknow City - Pre-Monsoon 2021
←
→
Page content transcription
If your browser does not render page correctly, please read the page content below
Digital India
                          Power To Empower
               Campaign

  Assessment of Ambient
Air Quality of Lucknow City

    Pre-Monsoon 2021
Assessment of Ambient
Air Quality of Lucknow City

      Pre-Monsoon 2021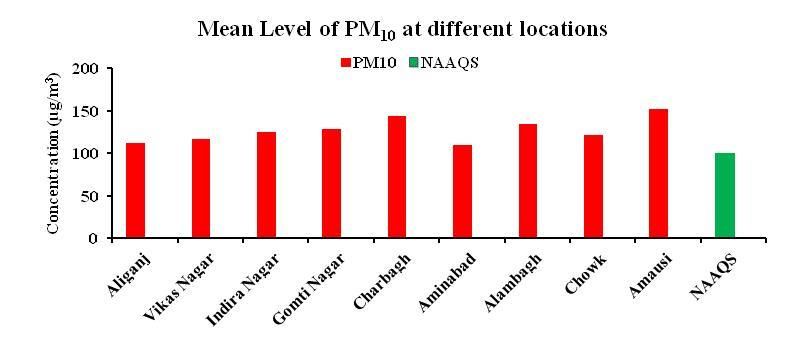
PERSONNEL

           Team Leader           :    Dr G.C. Kisku

           Co-Team Leaders       :    Er A.H. Khan
                                      Dr B. Sreekanth
           Team Member           :    Dr D. K Patel

           Area Co-ordinator     :    Dr N. Manickam
           (Envt. Toxicology Group)

           Technical Staff       :    Mr Pradeep Shukla
                                      Mr Sushil Saroj

           Project Fellows       :    Ms Priya Saxena
                                      Mr Ankit Gupta
                                      Mr Ankit Kumar
                                      Mr Nirmesh Srivastava
                                      Mr Hamid Kamal
                                      Mr Abdul Atiq Siddiqui
                                      Mr Ravi Singh

Pre-Monsoon 2021                                               Page i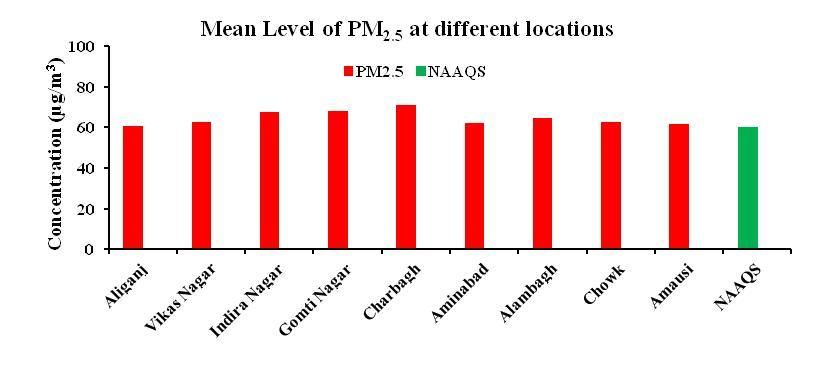
CONTENTS
                                                                            Page No

Salient Features of the Study at a Glance                                         1
1.0     SUMMARY                                                                   2
1.1     INTRODUCTION                                                              3
1.2     MONITORING LOCATIONS AND METHODOLOGY                                     10
1.3     RESULTS                                                                  12
        1.3.1      Respirable Suspended Particulate Matter (RSPM or PM10)        12
        1.3.2      Fine Particulate Matter (PM2.5)                               12
        1.3.3      Sulphur dioxide (SO2)                                         13
        1.3.4      Nitrogen dioxide (NO2)                                        13
        1.3.5      Noise Level                                                   17
1.4     TRENDS OF AMBIENT AIR QUALITY IN LUCKNOW CITY                            18
        1.4.1      Respirable Suspended Particulate Matter (RSPM or PM10)        18
        1.4.2      Fine Particulate Matter (PM2.5)                               18
        1.4.3      Sulphur dioxide (SO2)                                         19
        1.4.4      Nitrogen dioxide (NO2)                                        19
        1.4.5      Noise Level                                                   24
1.5     CONCLUSIONS                                                              27
1.6     RECOMMENDATIONS FOR MITIGATION OF AIR POLLUTION                          28
        ACKNOWLEDGEMENTS                                                         29

Pre-Monsoon 2021                                                             Page ii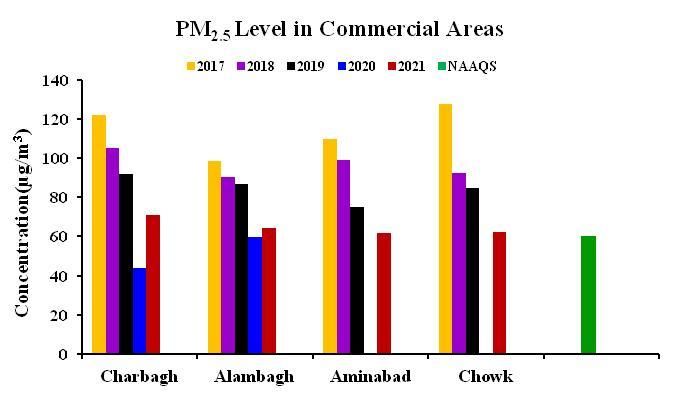
Salient Features of the Study Glance
Geographical Position : 26o 52' N Latitude
80o 56' E Longitude
128 m above Sea Level
Area : 310 sq. km.
Population : 2815033 as per 2011 Census
Projected Population : 65 lakhs as per Master Plan 2031
General Climate of Lucknow City : Subtropical climate, cool dry winter
(Dec-Feb) & summer (Mar-Jun).
Temperature about 45°C in summer to
3°C in winter. Average annual rainfall
about 100 cm.
Total Vehicular number
Of Lucknow city as on 31/03/2021 : 2514461
Growth of Vehicles over 2019-2020 : 4.5%
Total No. of Fuel Filling Stations : 149
(Petrol/Diesel/CNG)
Consumption of Petrol : 191149 kL
Consumption of Diesel : 176660 kL
Consumption of CNG : 26860650 kg
Major Sources of Pollution : Automobiles, D.G. Sets,
biomass burning,
Construction activities, dry
Sweeping of roads
Parameters Monitored : PM10, PM2.5, SO2, NO2
And Noise Levels
Study Conducted by : Environmental Monitoring Division
CSIR-IITR, Lucknow
Pre-Monsoon 2021 Page 1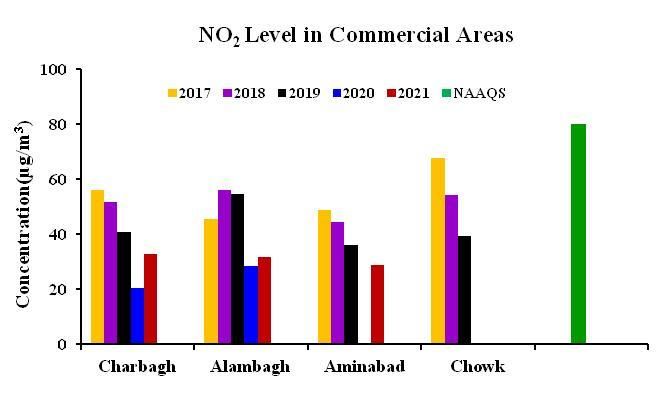
ASSESSMENT OF AMBIENT AIR QUALITY OF LUCKNOW CITY DURING
                                     PRE-MONSOON, 2021
1.0   SUMMARY

      The Pre-Monsoon ambient air quality assessment of Lucknow city was carried out by
      the Environmental Monitoring Division of CSIR Indian Institute of Toxicology
      Research, Lucknow during the months of April-May, 2021. Air quality status was
      evaluated through monitoring and assessment of some of critical and health affecting
      air pollutants like 1. Respirable Suspended Particulate Matter: (PM10, cut off size
      ≤10 µm, and Fine Particulate Matter: (PM2.5, cut off size ≤ 2.5 µm); 2. Indicator
      Gases: Sulphur dioxide (SO2) and Nitrogen dioxide (NO2); and 3. Noise levels at 9
      representative locations which are grouped into 3 categories viz., i. Residential area,
      ii. Commercial area and iii. Industrial area.
      The 24 hr concentrations of PM10 ranged from 109.8 µg/m3 to 152.5 µg/m3 with an
      average of 127.1 µg/m3 while in case of PM2.5, the 24 hr concentrations ranged from
      60.7 µg/m3 to 71.1 µg/m3 with an average of 64.5 µg/m3. Irrespective of the locations,
      the average values of PM10 and PM2.5 were found to be above the permissible limits of
      100 µg/m3 for PM10 and 60 µg/m3 for PM2.5 prescribed by Central Pollution Control
      Board, New Delhi. However, the values of PM10 and PM2.5 increased by 26.1 % and
      16.6 % compared to the levels measured during Pre-Monsoon 2020 (Lockdown)
      period (i.e. April-May 2020). Similarly, the values of SO2 and NO2 increased by 113.9
      % and 23.1 %.

      The 24 hr concentrations of SO2 ranged from 10.1 to 18.5 µg/m3 with an average of
      13.4 µg/m3 while the 24 hr concentrations of NO2 ranged from 28.7 to 33.4 µg/m3 with
      an average of 31.8 µg/m3. The average values of SO2 and NO2 were well below the
      permissible limits of 80 µg/m3 for both SO2 and NO2 prescribed by CPCB, New Delhi
      (NAAQS-2009).
      The day time and night time noise levels ranged from 67.0 to 70.7 dB(A) and 55.4 to
      60.0 dB(A) in residential areas and from 67.2 to 79.0 dB(A) and 52.3 to 61.3 dB(A) in
      commercial areas respectively. These measured values were above their respective
      day time standard of 55 dB(A) and night time standard of 45 dB(A) for residential
      areas and 65 dB(A) and 55 dB(A) for commercial areas respectively. At Amausi
      Industrial area, the day time and night time noise levels were 73.6 dB(A) and 60.1
      dB(A) respectively. The values are below the standard of 75 dB(A) for day time and 70
      dB(A) for night time recommended for Industrial areas.
      The present study reveals that the levels of pollutants like inhalable particulate matter,
      gases, and noise are gradually increasing due to the fact that air quality monitoring of
      Pre-Monsoon 2021 coincided with some periods of partial to complete lockdowns to

Pre-Monsoon 2021                                                                        Page 2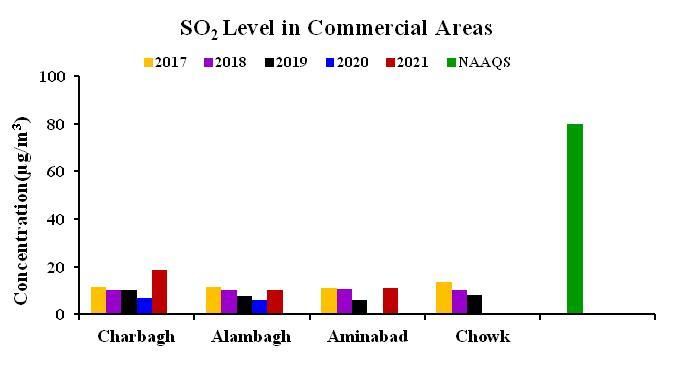
control of second wave of COVID-19 while the Pre-Monsoon 2020 study was held
      completely in lockdown period to control the first wave of COVID-19. More vehicles
      were permitted to ply on the road, domestic cooking, baking/firing in hotels, near field
      crop combustion and some industries were allowed to operate, Crematorium fires
      also increased as number of deaths were high during the Corona second wave
      pandemic period which also had an effect on the air pollution levels of Lucknow in
      Pre-Monsoon 2021. The overall trend reveals that all pollutants are increasing in
      Lucknow city.

1.1   INTRODUCTION

      Air pollutants present in the atmosphere, harmful to the health of humans and other
      living beings, also cause damage to the climate and environment. There are different
      types of air pollutants in the atmosphere, viz. particulates PM10 PM2.5 (both organic
      and inorganic); gases such as sulphur dioxide (SO2), nitrous oxides (NOx), carbon
      monoxide (CO), carbon dioxide (CO2), ammonia (NH3), methane (CH4) and
      chlorofluorocarbons (CFCs), ammonium and nitrate salts and biological molecules.
      Air pollution is considered to be the prime cause of diseases like asthma, chronic
      obstructive pulmonary disease (COPD), lower respiratory infections (LRI), allergies
      and even death in extreme cases. It may also cause harm to other living organisms
      such as animals and food crops and may damage the natural environment (causing
      climate change, ozone depletion and/or habitat degradation, acid rain formation etc). A
      recent study reported that atmospheric particulate matter may also act as a medium to
      disseminate viruses and keep them in the atmosphere for a certain period of time
      (Kumbhalgarh, 2020).

      Millions of people live in cities with severe air pollution, one of the key risk factors
      and leading cause of mortality (WHO, 2018). Polluted air holds many toxic pollutants
      which are specifically emitted by enhanced human activities. The issue of air pollution
      is a major concern since pollution levels are ever-increasing. Among the 12 criteria
      that determine air quality, pollutants (PM10/ particulate matter with cut off size 10
      µm, PM2.5/ particulate matter with cut off size 2.5 µm), SO2, NO2, CO, NH3, O3
      (ozone), C6H6 (benzene), BaP (Benzo-a-pyrene, a carcinogenic polyaromatic
      hydrocarbon) and particle phase metals of Pb (lead), Ni (nickel) and As (arsenic), the
      concentration of fine particulate matter i.e. PM2.5 is of utmost concern due to its size
      and consequently greater interactive surface area with respect to its mass. These

Pre-Monsoon 2021                                                                      Page 3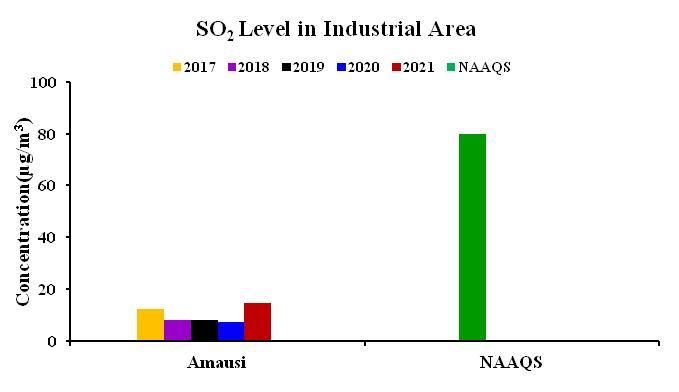
particulate matters, PM2.5 can reach deep into lungs, up to the alveoli sac from where it
      may get transported to other organs through systemic blood circulation resulting in
      systemic poisoning. PM10 and PM2.5 are both inhalable and their concentrations (pre-
      COVID-19) in most urban cities were often found to be 4 to 6 times higher as
      compared to the National Ambient Air Quality Standards (NAAQS). The gaseous
      pollutants i.e. SO2 and NO2 were found in moderate concentration and within the
      permissible limits. Extremely high concentration of these pollutants causes physical
      discomfort, disruption in life with fear of illness and even death. Regulatory measures
      have resulted in little success in management of air pollution because the
      characteristics of the source of pollutants are often complex to understand and their
      respective pollution loads in the atmosphere, difficult to estimate. However, real time
      air quality monitoring data has always played a significant role in identifying the
      changes in the source strength and also in enforcing upgraded air pollution control
      measures for cleaner air.

      Lucknow being the capital of Uttar Pradesh state has been reeling under severe air
      pollution, particularly from past two decades as the city has expanded rapidly with an
      ever increasing population. Consequently there is steady demand for increased
      transportation, better infrastructure, greater industrial production and other
      anthropogenic activities to meet the aspirations of the growing public in the city. The
      people of the city are consequently exposed to polluted air that has a detrimental
      impact on their health and well being. Air pollution levels in the city vary spatially and
      temporally with respect to the varying localized sources strength and unstable
      meteorological conditions. Hence, air quality survey/ monitoring in Lucknow is
      essential to assess the episodic/seasonal pollution load as well as for a comparative
      understanding of current versus previous pollution data. The assessment further helps
      in identifying the variations in the impact caused by short- and long-term exposure to
      pollutants. The seasonal air quality survey is an endeavour to understand whether the
      current pollution load in the city has crossed its permissible limits and what suitable
      abatement policies are required to be enforced so as to remain within the permissible
      standards.

      With this view, CSIR-Indian Institute of Toxicology Research, Lucknow, under the
      aegis of Council of Scientific and Industrial Research, New Delhi, Government of

Pre-Monsoon 2021                                                                        Page 4
India, has been continuing air quality survey in Lucknow during May-June (Pre-
Monsoon) and October-November (Post-Monsoon) seasons, every year since 1997 for
assessing ambient particulate (PM10 and PM2.5) and gaseous (SO2 and NOx) pollution
levels in Lucknow.
Uttar Pradesh government has imposed partial (weekend) complete lockdown from
16th April to 31st May 2021 to control the 2nd wave of the COVID-19 pandemic.
However, plying of vehicles during recent partial lockdown 2021 were more than that
seen during last year (2020) strict and complete Lockdowns.
Vehicular traffic has been considered to be the major source of air pollution in
Lucknow. Hence, vehicular and fuel consumption inventory for Lucknow city were
carried out. The number of different categories of vehicles registered with RTO
Lucknow as on March 31, 2021 are presented in Table 1. UPSRTC introduced bus
services as on 31.03.2021 are given in Table 2 and also presented the details of
eclectic city buses as public transport are given in Table 3. Filling stations for petrol,
diesel and CNG operated by different oil and gas companies are presented in Table 4.
Further, the fuel consumption details are illustrated in Table 5. Distribution and
number of CNG vehicles in Lucknow is summarized in Table 6.
Environmental Monitoring Division, CSIR-IITR Lucknow has carried out air quality
monitoring at 9 locations with respect to PM10, PM2.5 SO2, NO2 and noise level during
April-May-2021 (Pre-Monsoon), with the following aims and objectives;
to determine the concentrations of ambient air quality parameters with respect to
particulate matter (PM10, PM2.5) and gases (SO2 and NO2),
to find out the trends of pollutants over a period of time,
to measure the day and night time noise levels,
to create public awareness about environmental pollution and to find abatement
for air pollution at individual and community level and,
to create a competency like database for future use.
Pre-Monsoon 2021 Page 5Table 1
Comparison of Vehicular Numbers in Lucknow
No. of Registered Increase in
S. No. Type of Vehicles Vehicles as on 31st March %
2020-21 2019-20
1. Multi Articulated 6648 6144 8.2
2. Light, Medium & Heavy Weight 51603 47745 8.08
Vehicles (Four Wheelers)
3. Light Commercial Vehicles 3798 3652 3.99
(Three Wheeler)
4. Buses 4383 4291 2.49
5. Omni Buses 489 489 0
6. Taxi 37993 30362 20.08
7. Light Moto Vehicles 10557 10157 3.93
(Passenger)
8. Two Wheelers 1860778 1804077 3.14
9. Motor Cycle on Hire 384 384 0
10. Car 330596 313597 5.14
11. Jeep 105707 85689 23.36
12. Tractors 28022 27136 3.26
13. Trailers 1989 1961 1.4
14. Others 71514 71506 0.01
TOTAL 2514461 2407190 4.45
Source: RTO, Lucknow
Pre-Monsoon 2021 Page 6Table 2
Details of Lucknow CNG City Bus Service, 2021
S. Route No. of Frequency
To and Fro
No. No. Buses (minutes)
Raja ji Puram – Mawaiyya – Charbagh – GPO – Sikanderbagh
1 105 – Nishatganj – Polytechnic – Awadh Bus Station (Kamta) – 11 17
BBD
Scooter India – Krishna Nagar – Awadh Hospital – Alambagh
2 301 – Mawaiyya – Charbagh – GPO – Sikanderbagh – Nishatganj 9 18
– Badshah Nagar – Ram Ram Bank – Engg. College
Kashiram Yojna – Para Chowki - Awadh Hospital – Alambagh
– Mawaiyya – Charbagh – GPO – Sikanderbagh – Nishatganj
3 401 6 30
– Badshah Nagar – Gol Market – PS Gudmba – Integral
University
Charbagh- Hussanganj - GPO – Sikanderbagh - Gol Market –
4 502 Bhoothnath – HAL - Polytechnic – Awadh Bus Station 15 09
(Kamta)
Dubagga – Balaganj – Chowk – Medical College –
5 601 Kaiserbagh- Hussanganj – Charbagh – Mawaiyya – Alambagh 12 10
– Awadh Hospital
Dubagga – Faridipur – Buddheshwar- Para – Manak Nagar –
6 701 19 06
Awadh Hospital – Pakri Pul – Telibagh – Utrathia – SGPGI
Balaganj - Dubagga – Bhitauli – Tedhi Puliya – Khurram
7 801 Nagar – Sector 25 – Munshi Puliya – Polytechnic – Kamta – 19 08
Virajkhand Bus Station
Charbagh – Mawaiyya – Tedhi Puliya Alambagh – Jail Road –
8 901 1 120
Pasi Qila – Jyoti Gas – CRPF Chouraha – Azad Engg. College
Total 92
Pre-Monsoon 2021 Page 7Table 3
Details of Lucknow Electric City Bus Service, 2021
S. Route No. of Frequency
To and Fro
No. No. Buses (minutes)
Dubagga – Buddheshwar – Awadh Hospital - Alambagh –
1 301-E Mawaiyya – Charbagh – GPO – Sikanderbagh – Gol Market – 10 30
Engg. College – Madiyawo – Bhitauli – I.I.M. College
Dubagga – Faridipur – Buddheshwar- Para – Manak Nagar –
2 701-E 12 30
Awadh Hospital – Pakri Pul – Telibagh – Utrathia – SGPGI
Balaganj - Dubagga – Bhitauli – Tedhi Puliya – Khurram
3 801-E Nagar – Sector 25 – Munshi Puliya – Polytechnic – Kamta – 8 35
Virajkhand Bus Station
Dubagga – Buddheswer – Awadh Hospital – Charbagh –
Sikanderbagh – Balu Adda – Fun Cinema – Lohiya Park –
4 1001-E 10 25
CMS – Dayal Paradise – Manoj Pandey Chauraha – Husariya –
Virajkhand Bus Station
Total 40
Table 4
Fuel Outlets in Lucknow City
Number of
S.No. Agency outlets as on 31st
March 2021
1 Indian Oil Corporation (IOC) 51
2 Bharat Petroleum Corporation Ltd. (BPCL) 32
3 Hindustan Petroleum Corporation Ltd. (HPCL) 33
4 Compressed Natural Gas Stations (CNG) 33
Total 149
Source: Indian Oil Corporation (IOC), Lucknow, Bharat Petroleum Corporation (BPCL),
Hindustan Petroleum Corporation (HPCL), * CNG Source: Green Gas Limited, Lucknow.
Pre-Monsoon 2021 Page 8Table 5
Fuel Consumption in Lucknow City
Petrol in kL High Speed Diesel in kL CNG in Kg
S.
Agency
No. Apr.
% Change
% Change
% Change
Apr. 20 Apr.19 Apr.19 Apr. 20 Apr.19
20
to to to to to
to
Mar. 21 Mar. 20 Mar. 20 Mar. 21 Mar. 20
Mar.
21
1. IOC 85316 102547 -16.8 66726 79137 -15.7 11563212 15700482 -26.4
2. BPCL 48883 56657 -13.7 33984 37800 -10.1 918151 158682 478.6
3. HPCL 56950 39403 44.5 75950 38746 96.0 1840921 1860688 -1.1
4. Green Gas - - - - - - 12538366 42359025 -70.4
Total 191149 198607 -3.8 176660 155683 13.5 26860650 77798729 -65.5
LPG in Ton
% Change
Apr. 20 Apr.19
5. IOC to to - - - - - -
Mar. 21 Mar. 20
1737 1954 -11.1
Source: Indian Oil Corporation (IOC), Lucknow, Bharat Petroleum Corporation (BPCL),
Hindustan Petroleum Corporation (HPCL), CNG Source: Green Gas Limited, Lucknow.
Table 6
Distribution of CNG Vehicles
Number
S. No. Vehicles % of Change
2020-21 2019-20
1 Auto Rickshaws 4343 4343 -
2 Tempo Taxi 2575 2575 -
3 Buses (UPSRTC) 260 260 -
4 Buses (Private) 40 40 -
5 School Buses 1557 1557 -
6 School Van 2231 2231 -
7 Private Vehicles 472 472 -
8 Private Cars 24539 21168 15.92
Total 36017 32646 10.32
Source: RTO, Lucknow*, Green Gas Limited, Lucknow
Pre-Monsoon 2021 Page 91.2 MONITORING LOCATIONS AND METHODOLOGY
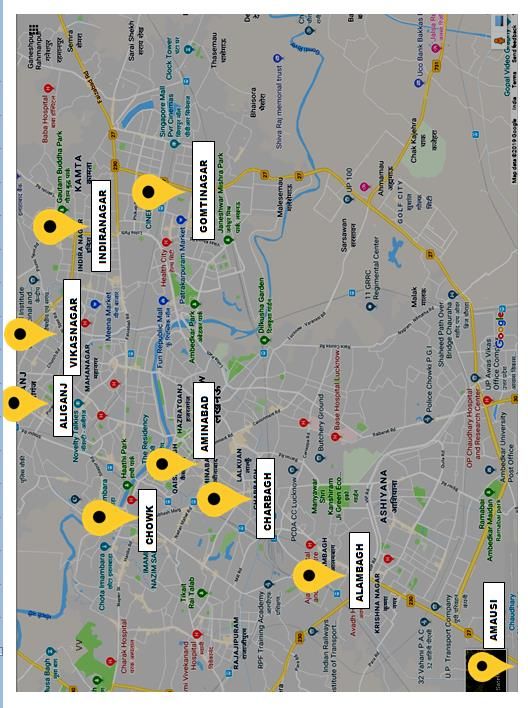
Nine air quality monitoring locations representing different activities/ areas i.e., four
in residential, four in commercial cum traffic and one industrial area were selected for
the Pre-Monsoon 2021 study as summarized in Table 7 and Figure 1 and adopted
methodologies are given in Table 8.
Table 7
Monitoring Locations
S .No. Locations Activities
1 Aliganj Residential
2 Vikas Nagar Residential
3 Indira Nagar Residential
4 Gomti Nagar Residential
5 Charbagh Commercial cum traffic
6 Alambagh Commercial cum traffic
7 Aminabad Commercial cum traffic
8 Chowk Commercial cum traffic
9 Amausi Industrial
Table 8
Parameters and Methodology for Air Quality Monitoring
Time Weighted
Sl. No. Parameters Methods of Measurement
Average
1 Particulate Matter (PM10) 24 hours Gravimetric
2 Fine Particles (PM2.5) 24 hours Gravimetric
3 Sulphur dioxide (SO2) 24 hours Improved West Gaeke
Modified Jacob &
4 Nitrogen Dioxide (NO2) 24 hours
Hochhesier (Na-Arsenite)
The measurement of noise
level was carried out during
5 Noise Level 1 hour the day (6 AM to 10 PM)
and night time (10 PM to 6
AM) by Noise Level Meter
Pre-Monsoon 2021 Page 10Figure 1: Ambient Air Pollution Monitoring Locations in Lucknow City Pre-Monsoon 2021 Page 11
1.3   RESULTS

      The detailed results of air quality monitoring during the Pre-Monsoon period are
      presented in Table 9 and Figure 2 and 3.

1.3.1 Respirable Suspended Particulate Matter (RSPM or PM10)

      In residential areas (Aliganj, Vikas Nagar, Indira Nagar and Gomti Nagar), the 24
      hours average concentrations of PM10 were in the range of 59.6 to 162.0 µg/m3 with
      an average of 120.6 µg/m3. In commercial areas (Charbagh, Alambagh, Aminabad and
      Chowk) the average concentrations of PM10 were in the range of 78.6 to 221.8 µg/m3
      with an average of 127.2 µg/m3 respectively. In industrial area (Amausi), the average
      concentration of PM10 was 152.5 µg/m3.

      The maximum 24 hours mean concentration of PM10 was observed in Gomti Nagar
      (128.7 µg/m3) in residential area and Charbagh (143.8 µg/m3) in commercial areas. All
      the values of PM10 were above the prescribed National Ambient Air Quality Standard
      (NAAQS) of 100 µg/m3 for industrial, residential, rural and other areas respectively.

1.3.2 Fine Particulate Matter (PM2.5)

      In residential areas (Aliganj, Vikas Nagar, Indira Nagar and Gomti Nagar), the 24
      hours average concentrations of PM2.5 were in the range of 32.7 to 112.7 µg/m3 with
      an average of 64.8 µg/m3. In commercial areas (Charbagh, Alambagh, Aminabad and
      Chowk) the average concentrations of PM2,5 were in the range of 31.2 to 140.9 µg/m3
      with an average of 65.0 µg/m3 respectively. In industrial area (Amausi), the average
      concentration of PM2.5 was 61.5 µg/m3.

      The maximum 24 hours mean concentration of PM2.5 was observed in Gomti Nagar
      (68.2 µg/m3) residential area and Charbagh (71.1 µg/m3) in commercial area. All the
      values of PM2.5 were above the prescribed NAAQS of 60 µg/m3 for industrial,
      residential, rural and other areas.

Pre-Monsoon 2021                                                                     Page 12
1.3.3 Sulphur dioxide (SO2)
In residential area (Aliganj) the mean levels of SO2 was in the range of 8.8 to 15.4
µg/m3 with an average of 12.5 µg/m3. In commercial areas (Charbagh, Alambagh and
Aminabad) the average concentrations of SO2 were in the range of 5.9 to 22.0 µg/m3
with an average of 13.3 µg/m3. In industrial area (Amausi), the mean level of SO2 was
14.6 µg/m3.
All the values of SO2 were well below the prescribed NAAQS of 80 µg/m 3 for all the
locations.
1.3.4 Nitrogen dioxide (NO2)
In residential areas (Aliganj) the 24 hours average concentrations of NO2 was in the
range of 27.6 to 42.6 µg/m3 with an average of 33.4 µg/m3. In commercial areas
(Charbagh, Alambagh and Aminabad) the average concentrations of NO2 were in the
range of 16.1 to 58.0 µg/m3 with an average of 31.1 µg/m3. In industrial areas
(Amausi), the average concentration was 32.4 µg/m3.
All the values of NO2 were within the prescribed NAAQS of 80 µg/m3 for all the
monitoring locations.
Pre-Monsoon 2021 Page 13Table 9
Concentration (µg/m3) of PM10, PM2.5, SO2 and NO2 during Pre-Monsoon 2021
Location PM10 (RSPM) PM2.5 SO2 NO2
Residential
Min Max Avg Min Max Avg Min Max Avg Min Max Avg
Aliganj 79.9 150.7 111.9 53.2 66.6 60.7 8.8 15.4 12.5 27.6 42.6 33.4
Vikas
71.5 142.7 117.3 43.7 86.3 62.5 ND ND ND ND ND ND
Nagar
Indira
65.9 156.9 124.5 35.3 112.7 67.6 ND ND ND ND ND ND
Nagar
Gomti
59.6 162.0 128.7 32.7 94.6 68.2 ND ND ND ND ND ND
Nagar
Commercial
Charbagh 107.5 167.8 143.8 59.6 89.2 71.1 13.8 22.0 18.5 21.0 48.1 32.8
Alambagh 97.1 201.0 133.9 32.2 112.8 64.5 5.9 14.8 10.1 15.1 58.0 31.8
Aminabad 85.6 167.6 109.8 31.2 138.5 62.0 6.0 19.3 11.2 19.8 43.1 28.7
Chowk 78.6 221.8 121.1 44.6 140.9 62.5 ND ND ND ND ND ND
Industrial
Amausi 108.0 181.8 152.5 32.4 123.5 61.5 10.7 20.8 14.6 23.7 42.0 32.4
NAAQS 100 60 80 80
WHO
50 25 20 40*
Guidelines
N=8, *= Annual Average, NAAQS=National Ambient Air Quality Standard
ND= Not Done
Pre-Monsoon 2021 Page 14Figure 2: Concentration (μg/m3) of PM10 and PM2.5 in different areas of Lucknow city
during Pre-Monsoon Season (2021) compared with prescribed National Ambient Air
Quality Standard (NAAQS)
Pre-Monsoon 2021 Page 15Mean Level of SO2 at different locations
100
SO2 NAAQS
Concentration (µg/m3)
80
60
40
20
0
Aliganj Charbagh Aminabad Alambagh Amausi NAAQS
100
Mean Level of NO2 at different locations
80
NO2 NAAQS
60
Concentration (µg/m3)
40
20
0
Figure 3: Concentration (μg/m3) of SO2 and NO2 in different areas of Lucknow city
during Pre-Monsoon season (2021) compared with prescribed National Ambient Air
Quality Standard (NAAQS)
Pre-Monsoon 2021 Page 161.3.5 Noise Level
The noise monitoring data recorded during the Pre-Monson period (May, 2021) is
presented in Table 10. In residential areas, the day and night time noise levels were
recorded between 67.0 to 70.7 and 55.4 to 60.0 dB(A) respectively. All the values
were higher than the prescribed limits of 55 and 45 dB (A) for day and night time
respectively.
In commercial and traffic area, the day and night time noise levels were recorded
between 67.2 to 79.0 and 52.3 to 61.3 dB(A) respectively. Noise level at all the
commercial sites during day time were above the prescribed limits of 65 dB (A).
However night time noise was below prescribed standard of 55 dB (A) at two
locations and above the standard at two other locations respectively. In industrial area
Amausi, the day and night time noise levels were recorded 73.6 and 60.1 dB(A)
respectively. Noise levels at industrial area were recorded lower than the prescribed
limits of 75.0 and 70.0 dB(A) respectively.
Table 10
Noise Level dB(A) during Day and Night Time
Noise level dB(A) Noise level dB(A)
S. 2021 2020
Area Location
No.
Day Night Day Night
Aliganj 67.6 58.1 62 44.5
Vikas Nagar 70.5 60.0 58.6 45.8
1 Residential Indira Nagar 67.0 55.4 60.2 42.7
Gomti Nagar 70.7 56.9 54.4 NA
Standard 55 45 55 45
Charbagh 72.2 61.3 68.3 47.8
Alambagh 67.2 52.3 60.1 NA
2 Commercial Aminabad 71.6 53.1 NA NA
Chowk 79.0 57.4 NA NA
Standard 65 55 65 55
Amausi 73.6 60.1 70.2 NA
3 Industrial
Standard 75 70 75 70
Pre-Monsoon 2021 Page 171.4 TRENDS OF AMBIENT AIR QUALITY IN LUCKNOW CITY
The observed PM10, PM2.5, SO2 and NO2 for 5 years Pre-Monsoon data have been
compared to find out the prevailing trend of air pollution in Lucknow city (Figures 4-
7). A slight change in the values may be attributed to some local environmental and
climatic factors and Lockdown restrictions imposed by the Government.
1.4.1 Respirable Suspended Particulate Matter (RSPM or PM10)
The level of PM10 at all the residential, commercial and industrial areas were relatively
higher as compared to monitoring data of previous year. All the values of the present
study were found to be higher than the NAAQS (Figure 4).
1.4.2 Fine Particulate Matter (PM2.5)
The level of PM2.5 has been compared with last four year data and all the values of
residential, commercial and industrial areas were higher than the previous year. All the
values of the present study were found to be higher than the NAAQS (Figure 5).
Overall Trend of PM10 and PM2.5
Figure 4 and 5 indicate that the PM10 concentration is in decreasing trend from 2017 to
2020 in the ambient air of Lucknow city which means that earlier city’s air pollution
level was more than that of today. This decreasing trend may be due to partial/
complete lockdown during 2020 and 2021 which may be attributed to lowered
vehicular density on road, less consumption of petrol/ diesel fuel and complete/ partial
closure of industrial establishments during lockdown periods.
Besides, there were significant improvements in traffic management like installation
of traffic signals, widening and making paved/ concrete road, sweeping of road dust,
avoidance of trash burning and proper disposal of municipal solid waste. Overall
traffic management has improved tremendously leading to fewer traffic jams and
hence improved ambient air quality.
Pre-Monsoon 2021 Page 181.4.3 Sulphur dioxide (SO2)
The level of SO2 during Pre-Monsoon since 2017 is presented in Figure 5 for all the
locations. In residential, commercial and industrial areas, higher concentrations of SO2
were found at all locations compared to that of the previous year. All the values of the
present study were found to be lower than the NAAQS (Figure 6).
1.4.4 Oxides of Nitrogen (NO2)
The level of NO2 during Pre-Monsoon since 2017 is presented in Figure 5 for all the
locations. All monitored locations showed increasing trend of nitrogen dioxide when
compared to last year values. All the values of the present study were found to be
lower than the NAAQS (Figure 7).
Pre-Monsoon 2021 Page 19Concentration(µg/m3)
PM10 Level in Residential Areas
2017 2018 2019 2020 2021 NAAQS
350
300
250
200
150
100
50
0
Aliganj Vikas Nagar Indira Nagar Gomti Nagar NAAQS
PM10 Level in Commercial Areas
2017 2018 2019 2020 2021 NAAQS
350
300
Concentration(µg/m3)
250
200
150
100
50
0
Charbagh Alambagh Aminabad Chowk NAAQS
PM10 Level in Industrial Area
2017 2018 2019 2020 2021 NAAQS
350
300
Concentration(µg/m3)
250
200
150
100
50
0
Amausi NAAQS
Figure 4: Concentration (μg/m3) of PM10 (RSPM) in Residential, Commercial and
Industrial areas of Lucknow city during 2017 to 2021 (Pre-Monsoon) and compared
with prescribed National Ambient Air Quality Standard (NAAQS)
Pre-Monsoon 2021 Page 20PM2.5 Level in Residential Areas
2017 2018 2019 2020 2021 NAAQS
140
Concentration(µg/m3)
120
100
80
60
40
20
0
Aliganj Vikas NagarIndira NagarGomti Nagar NAAQS
PM2.5 Level in Industrial Area
140 2017 2018 2019 2020 2021 NAAQS
Concentration(µg/m3)
90
40
-10
Amausi NAAQS
Figure 5: Concentration (μg/m3) of PM2.5 in Residential, Commercial and Industrial
areas of Lucknow city during 2017 to 2021 (Pre-Monsoon) and compared with
prescribed National Ambient Air Quality Standard (NAAQS)
Pre-Monsoon 2021 Page 21SO2 Level in Residential Areas
100 2017 2018 2019 2020 2021 NAAQS
Concentration(µg/m3)
80
60
40
20
0
Aliganj Vikas Nagar Indira Nagar Gomti Nagar NAAQS
Figure 6: Concentration (μg/m3) of SO2 in Residential, Commercial and Industrial
areas of Lucknow city during 2017 to 2021 (Pre-Monsoon) and compared with
prescribed National Ambient Air Quality Standard (NAAQS)
Pre-Monsoon 2021 Page 22NO2 Level in Residential Areas
100 2017 2018 2019 2020 2021 NAAQS
80
Concentration(µg/m3) 60
40
20
0
Aliganj Vikas Nagar Indira NagarGomti Nagar NAAQS
NO2 Level in Industrial Area
2017 2018 2019 2020 2021 NAAQS
100
80
Concentration(µg/m3)
60
40
20
0
Amausi NAAQS
Figure 7: Concentration (μg/m3) of NO2 in Residential, Commercial and Industrial
areas of Lucknow city during 2017 to 2021 (Pre-Monsoon) and compared with
prescribed National Ambient Air Quality Standard (NAAQS)
Pre-Monsoon 2021 Page 231.4.5 Noise Level
Current year’s Pre-Monsoon noise data was compared with the corresponding data of
the previous four years (2017 to 2021) and presented in Figure 8 and 9. The
comparative noise levels in residential, commercial and industrial areas are described
below:
1.4.5.1 Day time Noise Level
All residential, commercial cum traffic and industrial areas showed slightly increasing
trend over that of the previous year. The comparative data are presented in Figure 8.
1.4.5.2 Night time Noise Level
All residential, commercial cum traffic and industrial areas showed slightly increasing
trend over that of the previous year. The comparative data are presented in Figure 9.
Pre-Monsoon 2021 Page 24Day time Noise Level in Residential Areas
2017 2018 2019 2020 2021 Standard
100
80
dB(A)
60
40
20
0
Aliganj Vikas Nagar Indira Nagar Gomti Nagar Standard
Day time Noise Level in Commercial Areas
2017 2018 2019 2020 2021 Standard
100
80
60
dB(A)
40
20
0
Charbagh Alambagh Aminabad Chowk Standard
Day time Noise Level in Industrial Area
100 2017 2018 2019 2020 2021 Standard
80
60
dB(A)
40
20
0
Amausi Standard
Figure 8: Comparison of day time Noise Level dB(A) in different areas of Lucknow
city (Pre-Monsoon 2017-2021)
Pre-Monsoon 2021 Page 25Night time Noise Level in Residential Areas
100 2017 2018 2019 2020 2021 Standard
80
60
dB(A)
40
20
0
Aliganj Vikas Nagar Indira Gomti Nagar Standard
Nagar
Night time Noise Level in Commercial Areas
100 2017 2018 2019 2020 2021 Standard
80
dB(A)
60
40
20
0
Charbagh Alambagh Aminabad Chowk Standard
Night time Noise Level in Industrial Area
100 2017 2018 2019 2020 2021 Standard
80
dB(A)
60
40
20
0
Amausi Standard
Figure 9: Comparison of night time Noise Level dB(A) in different areas of
Lucknow city (Pre-Monsoon 2017-2021)
Pre-Monsoon 2021 Page 261.5 CONCLUSIONS
CSIR-IITR has monitored air pollutants such as PM10, PM2.5, SO2, NO2 at 9 locations
for the assessment of ambient air quality during the month of April-May 2021.
Besides, day and night time noise levels were also monitored at the same locations.
The main findings of the study are as follows:
The mean levels of PM10 (127.1 µg/m3) and PM2.5 (64.5 µg/m3) at all the
monitoring locations of residential, commercial and industrial areas were higher
than their respective NAAQS of 100 µg/m3 for PM10 and 60 µg/m3 for PM2.5.
The Pre-Monsoon, 2021 PM10 concentration has increased by 26.10 % w.r.t. Pre-
Monsoon 2020 (lockdown) while the PM2.5 concentration has increased by 16.57%
as compared to Pre-Monsoon 2020.
The concentration of gaseous pollutants, SO2 and NO2 were well below the
prescribed NAAQS (80 µg/m3) at all the locations but Pre-Monsoon 2021 gaseous
pollutant concentrations were higher at all locations w.r.t. Pre-Monsoon 2020
(lockdown). The average values of SO2 and NO2 has increased by 113.90 % and
23.13 %.
The day and night time noise levels at residential and commercial areas have
exceeded about 17.2 %, 12.92% during day times and 29.94%, 17.19% during
night times respectively in comparison with the prescribed standards (55 dB(A) for
day and 45 dB(A) for night times). However, the noise levels of Pre-Monsoon
2021 were found increased marginally at all the locations w.r.t. Pre-Monsoon 2020
(lockdown).
Overall results indicate that all the parameters monitored showed slightly
increasing trend compared to previous year which may be attributed to relaxation
in Lockdown restrictions from full curfew to partial curfew format from 2020 to
2021. District administration / Lucknow authority has taken many control
measures to minimize air pollution which helped to improve air quality of the city.
Higher levels of air pollutants and their effects on human health is a serious issue.
To resolve the issue, a comprehensive study is required in respect of present status
of different pollutants and their trends, sources of pollutants, public health risk
assessment for future planning on more safer urban areas.
Regulatory authorities, national institutes, academicians and NGOs should take
this issue seriously with authentic research, formation of viable rules and their
proper implementation as well as mass awareness amongst public.
Pre-Monsoon 2021 Page 271.6 RECOMMENDATIONS FOR MITIGATION OF AIR POLLUTION
A. Reduction of Vehicle Emission
1. Dense foliage is required along roadsides, especially air pollution tolerant/ resistant
ornamental plants to quench environmental pollutants. These plants will also enhance the
scenic beauty along the roads and overall city land spaces.
2. Synchronize consecutive traffic signals to facilitate smooth traffic flow and thus prevent
frequent traffic bottlenecks at signals.
3. Maintaining and retrofitting of particulate matter filter in vehicles, enforcement of BS-VI
standards, phase out older vehicles and encourage timely improvement in vehicle standards.
4. Encourage car pooling and public transport for daily commute.
B. Use Energy Efficient Gadgets/ Equipment’s and Techniques
5. Energy efficient policies to be introduced beyond the industries, to include households,
domestic sanitation and local transport sectors.
6. Effective particulate pollution reduction equipment such as bag filter/ scrubbers/ ESPs are to
be installed in all factories and industries located in city area.
7. Switch to greener air conditioning so as to reduce the greenhouse gas emissions.
8. Conserve the energy at home, at work place and everywhere.
C. Reduce Fugitive Emission
9. Use energy efficient equipment to reduce carbon emissions in a wide range of sectors such as
transport, manufacturing, production, agriculture etc.
10. Install proper HDPE construction nets/ meshes at construction and demolition sites to prevent
and restrict fugitive dust particles generated at the project site from mixing with ambient air.
11. Avoid burning of crop residues in the field which could be managed by using in-situ
technologies such as crop diversification.
12. Avoid trash burning and other material. Prevent and minimize open air burning of plastic/
garbage.
D. Other Measures
13. Need to improve the policy of transport sector as to minimize/ avoid frequent digging/ cutting
road and construction activities.
14. Loudspeakers with high decibels should be discouraged through legal/ administrative
measures.
15. Increase numbers of electric vehicles and charging stations to encourage their use
Pre-Monsoon 2021 Page 28ACKNOWLEDGEMENT
We, (CSIR-IITR, Lucknow) express our sincere thanks and gratitude to those who
provided required data with respect to vehicular population, transport, fuel
consumption (Petrol/Diesel/CNG/LPG/Green Gas). Their Names and Designation are
mentioned below:
Mr. R P Dwivedi, RTO, Mr. Akhilesh Kumar Dwivedi ARTO (Administration),
Mr. Sanjai Tiwari ARTO (Enforcement ), Mr. P.V. Shukla (DBA) Lucknow,
Mr. Vinod Kumar, Assistant Regional Manager, City Transport Services Ltd.
Gomtinagar, Lucknow,
Mr. Manoj Sharma, Assistant Regional Manager, Mr. Amir Najir Station
Incharge, City Transport Services Ltd, Dubagga Depot, Lucknow,
Mr. Mukesh Bharadwaj, Sr. Manager, Retail Sales, IOC, Lucknow,
Mr. Pravir Muttu, Chief Manager, Business Planning (Retails), U.P., BPCL Mr.
Shantanu Singh, Sales Officer, BPCL, Lucknow
Mr. Sanjai Srivastava, Dy. Gen. Manager, HPCL, Lucknow, Mr. Ashutosh,
Manager (RE & Analytic), HPCL, Lucknow
Mr. Sharat Kumar, Director Commercial, Green Gas Ltd, Lucknow and Mr. Surya
Prakash Gupta, Chief Manager (Marketing), Green Gas Ltd, Lucknow.
We also express our sincere thanks and gratitude to those who provided necessary
facilities and support to our field team at different monitoring localities.
---------------------------------
Pre-Monsoon 2021 Page 29lh,lvkbZvkj&vkbZ vkbZ Vhvkj&lhvkjVhMh,p
CSIR-IITR
DSIR
GLP
Bio-NESTYou can also read