Spatial overlap of wind farms on peatland with sensitive areas for birds
←
→
Page content transcription
If your browser does not render page correctly, please read the page content below
Spatial overlap of wind farms on peatland with sensitive areas for birds
  J.A. Bright1, R.H.W. Langston1, J.W. Pearce-Higgins2, R. Bullman3, R. Evans2 and S. Gardner2

          The Royal Society for the Protection of Birds (RSPB), 1Sandy, Bedfordshire and 2Edinburgh, UK
                                      3
                                        Scottish Natural Heritage, Stirling, UK
_______________________________________________________________________________________

SUMMARY

The UK Government has set stringent targets for renewable energy generation, prompting a substantial
increase in proposals for wind farms, notably in the Scottish uplands which have a particularly high wind
resource. These upland areas also support many bird species of conservation concern, leading to potential
conflict. To help minimise this conflict, a map has been created indicating areas in Scotland where especially
careful planning of wind farms will be necessary to avoid adverse impacts on vulnerable bird species. This
map is based on the locations of statutorily protected Special Protection Areas, plus eighteen bird species of
conservation priority. It is used here to assess the proportion of current and proposed wind farms on peatland,
whether these coincide with mapped sensitive areas for birds, and which species are most likely to be
affected. A high proportion of wind farms are on peatland (by stage in planning process: scoping 40%,
application 38 %, approved 23%, installed 55%), although the area of peatland is only ca. 12% that of
Scotland. Peatland also contains a high proportion of sensitive areas for birds. Of the 1 km squares from the
sensitivity map whose centres fall within peatland, 52% are high sensitivity, 32% medium sensitivity and
17% low/unknown sensitivity. This compares with figures of 37%, 31% and 32% respectively for Scotland
overall. Species on the map that are associated with peatland are red-throated diver, black-throated diver,
common scoter, hen harrier and arctic skua. Of these, hen harrier is the species most likely to coincide with
current and future wind farm developments, and cumulative effects of peatland wind farms on this species
require assessment.

KEY WORDS: bird conservation, bird sensitivity map, renewable energy, Scotland, wind turbine.
_______________________________________________________________________________________

INTRODUCTION                                               species listed in Annex I of the EU Birds Directive
                                                           (EC 1979). Some of these species are concentrated
Climate change is regarded as the greatest long-term       in statutory Special Protection Areas (SPAs), but
threat to birds and other wildlife, with mid-range         others are widely dispersed. Only 15% of the UK
climate warming scenarios predicting that 15–37%           breeding population of golden eagle occurs within
of species world-wide will be ‘committed to                SPAs (Stroud et al. 2001).
extinction’ by 2050 (Thomas et al. 2004). In                   Collision and disturbance displacement are the
response to the threats posed by climate change, the       main adverse effects of wind farms on birds (see
proposed European Union Renewable Energy                   Langston & Pullan 2003, Hötker et al. 2006 and
Directive has set a target of 20% of energy                Drewitt & Langston 2006 for reviews). Effects can
generation across member states to come from               be site- and species-specific, but remain relatively
renewable sources by 2020, with the UK allocated a         poorly understood. Low collision rates have been
target of 15% (EU 2008). The Scottish                      recorded at many wind farms (e.g. reviews by
Government’s target is for 50% of electricity from         Erickson et al. 2001, Langston & Pullan 2003,
renewables by 2020 (Scottish Executive 2008).              Percival 2005, Drewitt & Langston 2006), but there
Wind is currently one of the cheapest and most             are notable exceptions where collision mortality has
technologically advanced forms of renewable                been high (e.g. Barrios & Rodríguez 2004, 2007,
energy, and thus these targets have resulted in an         Everaert & Stienen 2006, Smallwood & Thelander
increase in wind farm proposals. Scotland has one          2008) and meta-analysis found reduced abundances
of the best wind resources in western Europe, and as       at wind farm sites of wildfowl and waders in
a result, 42% of the UK’s wind farm proposals are          particular, but also of raptors and songbirds (Stewart
in Scotland, notably in upland habitats (BWEA              et al. 2007).
2008). The Scottish uplands also support many bird             Careful location of wind farms is key to
species of conservation importance including               minimising negative effects on birds (Langston &

       Mires and Peat, Volume 4 (2008–2010), Article 07, http://www.mires-and-peat.net/, ISSN 1819-754X
                  © 2008 International Mire Conservation Group and International Peat Society                 1
J.A. Bright et al. PEATLAND WIND FARMS OVERLAP WITH SENSITIVE AREAS FOR BIRDS
Pullan 2003, Percival 2005, Langston et al. 2006, Most national surveys are based on the locations of
Stewart et al. 2007). Given the increasing demand nests or birds in the breeding season, but survey
for wind energy in the UK and particularly in units varied.
Scotland, a strategic approach to locating wind The map was created in a Geographical
farms is necessary to safeguard species of Information System (GIS). Distributional data were
conservation concern. To aid this, a map of bird mapped separately for each bird species. These data
sensitivity to onshore wind farms was created for were buffered according to species, e.g. with circles
use as a planning tool, based on SPAs plus the of fixed radius centred on nest locations or polygons
distributions of eighteen bird species of including set margins around loch (lake) shorelines,
conservation concern with known or suspected and sensitivity ratings were applied to these
vulnerability to wind turbines (Bright et al. 2006, buffered areas. Buffer radii and sensitivity ratings
2008). This map was used to assess the overlap of were determined following reviews of literature
wind farms with occurrences of different bird relating to territory size, foraging ranges, sensitivity
species (Bright et al. 2008). Here, the distributions to disturbance, collision risk and other relevant
of peatland and wind farms are overlaid on the features of behavioural or population ecology for
sensitivity map to assess the potential impact on each species. Full details of data sources and buffer
peatland birds of planned wind farms in Scotland. distances are provided elsewhere (Bright et al. 2006,
2008).
Buffered areas were assigned a rating of high or
METHODS medium sensitivity for each species. Maps of
buffered areas for each species were converted to
Creation of the sensitivity map 1 km square grids, and the individual species maps
The map was based on locations of SPAs, plus were then combined to produce a composite map by
eighteen bird species of conservation concern choosing the highest sensitivity rating of any species
(Table 1). SPAs are defined under Article 4 of the for each 1 km square. No weighting was given to
EU Birds Directive (EC 1979) as “most suitable the number of species occurring in each square,
territories” to deliver conservation of Annex I and because the legal basis for recognising species of
regularly occurring migratory bird species. In conservation concern does not distinguish between
particular, SPAs were used as surrogates for areas priority species. Sensitivity ratings on the composite
occupied by congregational species of wintering map are defined as follows:
geese and other waterbirds, and colonial nesting 1. high sensitivity with respect to one or more
seabirds, as a high proportion of their populations species, or within an SPA - these areas merit
occur within SPAs (Stroud et al. 2001). particular care when locating wind farms;
The SPA network accommodates only small 2. medium sensitivity for one or more species; and
proportions of the populations of some dispersed 3. low/unknown sensitivity - not sensitive for any of
species, and so the distributions of a further eighteen the species on the basis of available data.
species were included on the map. Fourteen of these
were Annex I species for which the literature Assessing the sensitivity of peatlands
indicates sensitivity to collision risk or disturbance, The sensitivity map was used to assess:
particularly in relation to wind farms. Four 1. the extent to which current and proposed wind
additional species were included because, although farms overlap with peatland;
not listed in Annex I, their UK distributions are very 2. the extent to which peatland areas correspond
localised or they are undergoing rapid population with sensitive areas for birds; and
decline and are not well represented within the SPA 3. which bird species are most likely to be affected.
network. BGSDiGMap-62 5000 (British Geological Survey
Fairly comprehensive national surveys of many 2008) data were used to form a layer of peat soils in
of these species take place at regular intervals, under Scotland. Wind farm locations were obtained from
the Statutory Conservation Agency/RSPB Breeding the Scottish Natural Heritage (SNH) renewable
Bird Scheme (SCARABBS, Baker et al. 2006). For energy database (February 2007 version, SNH
a few species, however, national survey data were unpublished). Wind farms were at one of four stages
supplemented with data from regional surveys. The in the planning process, namely installed
most recent datasets available were used, but age of (operational), approved (planning consent granted),
survey varied; and for some species - for example application (planning permission sought), or scoping
those using alternative breeding locations in (registered with the planning authority in order to
different years - the data were from a span of years. seek direction for environmental assessment).
Mires and Peat, Volume 4 (2008–2010), Article 07, http://www.mires-and-peat.net/, ISSN 1819-754X
© 2008 International Mire Conservation Group and International Peat Society 2J.A. Bright et al. PEATLAND WIND FARMS OVERLAP WITH SENSITIVE AREAS FOR BIRDS
Table 1. Overlap of different bird species with peatland and peatland wind farms.
Number of peatland locations for which
Number (%) of centres buffers overlap wind farm footprints
Total locations (% of total locations plotted)
Species of locations that fall Scottish population estimate
plotted (number)
within peatland Installed wind 1
All wind farms
farms
Red-throated diver 935 breeding pairs
2,021 845 (42) 4 (J.A. Bright et al. PEATLAND WIND FARMS OVERLAP WITH SENSITIVE AREAS FOR BIRDS
Table 1 continuation
Number of peatland locations for which
Number (%) of centres buffers overlap wind farm footprints
Total locations (% of total locations plotted)
Species of locations that fall Scottish population estimate
plotted (number)
within peatland Installed wind
All1 wind farms
farms
Capercaillie 1,980 males
3,231 37 (1) 0 (0) 0 (0)
Tetrao urogallus (Eaton et al. 2007b)
Corncrake 1,067 calling males
797 30 (4) 0 (0) 0 (0)
Crex crex (O’Brien et al. 2006.)
2 2,136 apparently occupied
Arctic skua
84 25 (30) 0 (0) 1 (1) territories
Stercorarius parasiticus
(Mitchell et al. 2004)
Nightjar 27 churring males
17 2 (12) 0 (0) 0 (0)
Caprimulgus europaeus (Conway et al. 2007)
Chough 83 pairs
82 4 (5) 0 (0) 0 (0)
Pyrrhocorax pyrrhocorax (Finney & Jardine 2003)
1
This category includes scoping, application, approved and installed wind farms.
2
Species not listed in Annex I of the EU Birds Directive (EC 1979).
For golden plover Pluvialis apricaria and dunlin Calidris alpina schinzii the only comprehensive data available were at the 10 km square level of resolution. For this
reason, squares containing high densities of these species were denoted as ‘medium sensitivity’ on the map in order to highlight possible hotspots for planners, but
they were not included in the analyses because of the coarse resolution of data.
Mires and Peat, Volume 4 (2008–2010), Article 07, http://www.mires-and-peat.net/, ISSN 1819-754X
© 2008 International Mire Conservation Group and International Peat Society 4J.A. Bright et al. PEATLAND WIND FARMS OVERLAP WITH SENSITIVE AREAS FOR BIRDS
Locations of wind farms in the database were peatland, the number of species for which the
given as single central point references. For centre of the buffered area coincided with
analysis, the footprints of the wind farms were peatland was calculated. These central points
estimated from their output capacities. The represented different features for different
relationship was quantified using turbine locations species (e.g. nest site location, centre of breeding
extracted from available Environmental Statements territory, centre of breeding loch). They were
for 46 wind farms in the UK. The turbine locations used as an index of the number of birds on
were plotted and buffered by 100 m to prevent linear peatland, which was compared with the number
arrays or single turbines from having zero area. The expected by chance (taken to be 12% of the total
outer edges of buffers within 1 km of each other number of locations, this being the percentage of
were then joined to create a footprint for each wind Scotland’s area that is peatland) using a Chi-
farm. The following predictive relationship (R2 = square test to test for significance of
0.98) between footprint F (km2) and output capacity associations. To test which species might be
O measured in MW was derived using linear affected by wind farms on peatland, either
regression: currently or in the future, the number of buffered
locations for each species that intersected with
F = (7E-05 x O2) + (0.0505 x O) + 0.0295 [1] footprints of (a) installed wind farms, and (b)
wind farms at all stages in the planning process
This relationship was used to estimate the footprints (installed, approved, application and scoping)
of all wind farms in the SNH database, and a was calculated. Again, the buffered areas
circular buffer of the appropriate area was then represented different features according to
drawn around each central point to represent species, for example approximating foraging
footprint size. In cases where the output capacity of range for some and a breeding loch plus
the wind farm was not given (installed 6/38, disturbance distance for others (see Bright et al.
approved 4/39, application 73/159, scoping 42/91), 2006 for full details). Where a species had both
the median value for wind farms at the same stage high and medium sensitivity buffered areas, only
of planning was used (installed = 7.5 MW, approved the high sensitivity buffers were used for this
= 17.5 MW, application = 30 MW, scoping = 33 analysis (representing either the core range, or
MW). Wind farms with output capacities below more recent data).
1 MW (n = 18, generally single turbines) were
excluded from the analyses.
The sensitivity map was overlaid with the RESULTS
peatland and wind farm maps in GIS in order to
calculate the statistics listed below. Proportion of wind farms on peatland
1. The number of estimated footprints of wind The peat soils layer for Scotland had a total area of
farms at each stage in the planning process 9,720 km2, comprising approximately 12% of the
intersecting with the peatland area (i.e. how total area of the country. Overall, 40% of all wind
many wind farms overlapped with peatlands). farms at the scoping stage, 38% of wind farm
2. The proportions of 1 km squares whose centres applications, 23% of approved wind farms and 55%
fell within peatland with, respectively, high, of installed wind farms were on peat soils
medium and low/unknown sensitivity ratings (Figure 1).
(i.e. what proportion of squares of each
sensitivity ranking coincided with peatland). Bird sensitivities to peatland wind farms
These were compared with the proportions of The sensitivity map is presented at the tetrad (2 km
different sensitivity ratings amongst non- square) scale of resolution in Figure 2. This version
peatland squares using a Chi-square test. is based on the 1 km square map, but the underlying
3. The proportion of bird locations for each species 1 km square sensitivity ratings are not presented in
included in the sensitivity map that fell within order to protect locations of species that are
peatland (i.e. which species showed significant vulnerable to persecution. If a tetrad contained any
associations with peatland), and which of these high sensitivity 1 km squares it was shaded red, and
were most likely to be affected by current and if it contained no high sensitivity but one or more
potential future wind farm development (i.e. to medium sensitivity squares, it was shaded yellow.
what extent buffered bird distributions Colour intensity increases with increasing number
overlapped with wind farm footprints). In order of high or medium sensitivity squares within the
to assess the association of different species with tetrad. Low/unknown sensitivity areas are unshaded.
Mires and Peat, Volume 4 (2008–2010), Article 07, http://www.mires-and-peat.net/, ISSN 1819-754X
© 2008 International Mire Conservation Group and International Peat Society 5J.A. Bright et al. PEATLAND WIND FARMS OVERLAP WITH SENSITIVE AREAS FOR BIRDS
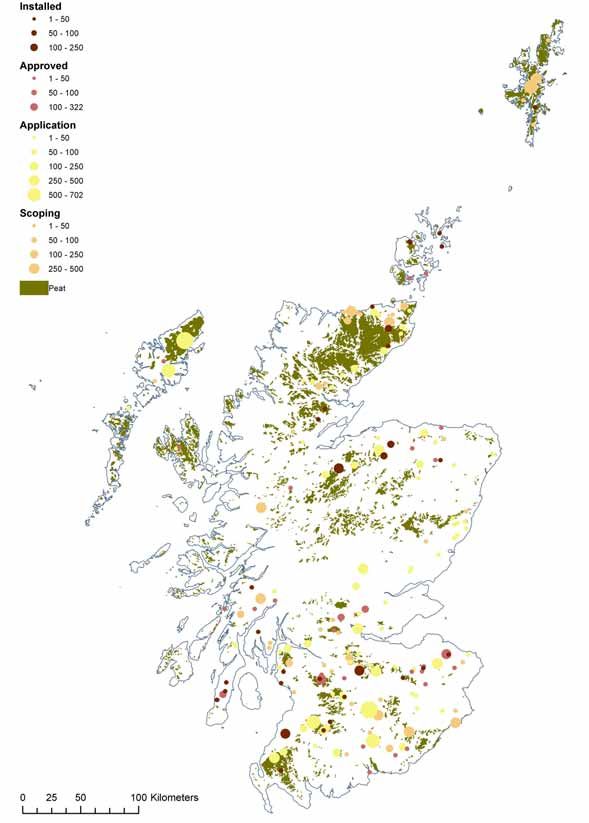
Figure 1. Wind farms at different stages of the application process (SNH unpublished, February 2007)
overlaid on the distribution of peat drift in Scotland (British Geological Survey 2008), which is used to
indicate the distribution of peat soils and peatland. The sizes of the circles indicate energy output capacities
in MW.
Mires and Peat, Volume 4 (2008–2010), Article 07, http://www.mires-and-peat.net/, ISSN 1819-754X
© 2008 International Mire Conservation Group and International Peat Society 6J.A. Bright et al. PEATLAND WIND FARMS OVERLAP WITH SENSITIVE AREAS FOR BIRDS
Figure 2. Map of sensitive areas for birds in the context of onshore wind farm development in Scotland,
presented at the tetrad (2 km x 2 km) level of resolution to protect locations of vulnerable species.
This Figure was published in Biological Conservation (2008), Bright, J., Langston, R., Bullman, R., Evans, R., Gardner, S. and
Pearce-Higgins, J. Map of bird sensitivities to wind farms in Scotland: A tool to aid planning and conservation. Copyright Elsevier.
Mires and Peat, Volume 4 (2008–2010), Article 07, http://www.mires-and-peat.net/, ISSN 1819-754X
© 2008 International Mire Conservation Group and International Peat Society 7J.A. Bright et al. PEATLAND WIND FARMS OVERLAP WITH SENSITIVE AREAS FOR BIRDS
Overall, the overlap between 1 km squares from DISCUSSION
the bird sensitivity map and peatland was as
follows: 52% of squares had a rating of high Wind farms in Scotland are disproportionately more
sensitivity, 32% medium sensitivity, and 17% likely to be sited on peatland than on other soil
low/unknown sensitivity. For non-peatland squares, types. This is not unexpected, as peatlands often
35% were high, 31% medium and 34% occur in upland areas, which have high wind
low/unknown sensitivity, with the figures for resources; although there are also considerable wind
Scotland overall being 37%, 31% and 32% resources outside these areas (Figure 3). However, it
respectively. Significantly more peatland than non- could place peatland birds under greater pressure
peatland squares had a rating of high sensitivity from wind farm development than birds of other
(χ21 = 525.05, p < 0.0001). Of the high sensitivity habitats.
squares on peatland, 53% were within SPAs, Peatlands are also more likely to contain
compared with 28% of high sensitivity non-peatland sensitive bird areas. The bird data used to produce
squares (χ21 = 2061.88, p < 0.0001). the sensitivity map represent different attributes for
different species (e.g. a nest site or sighting of a bird
Sensitive bird locations in peatland areas showing evidence of breeding behaviour). Data
Five of the sixteen species showed significant from more than one year were used for some
associations with peatland. These were red-throated species, and in other cases not all locations were
diver (χ21 = 1700.81, p < 0.0001), black-throated breeding locations (Bright et al. 2006). However,
diver (χ21 = 12.92, p < 0.0001), common scoter (χ21 = the proportion of locations on peat for each species
113.24, p < 0.0001), hen harrier (χ21 = 234.33, p < was used as an index of association with peatland.
0.0001) and arctic skua (χ21 = 25.09, p < 0.0001). Species that have significant associations with
Five species showed neither preference for nor peatland are red-throated diver, black-throated diver,
avoidance of peatland; these were Slavonian grebe common scoter, hen harrier and arctic skua.
(χ21 = 0.50, p = 0.479), bean goose (χ21 = 0.14, p = Given the large number of proposed wind farms
0.712), white-tailed eagle (χ21 = 3.03, p = 0.08), on peatland and the association with peatland of
golden eagle (χ21 = 2.89, p = 0.09) and nightjar (χ21 = several bird species of conservation concern, there is
0.0009, p = 0.98). The remaining six species were potential for conflict between bird conservation and
found on peatland less often than expected by wind energy. However, the analysis shows that at
chance; these were red kite (χ21 = 22.64, p < 0.0001), present there is little or no overlap between installed
peregrine falcon (χ21 = 28.86, p < 0.0001), black wind farms on peatland and most bird species. The
grouse (χ21 = 52.27, p < 0.0001), capercaillie (χ21 = highest overlap was for hen harrier, with 2% of all
360.51, p < 0.0001), corncrake (χ21 = 51.19, p < buffered areas overlapping with the estimated
0.0001) and chough (χ21 = 3.94, p < 0.0001). footprints of currently installed wind farms on
The species occurring most commonly on peat peatland. For wind farms at all stages of the
soils were common scoter, red-throated diver and planning process (installed, approved, application
hen harrier, with 49%, 42% and 34% of the and scoping), 6% of buffered areas for hen harrier or
locations plotted on the map occurring on peat soils. 17% of hen harrier locations on peatland overlap
Thirty percent of locations for arctic skua and 19% with the estimated footprints of existing or proposed
for black-throated diver were on peat soils. wind farms. Previous analysis to assess the overlap
Of the bird locations on peat soils, buffered areas of all wind farms with all hen harrier buffers (i.e.
(i.e. areas within which birds may be vulnerable to both on and off peatland) found that 13% of hen
effects of wind farm development) intersected with harriers were potentially affected (Bright et al.
estimated installed wind farm footprints only for 2008). The proportion affected by wind farms on
hen harrier and red-throated diver. For hen harrier, peatland will be a subset of this (given that only
ten of the buffered areas (2% of all buffered areas) approximately 12% of Scotland’s area is peatland),
overlapped with an installed wind farm footprint; hence the 6% figure. However the fact that 17% of
for red-throated diver the figure was four (0.2% of hen harrier buffers on peatland overlapped with
all buffered areas). Considering wind farms at all wind farms suggests a closer correspondence
stages in the planning process, overlap with buffered between hen harriers and wind farm development on
areas for birds was relatively low for most species, peatland than in non-peatland habitats. Therefore,
the highest overlap being 6% of all buffered areas cumulative effects of wind farms on peatland in
for hen harrier. particular need to be considered for this species.
Mires and Peat, Volume 4 (2008–2010), Article 07, http://www.mires-and-peat.net/, ISSN 1819-754X
© 2008 International Mire Conservation Group and International Peat Society 8J.A. Bright et al. PEATLAND WIND FARMS OVERLAP WITH SENSITIVE AREAS FOR BIRDS
Figure 3. Map of Scotland showing annual mean wind speed (m s-1) at 45 metres above ground level by 1 km
square (BERR 2007).
Mires and Peat, Volume 4 (2008–2010), Article 07, http://www.mires-and-peat.net/, ISSN 1819-754X
© 2008 International Mire Conservation Group and International Peat Society 9J.A. Bright et al. PEATLAND WIND FARMS OVERLAP WITH SENSITIVE AREAS FOR BIRDS
Generally, current and potential wind farm detailed by Bright et al. (2006). This paper formed
developments occur outside the most sensitive areas the basis of the presentation entitled “Wind farms
for birds (Figures 1 and 2). It is hoped that the and birds - sensitivity mapping” which was
sensitivity map will help to maintain this situation, delivered at the IMCG symposium Wind Farms on
and will facilitate careful planning within peatland Peatland held in Santiago de Compostela, Spain,
areas to help balance future wind farm development 27–30 April 2008.
and bird conservation.
The map was created using the best currently
available data and information, but there are REFERENCES
inevitably caveats that apply to its use.
Unfortunately, data deficiency and gaps in survey Aquatera (2006) Highland Renewable Energy
coverage ruled out a distinction between low and Strategy and Planning Guidelines, April 2006.
unknown sensitivity squares. Some peatland Final Draft. Report to Highland Council,
species, such as dunlin and golden plover, could not Inverness, 65 pp. Online at: http://www.
be included due to data deficiency (but see Pearce- highland.gov.uk/yourenvironment/planning/ener
Higgins et al. (2008) for a coarser-scale assessment gyplanning/renewbleenergy/highlandrenewablee
of the likely impacts of wind farms on golden plover nergystrategy.htm.
in Scotland). Thus, the map is intended as an Baker, H., Stroud, D.A., Aebischer, N.J.,
indicative tool, and is not a substitute for site- Cranswick, P.A., Gregory, R.D., McSorley, C.A.
specific Environmental Impact Assessment. The Noble, D.G. & Rehfisch, M.M. (2006)
level of information on which buffer distances and Population estimates of birds in Great Britain
sensitivity ratings were based also varied, being and the United Kingdom. British Birds, 99, 25–
fairly comprehensive for some species but sparse for 44.
others. The map should be updated as new Banks, A.N., Coombes, R.H. & Crick, H.Q.P.
information becomes available. (2003) The Peregrine Falcon Breeding
The bird sensitivity map can be used by Population of the UK & Isle of Man in 2002.
consenting authorities, in combination with other BTO Research Report No. 330, British Trust for
constraints to wind farm development, to identify Ornithology, Thetford, 65 pp.
preferred areas for wind farm development within a Barrios, L. & Rodríguez, A. (2004) Behavioural and
region. An example may be found in the Highland environmental correlates of soaring bird
Renewable Energy Strategy (Aquatera 2006). The mortality at on-shore wind turbines. Journal of
map is also intended to aid developers during site Applied Ecology, 41, 72–81.
selection. Barrios, L. & Rodríguez, A. (2007) Spatiotemporal
Scotland was considered a priority within the UK patterns of bird mortality at two wind farms of
for sensitivity mapping, as it has the highest number Southern Spain. In: de Lucas, M., Janss, G.F.E.
of onshore wind farm proposals. The approach is & Ferrer, M. (eds.) Birds and Wind Farms,
currently being extended to England and could be Quercus, Madrid.
exported to other countries. Furthermore, a similar BERR (2007) Wind Speed Database. Department
approach could be used to highlight areas of high for Business, Enterprise and Regulatory Reform.
bird sensitivity to other types of development. Online at: http://www.berr.gov.uk/energy/
sources/renewables/renewables-explained/wind-
energy/page27708.html.
ACKNOWLEDGEMENTS Bright, J.A., Langston, R.H.W., Bullman, R., Evans,
R.J., Gardner, S., Pearce-Higgins, J. & Wilson,
The authors would like to thank the RSPB and SNH E. (2006) Bird Sensitivity Map to Provide
for jointly funding this project, Ellen Wilson for Locational Guidance for Onshore Wind Farms in
advice and technical expertise, and Colin Campbell Scotland. RSPB Research Report No. 20, 136 pp.
for technical assistance with GIS. For data used in Online at: http://www.rspb.org.uk/scotland/
the project we are grateful to the Bean Goose Action policy/sensitivitymap.asp.
Group, the Capercaillie Biodiversity Action Plan Bright, J., Langston, R., Bullman, R., Evans, R.,
Steering Group, the UK Joint Nature Conservation Gardner, S. & Pearce-Higgins, J. (2008) Map of
Committee (JNCC), the Perthshire Black Grouse bird sensitivities to wind farms in Scotland: a
Study Group, the Rare Breeding Birds Panel and the tool to aid planning and conservation. Biological
Scottish Raptor Study Groups, and the many Conservation, 141, 2342–2356.
individuals who contributed data and expertise as British Geological Survey (2008) Geology onshore
Mires and Peat, Volume 4 (2008–2010), Article 07, http://www.mires-and-peat.net/, ISSN 1819-754X
© 2008 International Mire Conservation Group and International Peat Society 10J.A. Bright et al. PEATLAND WIND FARMS OVERLAP WITH SENSITIVE AREAS FOR BIRDS
digital maps 1: 625 000 scale (DiGMapGB-625). Hötker, H., Thomsen, K-M. & Jeromin, H. (2006)
http://www.bgs.ac.uk/products/digitalmaps/digm Impacts on biodiversity of exploitation of
apgb_625.html. renewable energy sources: the example of birds
BWEA (2008) Wind Farm Statistics. Online at: and bats - facts, gaps in knowledge, demands for
http://www.bwea.com/statistics/. further research, and ornithological guidelines
Conway, G., Wotton, S., Henderson, I., Langston, for the development of renewable energy
R., Drewitt, A. & Currie, F. (2007) Status and exploitation. Michael-Otto-Institut im NABU,
distribution of European Nightjars in the UK in Bergenhusen. Online at: http://bergenhusen.nabu.
2004. Bird Study, 54, 98–111. de/bericht/englische%20windkraftstudie.pdf.
Drewitt, A.L. & Langston, R.H.W. (2006) Langston, R.H.W., Fox, A.D. & Drewitt, A.L.
Assessing the impacts of wind farms on birds. (2006) Conference plenary discussion,
Ibis, 148(s1), 29–42, doi: 10.1111/j.1474-919X. conclusions and recommendations. Ibis, 148,
2006.00516.x. 210–216.
Eaton, M.A., Dillon, I.A., Stirling-Aird, P.K. & Langston, R.H.W. & Pullan, J.D. (2003) Wind
Whitfield, P. (2007a) The status of the Golden Farms and Birds: an Analysis of the Effects of
Eagle Aquila chrysaetos in Britain in 2003. Bird Wind Farms on Birds and Guidance on
Study, 54, 212–220. Environmental Assessment Criteria and Site
Eaton, M.A., Marshall, D. & Gregory, R.D. (2007b) Selection Issues. BirdLife International report to
The status of Capercaillie, Tetrao urogallus, in the Bern Convention on the Conservation of
Scotland in the winter 2003–04. Bird Study, 54, European Wildlife and Natural Habitats, 59 pp.
145–153. Mitchell, P.I., Newton, S., Ratcliffe, N. & Dunn, T.
EC (1979) Council Directive 79/409/EEC on the (2004) Seabird populations of Britain and
conservation of wild birds ("The Birds Ireland: results of the Seabird 2000 survey. T &
Directive"). The Council of the European A.D. Poyser, London, 511 pp.
Communities, April 1979. Online at: http://eur- O’Brien, M., Green, R.E. & Wilson, J.D. (2006)
lex.europa.eu/LexUriServ/LexUriServ.do?uri=C Partial recovery of the population of corncrakes
ELEX:31979L0409:EN:HTML. Crex crex in Britain, 1993–2004. Bird Study, 53,
Erickson, W.P., Johnson, G.D., Strickland, M.D., 213–244.
Young, D.P.J., Semka, K.J. & Good, R.E. (2001) Pearce-Higgins, J.W., Stephen, L., Langston,
Avian collisions with wind turbines: a summary R.H.W. & Bright, J.A. (2008) Assessing the
of existing studies and comparisons to other cumulative impacts of wind farms on peatland
sources of avian collision mortality in the United birds: a case study of golden plover Pluvialis
States. National Wind Coordinating Committee apricaria in Scotland. Mires and Peat, 4(01), 1–
(NWCC) Resource Document, Washington DC, 13.
62 pp. Percival, S. (2005) Birds and windfarms: what are
EU (2008) Proposal for a Directive of the European the real issues? British Birds, 98, 194–204.
Parliament and of the Council on the Promotion Scottish Executive (2008) Climate Change;
and Use of Energy from Renewable Sources. Consultation on Proposals for a Scottish Climate
COM(2008) 19 final. Online at: http://ec.europa. Change Bill. The Scottish Government,
eu/energy/climate_actions/doc/2008_res_directiv Edinburgh, 85 pp. Online at: http://www.
e_en.pdf. scotland.gov.uk/Publications/2008/01/28100005/
Everaert, J. & Stienen, E.W.M. (2006) Impact of 13.
wind turbines on birds in Zeebrugge (Belgium). Sim, I.M.W., Dillon, I.A., Eaton, M.A., Etheridge,
Significant effect on breeding tern colony due to B., Lindley, P., Riley, H., Saunders, R., Sharpe,
collisions. Biodiversity and Conservation, C. & Tickner, M. (2007) Status of the Hen
16(12), 3345–3359, doi: 10.1007/s10531-006- Harrier Circus cyaneus in the UK and the Isle of
9082-1. Man in 2004, and a comparison with the 1988/89
Finney, S.K. & Jardine, D.C. (2003) The and 1998 surveys. Bird Study, 54, 256–267.
distribution and status of the Red-billed Chough Smallwood, K.S. & Thelander, C.G. (2008) Bird
in Scotland in 2002. Scottish Birds, 24, 11–17. mortality in the Altamont Pass. Journal of
Gibbons, D.W., Bainbridge, I.P., Mudge G.P., Wildlife Management, 72, 215–223.
Tharme, A.P. & Ellis, P.M. (1997) The status Stewart, G.B., Pullin, C.F. & Coles, C.F. (2007)
and distribution of the red-throated diver Gavia Poor evidence base for assessment of windfarm
stellata in Britain in 1994. Bird Study, 44, 194– impacts on birds. Environmental Conservation,
205. 34, 1–11.
Mires and Peat, Volume 4 (2008–2010), Article 07, http://www.mires-and-peat.net/, ISSN 1819-754X
© 2008 International Mire Conservation Group and International Peat Society 11J.A. Bright et al. PEATLAND WIND FARMS OVERLAP WITH SENSITIVE AREAS FOR BIRDS
Stroud, D.A., Chambers, D., Cook, S., Buxton, N., Underhill, M.C., Gittings, T., Callaghan, B.H.,
Fraser, B., Clement, P., Lewis, P., McLean, I., Kirby, J.S. & Delany, S. (1998) Status and
Baker, H. & Whitehead, S. (2001) The UK SPA distribution of breeding Common Scoters
network: its scope and content, Volume 2: Melanitta nigra nigra in Britain and Ireland in
Species accounts. JNCC, Peterborough, 438 pp. 1995. Bird Study, 45, 146–156.
Thomas, C.D., Cameron, A., Green, R.E., Bakkenes, Whyte, C., Hancock, M., Bainbridge, I. & Jackson,
M., Beaumont, L.J., Collingham, Y.C., Erasmus, D. (1995) The 1994 Black-throated Diver Gavia
B.F.N., de Siqueira, M.F., Grainger, A., Hannah, arctica survey: report to Scottish Natural
L., Hughes, L. Huntley, B., van Jaarsveld, A.S., Heritage. Royal Society for the Protection of
Midgley, G.F., Miles, L., Ortega-Huerta, M.A., Birds, Edinburgh, 11pp.
Oerson, T., Phillips, O.L. & Williams, S.E.
(2004) Extinction risk from climate change. Submitted 31 Mar 2008, revision 28 Oct 2008
Nature, 427, 145–148. Editor: Olivia Bragg
_______________________________________________________________________________________
Author for correspondence:
Dr Jenny Bright, RSPB, The Lodge, Sandy, Bedfordshire, SG19 2DL, UK
Tel: +44(0)1767 680 551; Fax: +44(0)1767 692 365; E-mail: Jenny.Bright@rspb.org.uk
Mires and Peat, Volume 4 (2008–2010), Article 07, http://www.mires-and-peat.net/, ISSN 1819-754X
© 2008 International Mire Conservation Group and International Peat Society 12You can also read