Environmental DNA detection of snakehead species (Channa spp.) in the Barron River catchment, north Queensland Report
←
→
Page content transcription
If your browser does not render page correctly, please read the page content below
Environmental DNA detection of snakehead
 species (Channa spp.) in the Barron River
            catchment, north Queensland

                                              Report

             Cecilia Villacorta-Rath and Damien Burrows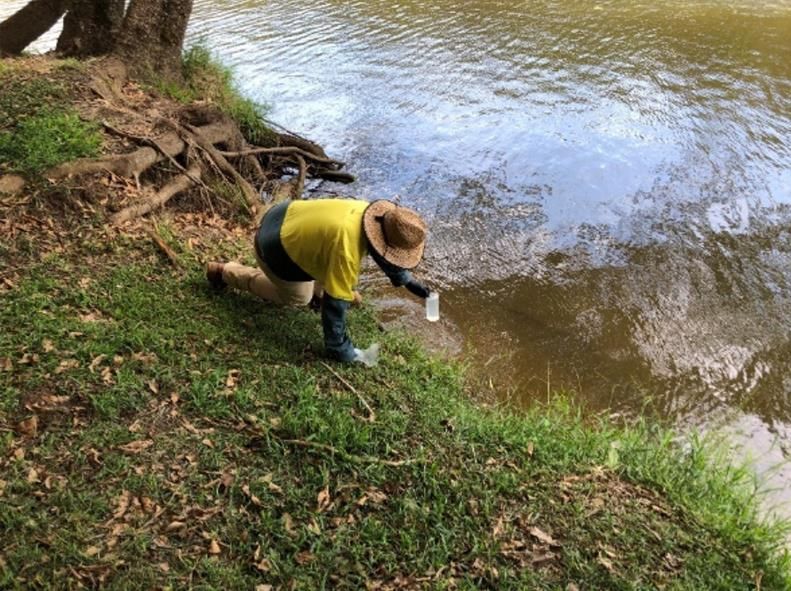
© James Cook University, 2021

               Environmental DNA detection of snakehead species (Channa spp.) in the Barron River catchment,
north Queensland is licensed by the James Cook University for use under a Creative Commons Attribution 4.0
Australia licence. For licence conditions see creativecommons.org/licenses/by/4.0

This report should be cited as:

Villacorta-Rath, C., & Burrows, D. 2021. Environmental DNA detection of snakehead species (Channa spp.) in the
Barron River catchment, north Queensland. Report 21/19, Centre for Tropical Water and Aquatic Ecosystem
Research (TropWATER), James Cook University, Townsville.

Front cover photographs: eDNA sampling in the Barron River catchment, north Queensland (photo: Biosecurity
Queensland).

This report is available for download from the Northern Australia Environmental Resources (NAER) Hub website
at nespnorthern.edu.au

The Hub is supported through funding from the Australian Government’s National Environmental Science
Program (NESP). The NESP NAER Hub is hosted by Charles Darwin University.

ISBN: 978-1-922684-00-4

March, 2021

Printed by Uniprint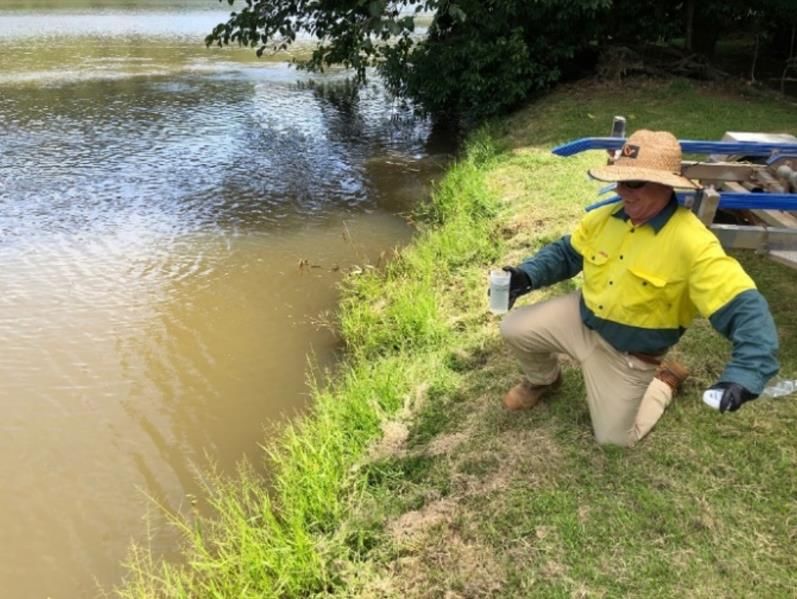
Contents
Acronyms & abbreviations ......................................................................................................... iii
Acknowledgements ....................................................................................................................iv
Executive summary .................................................................................................................... 1
1.    Introduction.......................................................................................................................... 2
2.    Methodology ........................................................................................................................ 3
     2.1     Field collection of eDNA samples ................................................................................ 3
     2.2     Environmental DNA extractions ................................................................................... 4
     2.3     Channa argus assay design ........................................................................................ 5
     2.4     Detection of species-specific eDNA by quantitative PCR (qPCR) .............................. 7
     2.5     Verification of positive detections ................................................................................ 7
3.    Results................................................................................................................................. 8
4.    Discussion ........................................................................................................................... 9
References ............................................................................................................................... 11

                 Environmental DNA detection of snakehead species (Channa spp.) in the Barron River catchment | i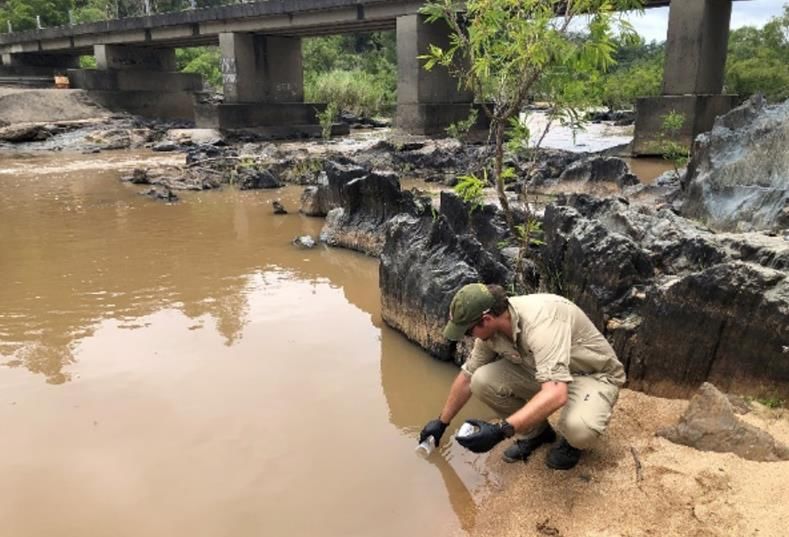
List of tables
Table 2.1. Sampling sites for the direct water collection samples in the Barron River
catchment, north Queensland. .............................................................................................. 3
Table 2.2. Primer information for C. argus eDNA assay targeting a region of the 16S rRNA
gene. ...................................................................................................................................... 6
Table 3.1. Summary of snakehead and tilapia eDNA detections in the Barron River
catchment, north Queensland. Positive eDNA detections are indicated in bold. ................ 8
List of figures
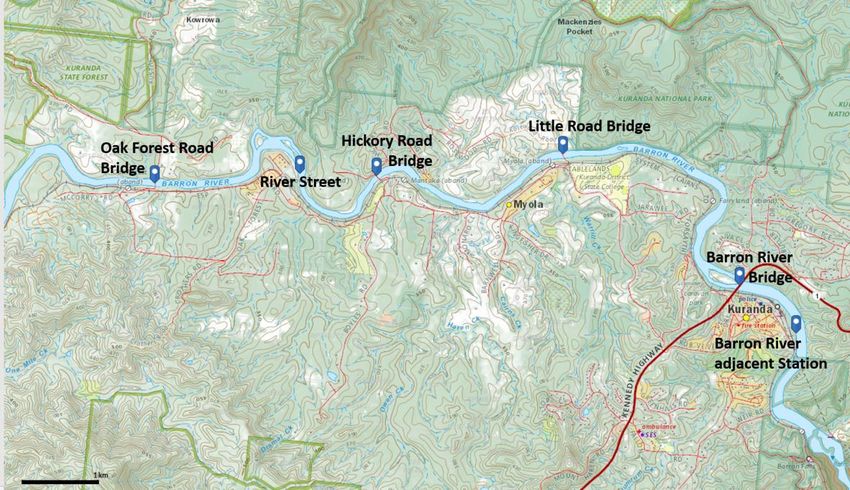
Figure 2.1. Sampling sites for the direct water collection samples in the Barron River
catchment, north Queensland. .............................................................................................. 4
Environmental DNA detection of snakehead species (Channa spp.) in the Barron River catchment | ii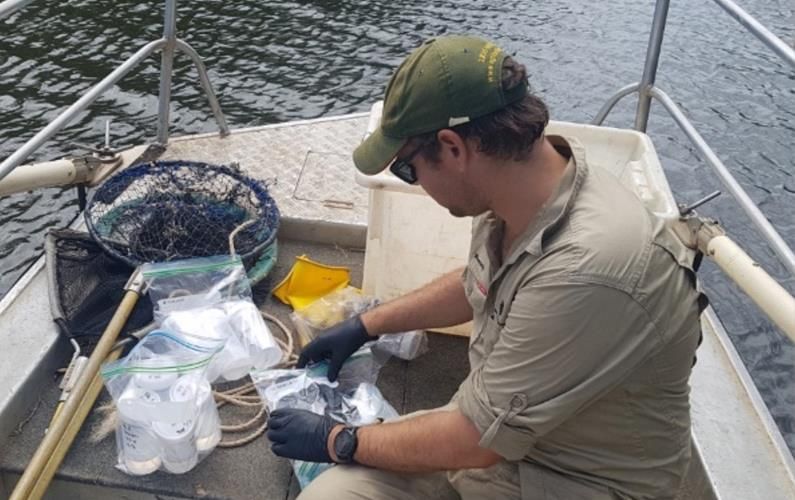
Acronyms & abbreviations
eDNA ............. environmental DNA

NESP ............... National Environmental Science Program

PCR ............... polymerase chain reaction

qPCR ............. quantitative real-time polymerase chain reaction

TropWATER ... Centre for Tropical Water and Aquatic Ecosystem Research

           Environmental DNA detection of snakehead species (Channa spp.) in the Barron River catchment | iii
Acknowledgements
We would like to thank Biosecurity Queensland and Tropical River Consulting for carrying out
the eDNA field sampling. We acknowledge the Traditional Owners of the lands and waters
where the field and laboratory work was conducted.
Environmental DNA detection of snakehead species (Channa spp.) in the Barron River catchment | ivExecutive summary
Biosecurity Queensland engaged the Centre for Tropical Water and Aquatic Ecosystem
Research (TropWATER) to conduct environmental DNA (eDNA) analysis of water samples
collected in the Barron River catchment during December 2020, following a report on
presence of snakehead (Channa spp.) from a recreational fisher. Snakeheads are a group of
predatory fish species from southeast Asia that have been introduced and become
established in a number of other countries, including the southern coastline of Papua New
Guinea. They are considered a serious threat to native aquatic biodiversity in Australia,
should they become established here. Biosecurity Queensland and Tropical River Consulting
carried out an electrofishing survey in two sections of the Barron River catchment (that failed
to detect snakeheads) and collected water samples at six sites for eDNA analysis.
Environmental DNA was extracted from water samples, purified and screened for presence
of seven invasive species using species-specific quantitative PCR (qPCR) assays targeting:
C. striata, C. asiatica, C. diplogramme, C. melasoma, C. micropeltes, C. argus and C.
maculata. Additionally, samples were screened for two other exotic tilapia species known to
be present in the Barron catchment – Tilapia mariae and Oreochromis mossambicus – as a
positive control. We found presence of tilapia eDNA at all sites, however, no snakehead
species eDNA was detected in the field samples, supporting the results of the electrofishing
survey. Based on this, we conclude that it is highly unlikely that snakeheads would be
present at the surveyed sites.
Environmental DNA detection of snakehead species (Channa spp.) in the Barron River catchment | 11. Introduction
The Australian tropics face a large number of invasive pest species that can have
destabilising effects on native communities (Shine, 2012). Preventing the spread of a pest
depends on successfully detecting them at the onset of an invasion and eradicating them
rapidly (Hulme, 2006). Over the past ten years, environmental DNA (eDNA) has been
increasingly used for detection of aquatic and semi-aquatic species of management concern
in temperate and tropical areas (Cristescu & Hebert, 2018). This technique is based on the
principle that all organisms shed genetic material into their environment via physiological
processes (Jerde et al, 2011). Capture and extraction of DNA from environmental samples
(i.e. water, soil, snow, etc.), followed by a targeted polymerase chain reaction (PCR) allows
for species detection with high confidence (Ficetola, Miaud, Pompanon, & Taberlet, 2008).
Consequently, eDNA detection could constitute an effective early warning system for
invasive species detection (Jerde et al, 2011) or could help in the assessment of eradication
programs (Rees, Maddison, Middleditch, Patmore, & Gough, 2014).
Snakehead fish, Channa spp., represent a major threat to Australian biodiversity (Hitchcock
et al, 2012). This fish is native to southeast Asia, from India to Indonesia, and invaded
southern Papua New Guinea coastal villages approximately 20 years ago (Burrows & Perna,
2009). Snakeheads are large predatory fish that can also survive without water for extended
periods and disperse via land (Lee & Ng, 1994). If these exotic fish are translocated into
mainland Queensland, they could spread through the Cape York Peninsula and threaten
native birds, reptiles and fish through competition and predation (Hitchcock et al, 2012).
During late 2020, Biosecurity Queensland received a report on presence of snakehead in the
Barron River from a recreational fisher. Biosecurity Queensland and Tropical River
Consulting carried out electrofishing activities in two sections of the Barron River catchment
to survey for invasive snakeheads. Additionally, water samples from six sites located
between the electrofishing areas were collected for eDNA analysis. Here we report the
results from eDNA sampling carried out by the Biosecurity Queensland and analysed by
TropWATER.
Environmental DNA detection of snakehead species (Channa spp.) in the Barron River catchment | 22. Methodology
2.1 Field collection of eDNA samples
Environmental DNA kits, including materials for eDNA sample collection and a field protocol,
were sent to Biosecurity Queensland prior to field collection. Field collection was carried out
by Biosecurity Queensland staff using the eDNA kits and following TropWATER’s eDNA
collection protocol. Samples were collected at six sites in the Barron River catchment (Table
2.1, Figure 2.1). At each site, five field samples and one field blank were collected. Each field
sample consisted of 300 mL of water decanted into a jar pre-loaded with 100 mL Longmire’s
preservative buffer (Longmire et al, 1997), making a final volume of 400 mL. The field blank
consisted of decanting 300 mL of laboratory-grade water into a jar containing 100 mL
Longmire’s preservative buffer.
Table 2.1. Sampling sites for the direct water collection samples in the Barron River catchment, north
Queensland.
Collection No. samples
Site Latitude Longitude
date collected
Hickory Road Bridge 16/12/2020 -16.802952° 145.589725° 5
Oak Forest Road Bridge 16/12/2020 -16.803899° 145.562478° 5
Barron River Bridge 16/12/2020 -16.815890° 145.634369° 5
Barron River adjacent Station 16/12/2020 -16.821550° 145.641310° 5
Little Road Bridge 16/12/2020 -16.800425° 145.612649° 5
River Street 18/12/2020 -16.802721° 145.580301° 5
Environmental DNA detection of snakehead species (Channa spp.) in the Barron River catchment | 3Figure 2.1. Sampling sites for the direct water collection samples in the Barron River catchment, north
Queensland.
2.2 Environmental DNA extractions
Before extraction commenced, bench top surfaces and floors in a dedicated eDNA laboratory
were decontaminated with 10% v/v bleach, as per standard operating procedure. Upon the
arrival of samples to the laboratory, each individual field sample from all sites was decanted
into five aliquots of 20 mL for eDNA extraction. Therefore, a total of 100 mL of each sample
was screened for eDNA of the target species.
We followed a DNA precipitation method protocol described in Edmunds and Burrows 2020.
Briefly, we added 20 mL isopropanol, 5 mL sodium chloride 5M and 10 µL glycogen to the
20-mL aliquots of water and Longmire’s solution and incubated samples at 4°C overnight.
We then centrifuged this solution (6,750 g; 10 min; 22°C), discarded the supernatant,
dissolved the pellet in 120 µL lysis buffer (guanidinium hydrochloride and TritonX) and
pooled all five tubes from each sample together into one single tube (total of 600 µL lysis
buffer). Tubes were then frozen overnight at -20°C. Subsequently samples were thawed,
vortexed and lysed for four hours at 50°C. After sample lysis we added polyethylene glycol
(PEG) precipitation buffer and 5 µL glycogen and incubated the samples overnight at 4°C.
Finally, samples were centrifuged (20,000 g; 30 min; 22°C), the supernatant was discarded
and the pellet was washed twice with 70% ethanol before resuspending it in 100 µL elution
buffer. Subsequently, a DNA purification was performed using the DNeasy PowerClean Pro
Cleanup Kit (Qiagen). A negative extraction control was added to each batch of eDNA
extractions to ensure that no contamination was introduced during laboratory procedures
(Goldberg et al, 2016).
Environmental DNA detection of snakehead species (Channa spp.) in the Barron River catchment | 42.3 Channa argus assay design
An eDNA assay targeting a fragment of the 16S ribosomal RNA (rRNA) gene of Channa
argus was developed. A total of seven C. argus 16S rRNA sequences were downloaded
from the NCBI GenBank® database using the Geneious Prime software (v. 2020.02).
Channa argus sequences were aligned using the MUSCLE algorithm on Geneious Prime to
generate a consensus sequence. Additionally, sequences of Australian fish, following
Edmunds & Burrows (2019a), were downloaded and aligned to the C. argus consensus
sequence. Aligned sequences were visually inspected and candidate forward and reverse
primer regions were selected based on: (1) ≥ 4 base pair (bp) mismatches with C. argus; (2)
≥ 2 bp mismatches in the 3’ end region of each primer; (3) melting temperature (Tm): 60 –
64˚C with < 4˚C difference between primer pair; (4) GC content: 35-65%; (5) amplicon size:
80 – 350 bp; (6) self-dimer Tm < 30°C; (7) hairpin Tm < 30°C; (8) overall self-complementarity
< 8; and (9) self 3’ complementarity < 8. Based on these conditions, one primer pair
candidate was identified (Table 2.2), with the targeted 16S section being:
AGCGCAATCACTTGTCTTTTAAATGAAGACCCGTATGAATGGCATAACGAGGGCTTAACT
GTCTCCTTTTTCAAGTCAATGAAATTGATCTCCCCGTGCAGAAGCGAGGATAACAACATA
AGACGAGAAGACCCTATGGAGCTTTAGACACCAGAGTAGCCCTTGTCAAACACCCCCA
GTAAAAGGGCAAAACCAAAAGGACCCTA.
In-silico validation of the selected primer pair consisted of assessing the cross-amplification
using the NCBI Primer-BLAST tool. Five species of the Channa genus were identified as
potentially amplified by the selected primer: C. argus, C. striata, C. micropeltes, C. maculata
and C. asiatica. Additionally, three non co-occuring fish species were amplified by the
selected primer pair: Symphodus ocellatus, Parazanclistius hutchinsi and Lepisosteus
osseus.
The limit of detection (LOD) of the developed assay was estimated using a 12-fold serial
dilution of double-stranded synthetic DNA fragments (gBlocksTM Integrated DNA
Technologies Pty Ltd, New South Wales, Australia) synthesized to match the target
fragment. Dilutions ranged from 1.8 x 10 7 to 1.8 x 10⁻⁵ DNA copies/µL. A total of 24 technical
replicates per dilution were used, and the LOD was set at the lowest standard with 95% or
greater detection (Klymus et al, 2019). qPCR assays were run on a QuantStudio™ 5 Real-
Time PCR System (Thermo Fisher Scientific Australia Pty Ltd, Scoresby VIC) in white 384-
well plates, sealed with optical films (Thermo Fisher Scientific Australia Pty Ltd, Scoresby
VIC). Each qPCR assay consisted of 3 µL of template DNA and 7 µL of master mix (5 µL
PowerUp SYBR Green Master Mix; 0.5 µL forward primer at 10 µM; 0.5 µL reverse primer at
10 µM; 1 µL MilliQ® water). Thermal cycling conditions were as follows: initial denaturation
and activation at 95°C for 2 min then 45 cycles of 95°C for 15 secs and 65°C for 1 min. A
subsequent melt curve analysis was performed to generate dissociation curves by
transitioning from 65°C to 95°C at 0.15°C sec -1. Mean plate efficiency of the assays was
90.3%, mean slope -3.6 and R2 0.99. Based on the serial dilutions, the LOD of the assay was
estimated to be 1.8 DNA copies per reaction.
Finally, an in-vitro primer specificity was determined by attempting to amplify genomic DNA
from potentially co-occurring frogs (n = 5 species), turtles (n = 6 species) and fish (n = 31
species) within Australia, following Edmunds & Burrows (2019a). All qPCR assay reactions
and thermocycling conditions followed those of the LOD estimation.
Environmental DNA detection of snakehead species (Channa spp.) in the Barron River catchment | 5Table 2.2. Primer information for C. argus eDNA assay targeting a region of the 16S rRNA gene.
Nucleotide sequence Length GC content Self- Self 3’ Amplicon
Primer Tm (°C)
(5’ – 3’) (bp) (%) complementarity complementarity size (bp)
2111F AGCGCAATCACTTGTCTTTTAAATGAA 27 60.9 33.3 8.00 6.00
2295R TAGGGTCCTTTTGGTTTTGCCC 22 61.0 50.0 4.00 0.00 206
Environmental DNA detection of snakehead species (Channa spp.) in the Barron River catchment | 62.4 Detection of species-specific eDNA by quantitative PCR (qPCR)
All sites were screened for presence of snakeheads as well as Mozambique tilapia
(Oreochromis mossmabicus) and spotted tilapia (Tilapia mariae). Detection of each species-
specific eDNA by quantitative real-time PCR (qPCR) consisted of using three different qPCR
assays specifically designed to detect spotted and Mozambique tilapia (Edmunds and
Burrows 2019b), C. striata, C. asiatica, C. diplogramme, C. melasoma, C. micropeltes, C.
argus and C. maculata (Edmunds & Burrows 2019a; this study).
All qPCR assays were run on a QuantStudio™ 5 Real-Time PCR System (Thermo Fisher
Scientific Australia Pty Ltd, Scoresby VIC) in white 384-well plates, sealed with optical films
(Thermo Fisher Scientific Australia Pty Ltd, Scoresby VIC). Environmental DNA detection of
each species was carried out using four technical replicate of each sample and three no
template control (NTC) samples.
Environmental DNA detection each qPCR assay consisted of 6 µL of template DNA and 14
µL of master mix (10 µL PowerUp SYBR Green Master Mix; 1 µL forward primer at 10 µM; 1
µL reverse primer at 10 µM; 2 µL MilliQ® water). Thermal cycling conditions for snakeheads
detection were as follows: initial denaturation and activation at 95°C for 2 min then 45 cycles
of 95°C for 15 secs and 65°C for 1 min. A subsequent melt curve analysis was performed to
generate dissociation curves by transitioning from 65°C to 95°C at 0.15°C sec -1. Finally,
thermal cycling conditions for tilapia eDNA detection were as follows: initial denaturation and
activation at 95°C for 2 min then 45 cycles of 95°C for 15 secs and 65°C for 1 min. A
subsequent melt curve analysis was performed to generate dissociation curves by
transitioning from 60°C to 95°C at 0.15°C sec-1.
All plates were analysed with a common fluorescence threshold (0.2) using QuantStudio™
Design and Analysis Software (version 1.4.2; Thermo Fisher Scientific Australia Pty Ltd,
Scoresby VIC) before export and subsequent analyses in Microsoft Excel (version 15.41). A
field site was considered to be positive for each species detection if at least one of the total
technical qPCR replicates for that site (4 * the number of samples for each particular site)
met the following criteria: 1) amplification curve crossed florescence threshold within 40
cycles, 2) dissociation temperature within 99.7% confidence interval of each species
genomic DNA standards, 3) corresponding equipment controls, field blanks, and extraction
blanks were not contaminated.
2.5 Verification of positive detections
qPCR product of all positive detections were Sanger sequenced at the Australian Genome
Research Facility Ltd (AGRF), Brisbane, to verify that the DNA corresponded to each of the
target species.
Environmental DNA detection of snakehead species (Channa spp.) in the Barron River catchment | 73. Results
Presence of tilapia (O. mossambicus and T. mariae) was detected at all sampled sites, while
snakeheads were not detected in any of the samples at any site (Table 3.1). Positive
detections were verified by Sanger sequencing to confirm that they were true detections. All
field and extraction control samples were verified to be devoid of the target species eDNA by
qPCR. Therefore, all qPCR assays are accurate reflections of collected site-specific eDNA.
Table 3.1. Summary of snakehead and tilapia eDNA detections in the Barron River catchment, north Queensland.
Positive eDNA detections are indicated in bold.
Field samples qPCR analysis
No. No.
% positive % positive
Site Species positive positive
detections detections
detections detections
Tilapia 5 100 17 85
Hickory Road Bridge
Snakeheads 0 0 0 0
Tilapia 5 100 17 85
Oak Forest Road Bridge
Snakeheads 0 0 0 0
Tilapia 5 100 20 100
Barron River Bridge
Snakeheads 0 0 0 0
Barron River adjacent Tilapia 5 100 17 85
Station Snakeheads 0 0 0 0
Tilapia 5 100 20 100
Little Road Bridge
Snakeheads 0 0 0 0
Tilapia 5 100 17 85
River Street
Snakeheads 0 0 0 0
Environmental DNA detection of snakehead species (Channa spp.) in the Barron River catchment | 84. Discussion
Environmental DNA is a sensitive tool for monitoring species that persist at low abundances,
which is the case of early incursions of invasive species (Dejean et al, 2012; Smart et al,
2015). Following a report on presence of snakehead in the Barron River during November
2020, we screened water samples collected at six sites on the Barron River catchment for
presence of seven snakehead species: C. striata, C. asiatica, C. diplogramme, C. melasoma,
C. micropeltes, C. argus and C. maculata. As a positive control, we also screened samples
for presence of two tilapia species, which are known to exist in the sampling area. A high
percentage of samples at all sites (85–100%) were positive for tilapia eDNA; however, there
was no evidence of snakehead eDNA presence at any site.
In flowing streams, eDNA detectability not only depends on shedding rates and population
abundance of the target organism, but also on physical processes such as eDNA transport,
retention, resuspension and decay (Barnes, Turner, & Turner, 2016). Recent studies
increasingly show that eDNA transport distance and retention in a system are highly
influenced by water discharge and physical-chemical characteristics of a stream (i.e.
susbtrate type) (Shogren et al., 2017; Shogren, Tank, Egan, Bolster, & Riis, 2019).
Additionally, eDNA decay is mainly driven by the biotic (i.e. bacterial community) and abiotic
factors (e.g., temperature, pH, UV) surrounding it (Nielsen, Johnsen, Bensasson, &
Daffonchio, 2017). Studies on several taxa show that eDNA decays rapidly and can be
reliably detected up to eight days after been shed (Eichmiller, Best, & Sorensen, 2016;
Sassoubre, Yamahara, Gardner, Block, & Boehm, 2016; Villacorta-Rath et al., 2020). In
freshwater systems, eDNA degrades faster than in marine systems (reviewed by Collins et
al., 2018) and its half-life ranges between 0.7 hours (Seymour et al., 2018) and 23.9 hours
(Sansom & Sassoubre, 2017). Therefore, any positive eDNA detection found in the present
study means that the target species has likely occupied the area up to one week prior to
sample collection.
The eDNA technique is increasingly been recognised as a sensitive tool for detection of
exotic species in recently invaded areas, with equally or higher detection efficiency than
traditional techniques, including electrofishing (Blackman et al, 2020; Smart et al, 2015). This
is because traditional methods are more efficient when a species is present at moderate
abundances, which is not the case of an early incursion (Magnuson et al, 1994). Despite the
power of eDNA over traditional methods to detect species that occur at low abundance, in
some cases eDNA can also result in false negative detections (Furlan et al, 2019).
Therefore, it is crucial to determine an appropriate sampling effort in order to get reliable
eDNA results (Furlan et al, 2019). In the present study, we processed 100 mL of water from
five replicate samples at each site (total of 500 mL at each site) along the Barron River
catchment. We have previously determined that precipitating eDNA from 100 mL of water
can provide high resolution for species detection in a running stream in tropical Australia
(Villacorta‐Rath, Hoskin, Strugnell, & Burrows, in press). By using a rainforest frog as a
model species, we determined that replicate 100 mL water samples have enough power to
detect the target species eDNA 22 km downstream from the lower limit of the population’s
distribution (Villacorta‐Rath et al., in press). The sampling sites covered in the present study
were on average 2.5 km apart and extending over an approximate 12 km stretch of river,
increasing the chances of encountering snakehead eDNA if the species was present within
the survey area. Data on snakehead movement and seasonal patterns are limited, however
Environmental DNA detection of snakehead species (Channa spp.) in the Barron River catchment | 9one study focusing on C. argus found that although most fish exhibit average home ranges of
1.2 km2, some individuals can disperse over up to 18 km (Lapointe et al, 2013).
Therefore, we believe that the amount of water processed for the present study, the number
of replicate samples collected at each site, the number of sites surveyed and the distance
between them provide strong resolution to detect the target species eDNA if present at the
sampling area. Additionally, the electrofishing survey failed to detect any snakeheads at the
two river sections covered. Based on this, we can conclude that there is no snakehead
presence at the sampling sites.
Environmental DNA detection of snakehead species (Channa spp.) in the Barron River catchment | 10References
Barnes, M. A., Turner, C. R., & Turner, C. R. (2016). The ecology of environmental DNA and
implications for conservation genetics. Conservation Genetics, 17(1), 1–17.
https://doi.org/10.1007/s10592-015-0775-4
Blackman, R. C., Ling, K. K. S., Harper, L. R., Shum, P., Hänfling, B., & Lawson-Handley, L.
(2020). Environmental DNA consistently outperforms established methods for detection of
quagga mussels, Dreissena rostriformis bugensis in flowing water. BioRxiv.
Burrows, D., & Perna, C. (2009). A survey for exotic freshwater fish on Saibai Island and
Thursday Island, Torres Strait. Retrieved from
https://www.tropwater.com/publications/technical-reports/
Collins, R. A., Wangensteen, O. S., O’Gorman, E. J., Mariani, S., Sims, D. W., & Genner, M.
J. (2018). Persistence of environmental DNA in marine systems. Communications
Biology, 1(1), 1–11. https://doi.org/10.1038/s42003-018-0192-6
Cristescu, M. E., & Hebert, P. D. N. (2018). Uses and misuses of environmental DNA in
biodiversity science and conservation. Annual Review of Ecology, Evolution, and
Systematics, 49(1), 209–230. https://doi.org/10.1146/annurev-ecolsys-110617-062306
Dejean, T., Valentini, A., Miquel, C., Taberlet, P., Bellemain, E., & Miaud, C. (2012).
Improved detection of an alien invasive species through environmental DNA barcoding:
the example of the American bullfrog Lithobates catesbeianus. Journal of Applied
Ecology, 49, 953–959. https://doi.org/10.1111/j.1365-2664.2012.02171.x
Edmunds, R. C., & Burrows, D. W. (2019). Development of revised eDNA assay for tilapia
(Oreochromis mossambicus and Tilapia mariae): Technical Report. (07/19), 32. Retrieved
from https://www.tropwater.com/publications/technical-reports/
Edmunds, R. C, & Burrows, D. (2019). Development of eDNA assay for invasive Channa
striata ( snakehead murrel ). Retrieved from
https://www.tropwater.com/publications/technical-reports/
Edmunds, Richard C., & Burrows, D. W. (2020). Got glycogen?: Development and multi-
species validation of the novel Preserve, Precipitate, Lyse, Precipitate, Purify (PPLPP)
workflow for environmental DNA extraction from Longmire’s preserved water samples.
Journal of Biomolecular Techniques, 31(4), 125–150. https://doi.org/10.7171/jbt.20-3104-
003.
Eichmiller, J. J., Best, S. E., & Sorensen, P. W. (2016). Effects of temperature and trophic
state on degradation of environmental DNA in lake water. Environmental Science and
Technology, 50(4), 1859–1867. https://doi.org/10.1021/acs.est.5b05672
Ficetola, G. F., Miaud, C., Pompanon, F., & Taberlet, P. (2008). Species detection using
environmental DNA from water samples. Biology Letters, 4(4), 423–425.
https://doi.org/10.1098/rsbl.2008.0118
Furlan, E. M., Gleeson, D., Wisniewski, C., Yick, J., & Duncan, R. P. (2019). eDNA surveys
to detect species at very low densities: A case study of European carp eradication in
Environmental DNA detection of snakehead species (Channa spp.) in the Barron River catchment | 11Tasmania, Australia. Journal of Applied Ecology, 56(11), 2505–2517.
https://doi.org/10.1111/1365-2664.13485
Goldberg, C. S., Turner, C. R., Deiner, K., Klymus, K. E., Thomsen, P. F., Murphy, M. A., …
TABERLET, P. (2016). Critical considerations for the application of environmental DNA
methods to detect aquatic species. Methods in Ecology and Evolution, 7(11), 1299–1307.
https://doi.org/10.1111/2041-210X.12595
Hitchcock, G., Finn, M. A., Burrows, D. W., & Johnson, J. W. (2012). Fishes from fresh and
brackish waters of islands in Torres Strait, far north Queensland. Memoirs of the
Queensland Museum, 56(1), 13–24.
Hulme, P. E. (2006). Beyond control: Wider implications for the management of biological
invasions. Journal of Applied Ecology, 43(5), 835–847. https://doi.org/10.1111/j.1365-
2664.2006.01227.x
Jerde, C. L., Mahon, A. R., Chadderton, W. L., & Lodge, D. M. (2011). “Sight-unseen”
detection of rare aquatic species using environmental DNA. Conservation Letters, 4(2),
150–157. https://doi.org/10.1111/j.1755-263X.2010.00158.x
Lapointe, N. W. R., Odenkirk, J. S., & Angermeier, P. L. (2013). Seasonal movement,
dispersal, and home range of Northern Snakehead Channa argus (Actinopterygii,
Perciformes) in the Potomac River catchment. Hydrobiologia, 709(1), 73–87.
https://doi.org/10.1007/s10750-012-1437-x
Lee, P. G., & Ng, P. K. L. (1994). The systematics and ecology of snakeheads (Pisces:
Channidae) in Peninsular Malaysia and Singapore. Hydrobiologia, 285(1–3), 59–74.
https://doi.org/10.1007/BF00005654
Longmire, J. L., Maltbie, M., & Baker, R. J. (1997). Use of “lysis buffer” in DNA isolation and
its implication for museum collections. https://doi.org/10.5962/bhl.title.143318
Magnuson, J. J., Benson, B. J., & Mclain, A. S. (1994). Insights on species richness and
turnover from long-term ecological research: Fishes in north temperate lakes. Integrative
and Comparative Biology, 34(3), 437–451. https://doi.org/10.1093/icb/34.3.437
Nielsen, K. M., Johnsen, P. J., Bensasson, D., & Daffonchio, D. (2017). Release and
persistence of extracellular DNA in the environment. Environmental Biosafety Research,
6(2007), 37–53.
Rees, H. C., Maddison, B. C., Middleditch, D. J., Patmore, J. R. M., & Gough, K. C. (2014).
The detection of aquatic animal species using environmental DNA - a review of eDNA as
a survey tool in ecology. Journal of Applied Ecology, 51(5), 1450–1459.
https://doi.org/10.1111/1365-2664.12306
Sansom, B. J., & Sassoubre, L. M. (2017). Environmental DNA (eDNA) shedding and decay
rates to model freshwater mussel eDNA transport in a river. Environmental Science and
Technology, 51(24), 14244–14253. https://doi.org/10.1021/acs.est.7b05199
Sassoubre, L. M., Yamahara, K. M., Gardner, L. D., Block, B. A., & Boehm, A. B. (2016).
Quantification of Environmental DNA (eDNA) Shedding and Decay Rates for Three
Marine Fish. Environmental Science and Technology, 50(19), 10456–10464.
https://doi.org/10.1021/acs.est.6b03114
Environmental DNA detection of snakehead species (Channa spp.) in the Barron River catchment | 12Seymour, M., Durance, I., Cosby, B. J., Ransom-Jones, E., Deiner, K., Ormerod, S. J., …
Creer, S. (2018). Acidity promotes degradation of multi-species environmental DNA in
lotic mesocosms. Communications Biology, 1(1), 1–8. https://doi.org/10.1038/s42003-017-
0005-3
Shine, R. (2012). Invasive species as drivers of evolutionary change: Cane toads in tropical
Australia. Evolutionary Applications, 5(2), 107–116. https://doi.org/10.1111/j.1752-
4571.2011.00201.x
Shogren, A. J., Tank, J. L., Andruszkiewicz, E., Olds, B., Mahon, A. R., Jerde, C. L., &
Bolster, D. (2017). Controls on eDNA movement in streams: Transport, retention, and
resuspension. Scientific Reports, 7(1), 1–11. https://doi.org/10.1038/s41598-017-05223-1
Shogren, A. J., Tank, J. L., Egan, S. P., Bolster, D., & Riis, T. (2019). Riverine distribution of
mussel environmental DNA reflects a balance among density, transport, and removal
processes. Freshwater Biology, 64(8), 1467–1479. https://doi.org/10.1111/fwb.13319
Smart, A. S., Tingley, R., Weeks, A. R., Van Rooyen, A. R., & McCarthy, M. A. (2015).
Environmental DNA sampling is more sensitive than a traditional survey technique for
detecting an aquatic invader. Ecological Applications, 25(7), 1944–1952.
https://doi.org/10.1890/14-1751.1
Smart, Adam S., Tingley, R., Weeks, A. R., Van Rooyen, A. R., & McCarthy, M. A. (2015).
Environmental DNA sampling is more sensitive than a traditional survey technique for
detecting an aquatic invader. Ecological Applications, 25(7), 1944–1952.
https://doi.org/10.1890/14-1751.1
Villacorta-Rath, C., Adekunle, A., Edmunds, R. C., Strugnell, J. M., Schwarzkopf, L., &
Burrows, D. (2020). Can environmental DNA be used to detect first arrivals of the cane
toad, Rhinella marina, into novel locations? Environmental DNA, 2(May), 635–646.
https://doi.org/10.1002/edn3.114
Villacorta‐Rath, C., Hoskin, C. J., Strugnell, J. M., & Burrows, D. W. (2021). Long distance (>
20 km) downstream detection of endangered stream frogs suggests an important role for
eDNA in surveying for remnant amphibian populations. PeerJ.
Environmental DNA detection of snakehead species (Channa spp.) in the Barron River catchment | 13You can also read