Spectroscopic analysis of chia seeds - Nature
←
→
Page content transcription
If your browser does not render page correctly, please read the page content below
www.nature.com/scientificreports
OPEN Spectroscopic analysis of chia
seeds
1 2 2 2*
Monica Mburu , Olivier Paquet‑Durand , Bernd Hitzmann & Viktoria Zettel
Chia seeds are becoming more and more popular in modern diets. In this contribution NIR and
2D-fluorescence spectroscopy were used to determine their nutritional values, mainly fat and protein
content. 25 samples of chia seeds were analysed, whereof 9 samples were obtained from different
regions in Kenya, 16 samples were purchased in stores in Germany and originated mostly from South
America. For the purchased samples the nutritional information of the package was taken in addition
to the values obtained for fat and protein, which were determined at the Hohenheim Core Facility. For
the first time the NIR and fluorescence spectroscopy were used for the analysis of chia. For the spectral
evaluation two different pre-processing methods were tested. Baseline correction with subsequent
mean-centring lead to the best results for NIR spectra whereas SNV (standard normal variate
transformation) was sufficient for the evaluation of fluorescence spectra. When combining NIR and
fluorescence spectra, the fluorescence spectra were also multiplied with a factor to adjust the intensity
levels. The best prediction results for the evaluation of the combined spectra were obtained for
Kenyan samples with prediction errors below 0.2 g/100 g. For all other samples the absolute prediction
error was 0.51 g/100 g for fat and 0.62 g/100 g for protein. It is possible to determine the amount of
protein and fat of chia seeds by fluorescence and NIR spectroscopy. The combination of both methods
is beneficial for the predictions. Chia seeds from Kenya had similar protein and lipid contents as South
American seeds.
Chia, Salvia hispanica L., belonging to the mint family, Lamiaceae, is a two metre tall herbaceous plant, native
to Southern Mexico and Northern Guatemala1. The current research on health-promoting properties of food
has developed substantial interest in chia due to its dense nutritional composition, and the fact that chia seeds
have been consumed for medicinal purposes for thousands of years2–4. Chia seeds are being currently utilized
for food fortification in baked products5, dairy, soups and sources, fruit juices among o thers6. Chia seeds have
been related to different medicinal influences, in particular positive effects on hypertension, cardiovascular
diseases, antidiabetic and anti-inflammatory activities7. This is because chia seeds are rich in bioactive com-
ponents with health promoting properties but the composition depends on genetic components as well as the
agroecological region of g rowth8. Chia seeds are an excellent source of dietary fat (20–34%), with remarkable
levels of polyunsaturated fatty acids (up to 60% α-linolenic and 20% linoleic acids7). The seeds are rich in dietary
fibre (30–34%), with an insoluble fraction of approximately 85–93%, and a soluble dietary fibre approximately
7–15%9,10. Furthermore, chia seeds are a good source of plant protein (18–24%), with 10 exogenous amino acids,
of which the greatest contents are leucine, phenylalanine, valine, arginine and lysine11, and endogenous amino
acids, mainly glutamic and aspartic acids, glycine, serine and a lanine11,12. Chia seeds do not contain gluten and
are therefore suitable for celiac patients2. The seeds contain high amounts of B vitamins: niacin (883 mg/100 g),
folic acid (49 mg/100 g), thiamine (0.62 mg/100 g) and riboflavin (0.17 mg/100 g)13. Kulczyński et al.11 found chia
seeds to contain vitamin E as tocopherols: α-tocopherol (8 mg/kg of lipids), γ-tocopherol (422 mg/kg of lipids)
and δ-tocopherol (15 mg/kg of lipids). Additionally, chia seeds are rich in minerals, with calcium (456 mg/100 g
to 631 mg/100 g), phosphorus (860 mg/100 g to 919 mg/100 g), potassium (407 mg/100 g to 726 mg/100 g)
and magnesium (335 mg/100 g to 449 mg/100 g)14. Studies by various researchers also identified interesting
groups of high biological activity phyto-compounds15–17. These include polyphenols: chlorogenic, cinnamic,
gallic, ferulic, p-coumaric and caffeic acids, kaempferol, quercetin, rutin, epicatechin and apigenin; isoflavones,
such as glycitein, daidzein, genistin and genistein in small amounts; and sterols such as campesterol, β-sitosterol,
stigmasterol, and avenasterol.
Spectroscopy is widely spread in food characterization and c ontrol18,19. Infrared spectroscopy was for example
applied to determine the total phenolic content of rice20. NIR-FT-Raman spectroscopy was used to determine the
1
Institute of Food Bioresources Technology, Dedan Kimathi University of Technology, Private Bag, Dedan Kimathi,
Nyeri, Kenya. 2Process Analytics and Cereal Science, Institute of Food Science and Biotechnology, University of
Hohenheim, Garbenstr. 23, 70599 Stuttgart, Germany. *email: viktoria.zettel@uni-hohenheim.de
Scientific Reports | (2021) 11:9253 | https://doi.org/10.1038/s41598-021-88545-5 1
Vol.:(0123456789)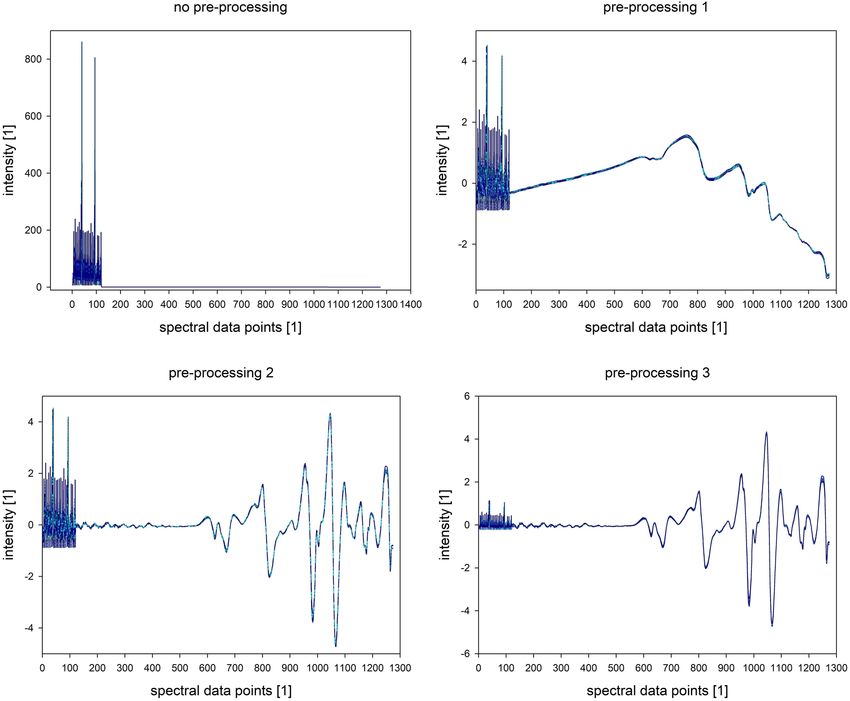
www.nature.com/scientificreports/
apparent amylose contents of milled rice with a standard error of prediction for protein of 0.138% and 1.05% for
apparent amylose. Protein in flour samples was also predicted based on near infrared r eflectance21.
Vibrational spectroscopy, infrared and Raman spectroscopy have been introduced to chia in food applica-
tions, such as chia oil emulsion gels for the production of sausages22,23. Infrared radiation is divided into far-,
medium- and near infrared. It is located between the wavelength regions of visible light as the lower and micro-
waves as the upper limit. The measuring principle is that certain molecules are excited into a higher vibrational
state, by absorbing electromagnetic radiation. The absorbed energy is then converted in different vibrations of
the C–H, O–H, S–H, or N–H groups, which are found throughout all foods. For this reason, NIR spectroscopy
is a prominent candidate for the investigation of food properties and chosen for this investigation beside fluo-
rescence spectroscopy.
Fluorescence spectroscopy is well known for its high substance-specific sensitivity and therefore well estab-
lished in biological sciences and food research24. The measuring principle is based on excitation of molecules
from ground states to higher electronic and vibrational states by absorbing a photon. As consequence fluorescence
light can be emitted when the molecule goes back to the electronic ground state. The emitted fluorescence light
has a longer wavelength than the excitation light, because the molecule in the excited electronic state relaxes
faster to the vibrational ground state than to the electronic ground state. Taking this into account the sample
can be analysed25. Different fluorophores present in food systems can therefore be measured by fluorescence
spectroscopy, such as proteins, vitamins, coenzymes and chlorophyll.
Spectroscopy is a fast and easy applicable measurement method. The time-consuming part is the calibration
procedure to obtain reliable chemometric models for the prediction for the required variables. Usually different
pre-processing methods are used to smooth the data, reduce noise and correct the baseline. Well established
methods here are: the Savitzky–Golay–Filter26 and the multiplicative scatter correction (MSC)27 as well as the
standard normal variate transformation (SNV)28. Partial least squares regression (PLSR), principal component
regression (PCR), or artificial neuronal networks (ANN) are used in most cases to correlate the spectra with
calibration data29.
In the present work, different spectroscopic methods were used to identify major classes of organic com-
pounds in chia seeds followed by chemometric evaluation of spectra taken from different chia seeds. The chia
seeds were obtained from diverse agro ecological zones of Kenya, sampled directly from the farms, and compared
with chia seeds sold in the German markets mostly originated from South America. For the first time, the nutri-
tional composition was evaluated by fluorescence and NIR spectroscopy in parallel, so that a fast determination
is possible. The study reveals essential nutritional and chemical composition that strengthens utilization of chia
seeds for human health benefits and as an important ingredient in functional food.
Materials and methods
For the study, 25 samples of chia seeds were spectroscopically examined. These include 9 samples from Kenya
(named A to I) cultivated from different sites. Chia seeds were collected from different regions of Kenya, in
accordance with the relevant institutional research policy, DeKUT RESEARCH POLICY, August 2016, and the
national guidelines LEGAL NOTICE No. 106, THE SCIENCE, TECHNOLOGY AND INNOVATION ACT,
2013 (No.28 of 2013). The rest was obtained from different local and online markets in Germany originally from
Mexico, Bolivia, Paraguay and Argentina (named J to Y, Table 1). Nutrition information according to the product
packing, vendor or the distributor is presented in Supplementary Material 1.
For samples A to I, from Kenya, this information was not available, the raw fat and protein contents were
therefore for all samples determined by the Analytical Chemistry module of the Core Facility Hohenheim. For
the Kenyan samples the fatty acid profiles were determined as well and are presented in Supplementary Material
2. The samples for spectroscopic evaluation were ground with a centrifugal mill (ZM 100, Retsch Technology
GmbH, Düsseldorf, Germany) at 6000 rpm. The seeds were frozen for at least 24 h before grinding to avoid
changes due to high temperatures.
2D-fluorescence spectra were obtained with the BioView sensor (Delta Light & Optics, Hørsholm, Denmark)
equipped with a standard port containing a quartz glass window and a xenon lamp. Spectra were obtained in a
range between 270 and 550 nm of excitation and 310 nm and 590 nm emission wavelength with 20 nm distance
steps. The resulting spectra contained in total measured intensities of 120 wavelength combinations. A five-
fold measurement was performed for each sample. The vial was briefly mixed by shaking after each spectrum
recorded.
NIR spectroscopy measurements were performed in the Multi-Purpose NIR Analyzer (Bruker Optik GmbH,
Ettlingen, Germany), varying wavelengths from 800 to 2800 nm (wavenumbers from 3599 to 12,489 cm−1). The
flour samples are filled into suitable vials and placed on the reflection position of the NIR spectroscope. A fivefold
measurement is performed for each sample. The vial is briefly mixed by shaking after each spectrum recorded.
The evaluation of the spectra was performed with Matlab R2019a (version 9.6). The evaluation was performed
for all purchased samples (dataset DS 1), all Kenyan samples (dataset DS 2) and all samples together (dataset
DS 3).
The NIR and fluorescence spectra were evaluated individually and also together as a combination dataset.
The spectra were pre-processed with different methods to extract the desired information. For pre-processing
variant 1 (PP1) standard normal variate transformation (SNV) was performed. For pre-processing variant 2
(PP2) a baseline correction was performed by removing the low frequency parts of the spectra. This was done
by smoothening the first derivate of the spectra with a moving average filter (window width: number of points
in spectrum divided by 20), then integrating the smoothened first derivate and subsequently subtracting it from
the original spectrum. This was applied prior to SNV to NIR spectra. For pre-processing variant 3 (PP3) the
fluorescence spectra were additionally multiplied with a factor of 0.25 for scaling.
Scientific Reports | (2021) 11:9253 | https://doi.org/10.1038/s41598-021-88545-5 2
Vol:.(1234567890)www.nature.com/scientificreports/
label Origin Fat (g/(00 g) Protein (g/100 g)
A Mwea South Ngariama 24.7 31.5
B Laikipia Makutano 23.4 33.0
C Thika 19.7 35.8
D Embu 24.4 31.5
E Nyeri Thunguma 22.7 32.6
F Nyeri Matunda 20.4 34.0
G Kitale Matunda 18.4 35.0
H Kivaa 24.4 31.8
I Kirinyaga 20.6 34.9
J Bolivia 20.7 34.5
K ParaquayParaguay 21.1 33.4
L Mexico 25.3 30.1
M unknown 21.7 32.6
N ParaquayParaguay 24.9 31.7
O Bolivia 21.3 33.1
P Bolivia, ParaquayParaguay 20.7 33.5
Q Argentinia 20.0 33.6
R ParaquayParaguay 18.7 32.4
S Bolivia 20.2 33.4
T unknown 24.9 31.7
U ParaquayParaguay 21.8 32.7
V Boliviaen 23.2 32.5
W ParaquayParaguay 20.6 35.3
X ParaquayParaguay 19.7 33.2
Y unknown 22 32.8
Table 1. Information about growing region and determined values for fat and protein of African (A-I) and
purchased (J-Z) chia seeds. Single determinations performed by the Analytical Chemistry module of the Core
Facility Hohenheim.
Where no measurement values for a particular variable were available, the samples were ignored/left out
before applying the Principal Component Analysis (PCA) and Partial Least Squares Regression (PLSR). A PCA
with 10 principal components was performed. The offline values were then correlated with each of these first 10
principal components subsequently to check whether there are correlations in the datasets to the target values
(fat and protein content). The datasets were used for PCA and PLSR evaluations. 1 up to 32 principal components
were tested for the PLSR model. For all datasets, single and combined spectra, a cross-validations (CV)30 were
carried out and the coefficient of determination R2 and the root mean square error of prediction RMSEP (absolute
error) were calculated. Furthermore, the RMSEP was calculated with respect to the range of the sample values
and is named RMSEPrange (percentage error).
Results and discussion
Chia seeds from Kenya have similar contents of fat and protein (compare Table 1; Supplementary Material 1) as
the South American seeds. Table 1 shows single determinations of protein and fat contents, they range between
18.4–24.7% for fat and 31.5–35.8% for protein for the Kenyan samples which is within the range of the deter-
mined values for the ones of Middle and South America. The fatty acid composition is also in the range of the
sample from Bolivia, which additional was evaluated as reference (compare Supplementary Material 2). It was
expected that the spectra will show similar results. Representative NIR and fluorescence spectra of chia seeds
are presented in Figs. 1 and 2, respectively. Sample N is the only sample with white surface of the seeds. There
are already differences visible, but they might be due to the inhomogeneous surfaces for both measurement
methods. Three different variants of pre-processing were tested. A simple SNV transformation was performed
first, so that the spectral data are not too much modified. The results were not satisfying, so that two other pre-
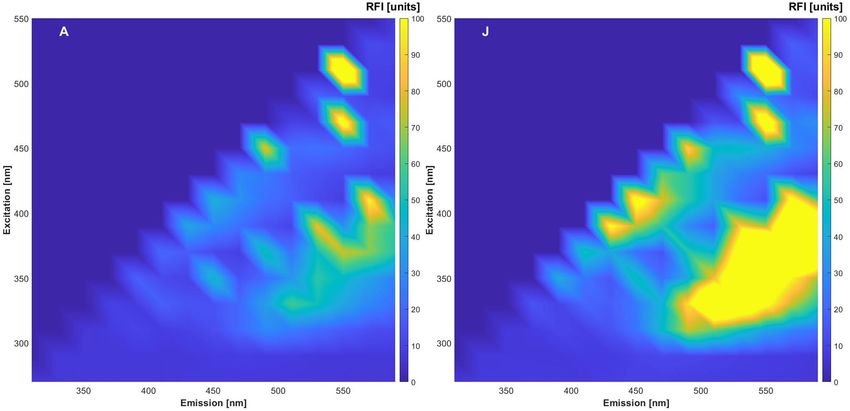
processing methods were tested. Raw and pre-processed (all variants) combined fluorescence and NIR spectra
are presented in Fig. 3.
The best correlation results of the principal components of the fluorescence or NIR spectra respectively with
the measured data are presented in Table 2. Using only fluorescence spectra, coefficients of determination of less
than 0.5 were obtained. For evaluated fluorescence spectra with data set DS3 the best results were obtained with
no pre-processing with R2 = 0.27 for fat and R2 = 0.34 for protein, for data set DS1 and DS2 the results were worse.
So, no obvious correlation between fat or protein content and the fluorescence data could be found.
As NIR spectroscopy is well established for protein and fat determination in food, the coefficients of determi-
nation were better here. For NIR PP2 lead to best results for DS1 with R 2 = 0.72 for fat and R
2 = 0.6 for protein. For
DS2 and DS3 there were still correlations possible with PP2. Applying a baseline correction to the NIR spectra
Scientific Reports | (2021) 11:9253 | https://doi.org/10.1038/s41598-021-88545-5 3
Vol.:(0123456789)www.nature.com/scientificreports/
Figure 1. Representative NIR spectra (mean of 5) of three samples before evaluation.
Figure 2. Representative fluorescence spectra (mean of 5) of two samples before evaluation.
lead therefore to a small improvement of the results compared to PP1 where only a SNV was performed. As
expected, the correlations for combined spectra are worse than the solely NIR, but better as the solely fluorescence
spectra correlations. The PCA proofed that correlations can be found. The best results of the cross-validated
PLSR models are presented in Table 3.
The evaluation of only fluorescence and combined spectra obtained best results for the PLSR prediction
with PP1 for fat and protein for DS1. For DS2 PP1 was found to be the best pre-processing method for solely
fluorescence and NIR evaluations too, but the results were improved by combining fluorescence and NIR spec-
tra. For fat PP1 remained to be the best ( R2 = 0.92), but for protein PP3 was found to be best (R2 = 0.97). The
Scientific Reports | (2021) 11:9253 | https://doi.org/10.1038/s41598-021-88545-5 4
Vol:.(1234567890)www.nature.com/scientificreports/
Figure 3. Not and pre-processed spectra of fluorescence (point 1–120) and NIR (121 up) measurements.
combined evaluation improved the results for DS3 too compared to the poor single evaluations of fluorescence
spectra which achieved only R2 of 0.61 for fat and 0.72 for protein with PP1 and R2 for fat ( R2 = 0.82) and protein
(R2 = 0.88) by NIR by PP2. The combination resulted in R 2 of 0.85 for fat (PP3) and 0.91 for protein (PP1). The
best PLSR prediction results for the determined fat and protein contents are depicted in Fig. 4. Taking the given
nutritional values of the manufacturers/vendors of the chia seeds into account the best prediction results were
obtained for saturated fatty acids and dietary fibre ( R2 = 0.97) for combined spectra as presented in Table 4.
Individual spectra evaluation for fluorescence lead to good results R 2 > 0.9 for energy (kcal), fat and saturated
2
fatty acids whereas for NIR lead to R > 0.8 for dietary fibre and protein. The nutritional values given by the
distributors are average values, which are not determined and changed for every charge, so it is comprehensible,
that the prediction results are worse compared to the values determined for the other samples.
It was proven that the prediction of nutritional values for Chia seeds is possible by fluorescence and NIR
spectroscopy, and the combination of both methods improved the results. However, increasing the range of
nutrient diversity or selecting samples with higher variation could improve the prediction results.
Scientific Reports | (2021) 11:9253 | https://doi.org/10.1038/s41598-021-88545-5 5
Vol.:(0123456789)www.nature.com/scientificreports/
noPP PP1 PP2 PP3
Fat Protein Fat Protein Fat Protein Fat Protein
Kenyan samples (DS1)
Fluorescence
PC1-2 0.02 0.06 0.26 0.19 0.26 0.19
PC1-7 0.03 0.00 0.28 0.27 0.28 0.27
NIR
PC1-1 0.14 0.33 0.16 0.15 0.72 0.60
PC1-2 0.14 0.09 0.68 0.59 0.15 0.15
Combined spectra
PC1-1 0.01 0.04 0.09 0.04 0.12 0.06 0.71 0.55
PC1-7 0.03 0.00 0.31 0.27 0.07 0.05 0.08 0.10
Purchased samples (DS2)
Fluorescence
PC1-3 0.15 0.00 0.15 0.13 0.15 0.13
PC1-8 0.25 0.18 0.43 0.35 0.43 0.35
NIR
PC1-2 0.14 0.09 0.04 0.00 0.51 0.12
PC1-5 0.23 0.02 0.27 0.18 0.15 0.42
Combined spectra
PC1-1 0.01 0.04 0.13 0.31 0.08 0.06 0.08 0.19
PC1-2 0.02 0.06 0.02 0.00 0.02 0.03 0.50 0.13
All samples (DS3)
Fluorescence
PC1-9 0.13 0.34 0.07 0.01 0.07 0.01
PC1-10 0.27 0.11 0.18 0.10 0.18 0.10
NIR
PC1-2 0.17 0.14 0.01 0.03 0.64 0.32
PC1-3 0.03 0.02 0.53 0.32 0.02 0.23
Combined spectra
PC1-2 0.00 0.01 0.06 0.16 0.02 0.01 0.64 0.32
PC1-6 0.00 0.00 0.08 0.18 0.48 0.44 0.01 0.00
Table 2. Two best correlation results of the PCA for no and pre-processing methods for the single and
combined spectra as well as all datasets (DS). R2 is the coefficient of determination, RMSEP is the absolute
root mean squared error of prediction, RMSEPrange is the percentage error. PP indicates pre-processing, PP1:
SNV, PP2: SNV and baseline correction, PP3: SNV, baseline correction and reducing factor for fluorescence
spectra. PP is for pre-processing.
Conclusion
The presented results show that combined evaluation of NIR and fluorescence spectra is suitable to predict nutri-
tional values of chia seeds. The best prediction results were, as expected, obtained for fat and protein with com-
bined spectra. The RMSEP for fat was 0.51 g/100 g and for protein was 0.62 g/100 g (8.98% and 9% respectively
calculated with respect to the sample range) for all samples. For Kenyan samples only, the best prediction errors
were 0.13 g/100 g for fat and 0.19 g/100 g for protein (2.99% and 2.97% respectively calculated with respect to
the sample range). For only purchased samples the errors were 0.32 g/100 g for fat and protein (6.13% calculated
with respect to the sample range). For the nutritional values given by the distributors of the purchased chia seeds,
the prediction results for fat, thereof saturated fatty acids and protein were the best with prediction errors below
0.7 g/100 g (calculated with respect to the sample range below 10%), which is found to be good compared to the
other values. Further studies are necessary to improve the prediction qualities. It is expected that if the range of
nutritional and chemical composition of the samples would be increased, the prediction error will be reduced.
Furthermore, alternative pre-processing and evaluation methods might lead to better results too. However, due
to the fast determination of the nutritional and chemical composition of the samples using the spectroscopic
method, it is a promising alternative to the current standard methods.
Scientific Reports | (2021) 11:9253 | https://doi.org/10.1038/s41598-021-88545-5 6
Vol:.(1234567890)www.nature.com/scientificreports/
Fluorescence NIR Combined spectra
noPP PP1 noPP PP1 PP2 noPP PP1 PP2 PP3
Kenyan samples (DS1)DS1
Fat
R2 0.97 0.99 0.97 0.97 0.94 0.97 0.99 0.99 0.94
RMSEP (g) 0.27 0.12 0.27 0.25 0.38 0.27 0.13 0.15 0.38
RMSEPrange (%) 6.19 2.74 6.18 5.90 8.87 6.19 2.99 3.59 8.87
Protein
R2 0.97 1.00 0.94 0.93 0.93 0.97 0.99 0.99 0.93
RMSEP (g) 0.37 0.15 0.55 0.59 0.59 0.37 0.19 0.25 0.59
RMSEPrange (%) 5.91 2.39 8.67 9.31 9.27 5.92 2.97 4.02 9.27
Purchased samples (DS2)DS2
Fat
R2 0.78 0.83 0.81 0.76 0.76 0.79 0.92 0.92 0.87
RMSEP (g) 0.56 0.48 0.50 0.57 0.56 0.55 0.32 0.33 0.42
RMSEPrange (%) 10.81 9.15 9.61 10.87 10.76 10.51 6.13 6.27 8.12
Protein
R2 0.78 0.83 0.81 0.76 0.76 0.79 0.92 0.92 0.87
RMSEP (g) 0.56 0.48 0.50 0.57 0.56 0.55 0.32 0.33 0.42
RMSEPrange (%) 10.81 9.15 9.61 10.87 10.76 10.51 6.13 6.27 8.12
All samples (DS3)DS3
Fat
R2 0.52 0.61 0.82 0.82 0.82 0.53 0.82 0.83 0.85
RMSEP (g) 0.95 0.87 0.56 0.57 0.56 0.95 0.58 0.54 0.51
RMSEPrange (%) 16.67 15.35 9.82 9.96 9.78 16.63 10.19 9.51 8.98
Protein
R2 0.61 0.72 0.87 0.87 0.88 0.62 0.91 0.89 0.90
RMSEP (g) 1.30 1.15 0.73 0.73 0.70 1.29 0.62 0.67 0.63
RMSEPrange (%) 18.75 16.60 10.54 10.58 10.18 18.65 9.00 9.71 9.11
Table 3. Results of the PLSR model prediction of fat and protein of chia seeds with single and combined
spectra of fluorescence and NIR with no and the three pre-processing variations and all three datasets (DS). R2
is the coefficient of determination, RMSEP is the absolute root mean squared error of prediction, R
MSEPrange
is the percentage error. PP indicates pre-processing, PP1: SNV, PP2: SNV and baseline correction, PP3: SNV,
baseline correction and reducing factor for fluorescence spectra. PP is for pre-processing.
Figure 4. Prediction of fat and protein contents from not and pre-processed spectra of fluorescence (point
1–120) and NIR (121 up) measurements.
Scientific Reports | (2021) 11:9253 | https://doi.org/10.1038/s41598-021-88545-5 7
Vol.:(0123456789)www.nature.com/scientificreports/
Energy fat Saturated fatty acids Carbohydrates Dietary fibre Protein
noPP combined spectra
R2 0.67 0.92 0.97 0.79 0.82 0.88
RMSEP 169 kJ 0.49 g 0.26 g 4.83 g 1.63 g 0.44 g
RMSEPrange (%) 16 8.08 3.81 12.87 15.22 8.97
PP1 combined spectra
R2 0.74 0.91 0.94 0.89 0.97 0.93
RMSEP 139 kJ 0.52 g 0.38 g 3.52 g 0.65 g 0.34 g
RMSEPrange (%) 13 8.51 5.49 9.38 6.07 6.87
PP2 combined spectra
R2 0.80 0.89 0.86 0.78 0.95 0.85
RMSEP 116 kJ 0.56 g 0.59 g 4.82 g 0.80 g 0.48 g
RMSEPrange (%) 11 9.11 8.59 12.86 7.52 9.79
PP3 combined spectra
R2 0.81 0.87 0.69 0.70 0.93 0.73
RMSEP 115 kJ 0.59 g 0.87 g 5.69 g 0.96 g 0.63 g
RMSEPrange (%) 11 9.69 12.64 15.16 8.98 12.87
noPP fluorescence
R2 0.66 0.92 0.97 0.79 0.81 0.88
RMSEP 170 kJ 0.49 g 0.26 g 4.91 g 1.65 g 0.44 g
RMSEPrange (%) 16 8.10 3.80 13.09 15.44 9.01
PP1 fluorescence
R2 0.59 0.83 0.92 0.70 0.70 0.86
RMSEP 179 kJ 0.68 g 0.46 g 6.32 g 2.42 g 0.48 g
RMSEPrange (%) 17 11.21 6.61 16.85 22.63 9.87
PP2 fluorescence
R2 0.59 0.83 0.92 0.70 0.70 0.86
RMSEP 179 kJ 0.68 g 0.46 g 6.32 g 2.42 g 0.48 g
RMSEPrange (%) 17 11.21 6.61 16.85 22.63 9.87
noPP NIR
R2 0.55 0.53 0.69 0.62 0.82 0.82
RMSEP 177 kJ 1.15 g 0.87 g 6.36 g 1.58 g 0.52 g
RMSEPrange (%) 17 18.81 12.67 16.95 14.74 10.52
PP1 NIR
R2 0.59 0.55 0.68 0.56 0.85 0.78
RMSEP 168 kJ 1.12 g 0.88 g 6.89 g 1.41 g 0.57 g
RMSEPrange (%) 16 18.32 12.82 18.37 13.22 11.58
PP2 NIR
R2 0.37 0.20 0.39 0.40 0.79 0.46
RMSEP 211 kJ 1.57 g 1.26 g 8.06 g 1.69 g 0.90 g
RMSEPrange (%) 20 25.69 18.25 21.51 15.75 18.45
Table 4. Best PLSR prediction results for purchased samples (I-Y, DS1) with the given nutritional values by
the manufacturers. R2 is the coefficient of determination, RMSEP is the absolute root mean squared error
of prediction, RMSEPrange is the percentage error. PP is indicatesfor pre-processing, PP1: SNV, PP2: SNV
and baseline correction, PP3: SNV, baseline correction and reducing factor for fluorescence spectra. Best
coefficients of determination of the evaluation per data sets are presented in bold.
Received: 25 August 2020; Accepted: 13 April 2021
References
1. Jamboonsri, W. et al. Extending the range of an ancient crop, Salvia hispanica L.—a new ω3 source. Genet. Resour. Crop Evol. 59,
171–178. https://doi.org/10.1007/s10722-011-9673-x (2012).
2. Muñoz, L. A. et al. Chia seed (Salvia hispanica): An ancient grain and a new functional food. Food Rev. Intl. 29, 394–408. https://
doi.org/10.1080/87559129.2013.818014 (2013).
3. Cahill, J. P. Ethnobotany of Chia, Salvia hispanica L. (Lamiaceae). Econ. Bot. 57, 604–618. https://d
oi.o
rg/1 0.1 663/0 013-0 001(2003)
057[0604:EOCSHL]2.0.CO;2 (2003).
4. Coates, W. Whole and ground chia (Salvia hispanica L) seeds, chia oil—effects on plasma lipids and fatty acids. Nuts Seeds Health
Dis. Prev. https://doi.org/10.1016/B978-0-12-375688-6.10037-4 (2011).
Scientific Reports | (2021) 11:9253 | https://doi.org/10.1038/s41598-021-88545-5 8
Vol:.(1234567890)www.nature.com/scientificreports/
5. Guiotto, E. N., Tomás, M. C. & Haros, C. M. Development of highly nutritional breads with by-products of chia (Salvia hispanica
L.) seeds. Foods https://doi.org/10.3390/foods9060819 (2020).
6. Zettel, V. & Hitzmann, B. Applications of chia (Salvia hispanica L.) in food products. Trends Food Sci. Technol. 80, 43–50. https://
doi.org/10.1016/j.tifs.2018.07.011 (2018).
7. Melo, D., Machado, T. B. & Oliveira, M. B. P. P. Chia seeds: An ancient grain trending in modern human diets. Food Funct 10,
3068–3089. https://doi.org/10.1039/C9FO00239A (2019).
8. Ayerza, R. & Coates, W. Protein content, oil content and fatty acid profiles as potential criteria to determine the origin of com-
mercially grown chia (Salvia hispanica L.). Ind. Crops Prod. 34, 1366–1371. https://doi.org/10.1016/j.indcrop.2010.12.007 (2011).
9. Marineli, Rd. S. et al. Chemical characterization and antioxidant potential of Chilean chia seeds and oil (Salvia hispanica L.). LWT
Food Sci. Technol. 59, 1304–1310. https://doi.org/10.1016/j.lwt.2014.04.014 (2014).
10. Reyes-Caudillo, E., Tecante, A. & Valdivia-López, M. A. Dietary fibre content and antioxidant activity of phenolic compounds
present in Mexican chia (Salvia hispanica L.) seeds. Food Chem. 107, 656–663. https://doi.org/10.1016/j.foodchem.2007.08.062
(2008).
11. Kulczyński, B. et al. The chemical composition and nutritional value of chia seeds-current state of knowledge. Nutrients https://
doi.org/10.3390/nu11061242 (2019).
12. Nitrayová, S. et al. Amino acids and fatty acids profile of chia (Salvia hispanica L.) and flax (Linum usitatissimum L.) seed. Potr
https://doi.org/10.5219/332 (2014).
13. Olivos-Lugo, B. L., Valdivia-López, M. Á. & Tecante, A. Thermal and physicochemical properties and nutritional value of the
protein fraction of Mexican chia seed (Salvia hispanica L.). Food Sci. Technol. Int. 16, 89–96. https://doi.org/10.1177/1082013209
353087 (2010).
14. Jin, F. et al. Supplementation of milled chia seeds increases plasma ALA and EPA in postmenopausal women. Plant Foods Hum.
Nutr. 67, 105–110. https://doi.org/10.1007/s11130-012-0286-0 (2012).
15. Ciftci, O. N., Przybylski, R. & Rudzińska, M. Lipid components of flax, perilla, and chia seeds. Eur. J. Lipid Sci. Technol. 114,
794–800. https://doi.org/10.1002/ejlt.201100207 (2012).
16. Oliveira-Alves, S. C. et al. Characterization of phenolic compounds in chia (Salvia hispanica L.) seeds, fiber flour and oil. Food
Chem. 232, 295–305. https://doi.org/10.1016/j.foodchem.2017.04.002 (2017).
17. Rahman, M. J., de Camargo, A. C. & Shahidi, F. Phenolic and polyphenolic profiles of chia seeds and their in vitro biological
activities. J. Funct. Foods 35, 622–634. https://doi.org/10.1016/j.jff.2017.06.044 (2017).
18. Nawrocka, A. & Lamorsk, J. Determination of food quality by using spectroscopic methods. In Advances in Agrophysical Research:
Dilfuza Egamberdieva (eds Grundas, S. & Parvaiz, A.) (InTech, 2013).
19. Zettel, V. et al. Supervision of food manufacturing processes using optical process analyzers—an overview. ChemBioEng Rev. 3,
219–228. https://doi.org/10.1002/cben.201600013 (2016).
20. Jantasee, A. et al. Fourier transform infrared spectroscopy for antioxidant capacity determination in colored glutinous rice. Food
Anal. Methods 7, 389–399. https://doi.org/10.1007/s12161-013-9637-1 (2014).
21. Ranzan, C. et al. Wheat flour characterization using NIR and spectral filter based on Ant Colony Optimization. Chemom. Intell.
Lab. Syst. 132, 133–140. https://doi.org/10.1016/j.chemolab.2014.01.012 (2014).
22. Herrero, A. M. et al. Infrared spectroscopy used to determine effects of chia and olive oil incorporation strategies on lipid structure
of reduced-fat frankfurters. Food Chem. 221, 1333–1339. https://doi.org/10.1016/j.foodchem.2016.11.022 (2017).
23. Herrero, A. M. et al. Elucidation of lipid structural characteristics of chia oil emulsion gels by Raman spectroscopy and their
relationship with technological properties. Food Hydrocolloids 77, 212–219. https://doi.o rg/1 0.1 016/j.f oodhy d.2 017.0 9.0 36 (2018).
24. Stoica, P. & Moses, R. L. Introduction to Spectral Analysis (Prentice Hall, 1997).
25. Damez, J.-L., & Clerjon, S. Meat quality assessment using biophysical methods related to meat structure. 54th International Con-
gress of Meat Science and Technology (54th ICoMST), 10–15 August 2008, Cape Town, South Africa 80:132–149; 2008.https://
doi.org/10.1016/j.meatsci.2008.05.039.
26. Perkins, J. H., Tenge, B. & Honigs, D. E. Resolution enhancement using an approximate-inverse Savitzky-Golay smooth. Spectro-
chim. Acta Part B 43, 575–603. https://doi.org/10.1016/0584-8547(88)80082-X (1988).
27. Geladi, P., MacDougall, D. & Martens, H. Linearization and Scatter-Correction for Near-Infrared Reflectance Spectra of Meat.
Appl. Spectrosc. 39, 491–500 (1985).
28. Barnes, R. J., Dhanoa, M. S. & Lister, S. J. Standard normal variate transformation and de-trending of near-infrared diffuse reflec-
tance spectra. Appl. Spectrosc. 43, 772–777 (1989).
29. Faassen, S. M. & Hitzmann, B. Fluorescence spectroscopy and chemometric modeling for bioprocess monitoring. Sensors (Basel)
15, 10271–10291. https://doi.org/10.3390/s150510271 (2015).
30. Huang, L. et al. Simultaneous multi-component analysis of pork meat during bacterial spoiling process by FT-NIR evaluated with
a non-linear algorithm. Anal. Methods 4, 3816–3823. https://doi.org/10.1039/c2ay25623a (2012).
Author contributions
All authors contributed to the study conception and design. Material preparation, data collection and analysis
were performed by M.M., V.Z., B.H. and O.P.-D. The first draft of the manuscript was written by M.M. and V.Z.
and all authors commented on previous versions of the manuscript. All authors read and approved the final
manuscript.
Funding
Open Access funding enabled and organized by Projekt DEAL. This study was carried out at the Department
of Process Analytics and Cereal Science at the Institute of Food Science and Biotechnology of the University of
Hohenheim, supported by the DAAD German Academic Exchange Service under the Funding programme/-ID:
Research Stays for University Academics and Scientists, 2019 (57440915).
Competing interests
The authors declare no competing interests.
Additional information
Supplementary Information The online version contains supplementary material available at https://doi.org/
10.1038/s41598-021-88545-5.
Correspondence and requests for materials should be addressed to V.Z.
Reprints and permissions information is available at www.nature.com/reprints.
Scientific Reports | (2021) 11:9253 | https://doi.org/10.1038/s41598-021-88545-5 9
Vol.:(0123456789)www.nature.com/scientificreports/
Publisher’s note Springer Nature remains neutral with regard to jurisdictional claims in published maps and
institutional affiliations.
Open Access This article is licensed under a Creative Commons Attribution 4.0 International
License, which permits use, sharing, adaptation, distribution and reproduction in any medium or
format, as long as you give appropriate credit to the original author(s) and the source, provide a link to the
Creative Commons licence, and indicate if changes were made. The images or other third party material in this
article are included in the article’s Creative Commons licence, unless indicated otherwise in a credit line to the
material. If material is not included in the article’s Creative Commons licence and your intended use is not
permitted by statutory regulation or exceeds the permitted use, you will need to obtain permission directly from
the copyright holder. To view a copy of this licence, visit http://creativecommons.org/licenses/by/4.0/.
© The Author(s) 2021
Scientific Reports | (2021) 11:9253 | https://doi.org/10.1038/s41598-021-88545-5 10
Vol:.(1234567890)You can also read