Seed Mineral Composition and Protein Content of Faba Beans (Vicia faba L.) with Contrasting Tannin Contents
←
→
Page content transcription
If your browser does not render page correctly, please read the page content below
agronomy
Article
Seed Mineral Composition and Protein Content of
Faba Beans (Vicia faba L.) with Contrasting
Tannin Contents
Hamid Khazaei *         and Albert Vandenberg
 Department of Plant Sciences, University of Saskatchewan, Saskatoon, SK S7N 5A8, Canada;
 bert.vandenberg@usask.ca
 * Correspondence: hamid.khazaei@usask.ca; Tel.: +1-306-966-5859

 Received: 17 March 2020; Accepted: 28 March 2020; Published: 3 April 2020

 Abstract: Two-thirds of the world’s population are at risk of deficiency in one or more essential mineral
 elements. The high concentrations of essential mineral elements in pulse seeds are fundamentally
 important to human and animal nutrition. In this study, seeds of 25 genotypes of faba bean (12
 low-tannin and 13 normal-tannin genotypes) were evaluated for mineral nutrients and protein content
 in three locations in Western Canada during 2016–2017. Seed mineral concentrations were examined
 by Inductively Coupled Plasma Mass Spectrometry (ICP-MS) and the protein content was determined
 by Near-Infrared (NIR) spectroscopy. Location and year (site-year) effects were significant for all
 studied minerals, with less effect for calcium (Ca) and protein content. Genotype by environment
 interactions were found to be small for magnesium (Mg), cobalt (Co), Ca, zinc (Zn), and protein
 content. Higher seed concentrations of Ca, manganese (Mn), Mg, and cadmium (Cd) were observed
 for low-tannin genotypes compared to tannin-containing genotypes. The protein content was 1.9%
 higher in low-tannin compared to tannin-containing genotypes. The high estimated heritability for
 concentrations of seed Mg, Ca, Mn, potassium (K), sulphur (S), and protein content in this species
 suggests that genetic improvement is possible for mineral elements.

 Keywords: faba bean; biofortification; genotype by environment; heritability; white flower

1. Introduction
      Seeds of faba bean (Vicia faba L.) are a good source of protein, energy, and fiber, and the crop is widely
grown for food and feed [1]. The protein content of faba bean ranges from 24% to 35% of the seed dry
matter [2], with an average of 29% [3], making it the most protein-rich major pulse crop [4]. It is relatively
high in lysine, which is an essential amino acid in human and monogastric diets [5]. In addition to being
an excellent source of protein and starch, it contains valuable mineral micronutrients [2]. Faba bean is
used as a source of protein in human diets, as fodder and a forage crop for animals, and for its excellent
ability to fix atmospheric nitrogen. In many countries, mature faba bean seeds are cooked into a stew or
paste for human consumption, or fed directly to livestock. According to FAOSTAT [6], faba bean ranked
sixth in terms of world production, with 4.5 Mt from 2.5 Mha. In terms of global production, common
bean (Phaseolus vulgaris L.) is the largest pulse crop, followed by pea (Pisum sativum L.), chickpea (Cicer
arietinum L.), cowpea (Vigna unguiculata L. Walp.), and lentil (Lens culinaris Medik.). China is the major
producer of faba bean, followed by Ethiopia and Australia.
      Plants are known to be good sources of required dietary mineral elements for humans [7]. Mineral
malnutrition affects millions of people globally, and is one of the most serious challenges to humankind
(WHO, https://www.who.int/news-room/fact-sheets/detail/malnutrition). To address the mineral
deficiencies in human populations, genetic biofortification through plant breeding has become an

Agronomy 2020, 10, 511; doi:10.3390/agronomy10040511                            www.mdpi.com/journal/agronomy
Agronomy 2020, 10, 511 2 of 10
option as a sustainable, cost-effective, and long-term approach for improving the amount of essential
mineral elements in agricultural products [8–10]. This technique involves screening and developing
micronutrient-rich germplasm, conducting genetic studies (including magnitude of stability through
genotype × environment studies, trait heritability, and associations with important agronomic traits),
and developing molecular markers to facilitate breeding [11].
Pulses are a rich source of many micronutrients often found lacking in human diets [4,12]. Seeds
of pulse crops generally have higher concentrations of minerals (e.g., Fe, Zn, Ca, and Mg) than cereal
grains (reviewed in [12]). A handful of studies have investigated the diversity in mineral nutrients in
pulse crop species (e.g., [11,13–17]). However, little information is available regarding the micronutrient
composition of faba bean, and if available, only a few mineral elements have been studied [18–20].
Faba bean has a bright future as a protein crop that provides additional crop rotation benefits for
many areas of the world. The expansion of the use of faba bean as a nutritious plant-based protein food
ingredient requires chemical and genetic investigation into its seed mineral elements. Previous research
on faba bean has mainly focused on improving agronomic traits and reducing anti-nutritional factors,
with limited research on mineral nutritional improvement of the crop [4], particularly genotype by
environment interaction studies. Therefore, the main aim of this study was to investigate the variation
of seed mineral components and protein content of faba bean with contrasting tannin contents across
environments and years.
2. Materials and Methods
2.1. Plant Material and Growing Conditions
Twenty-five faba bean genotypes (Table 1) were grown at three locations in Manitoba and
Saskatchewan, Canada, during 2016-2017. Two locations were in Manitoba: Morden (49.12◦ N, 98.10◦ W)
and Roblin (51.23◦ N, 101.35◦ W). The third location was at Rosthern, SK (52.66◦ N, 106.33◦ W). The
combination of location/year was considered as an environment. The trials were sown in May and
harvested in September to November. The plants were grown in plot sizes of 1.2 m × 5 m in a randomized
complete block design with three replicates. Plots were harvested with combine harvesters. The soil at
these locations was brown, dark brown, and black Chernozem, respectively. The soil properties in the
0–15 cm soil profile at site locations are presented in Supplementary Materials Table S1.
Table 1. Overview of the flower color and origin of faba bean genotypes used in this study.
Genotype Flower Color Breeder/Origin
Snowbird White Limagrain, The Netherlands
CDC Snowdrop White Crop Development Centre (CDC), Canada
219-16 White Crop Development Centre (CDC), Canada
667-5 White Crop Development Centre (CDC), Canada
795-2 White Crop Development Centre (CDC), Canada
826-18 White Crop Development Centre (CDC), Canada
707-1-1 White Crop Development Centre (CDC), Canada
751-2 White Crop Development Centre (CDC), Canada
656/657-3 White Crop Development Centre (CDC), Canada
NPZ 14.7310 White Norddeutsche Pflanzenzucht (NPZ), Germany
NPZ 14.7330 White Norddeutsche Pflanzenzucht (NPZ), Germany
NPZ 14.7340 White Norddeutsche Pflanzenzucht (NPZ), Germany
CDC Fatima Spotted Crop Development Centre (CDC), Canada
Fabelle Spotted Norddeutsche Pflanzenzucht (NPZ), Germany
186-4 Spotted Crop Development Centre (CDC), Canada
551-4 Spotted Crop Development Centre (CDC), Canada
688-8 Spotted Crop Development Centre (CDC), Canada
1007-1 Spotted Crop Development Centre (CDC), Canada
700-19 Spotted Crop Development Centre (CDC), Canada
766-3 Spotted Crop Development Centre (CDC), Canada
Boxer Spotted Lantmännen SW Seed Hadmersleben, Sweden
Laura Spotted Lantmännen SW Seed Hadmersleben, Sweden
Trumpet Spotted Norddeutsche Pflanzenzucht (NPZ), Germany
Tiffany Spotted Norddeutsche Pflanzenzucht (NPZ), Germany
RLS 57301 Spotted Norddeutsche Pflanzenzucht (NPZ), GermanyAgronomy 2020, 10, 511 3 of 10
2.2. Phenotyping
Plot samples were threshed, and seed samples (∼5 g) were carefully washed with distilled water
prior to micronutrient analysis. Seeds were ground to a fine powder (1.0 mm) using a Cyclone Sample
mill (UDY Corporation, Model 3010-030, Fort Collins, Colorado, USA).
2.2.1. Analysis of Micronutrients with Microwave Digest and ICP-MS Analysis
The seed samples were analysed by weighing 0.25 g of sample; adding 2.25 mL HNO3 + 0.5 mL
HCl + 2.25 mL water; and then placing the samples in a microwave oven, increasing the temperature
to 200 ◦ C for 20 min, and holding the samples at 200 ◦ C for 15 min, according to the CEM procedure,
Microwave Digestion of Feed Grains [21].
After digestion, samples were analyzed using an ICP-MS (model: ICAP-RQ, S/N ICAPRQ00250,
Thermo Fisher Scientific (Bremen)—GmbH, Hanna-kunath-Str. 11, 28199 Bremen, Germany). We
used the Ked (Kinetic Energy Discrimination) cell mode for all analyses. The one exception to this
was the Se analysis, for which the He gas was replaced with H gas in the cell for greater interference
cancelation. The analysis was conducted after digestion using a solution of 2.25% Nitric acid and
0.5% Hydrochloric acid. We measured Lithium (7 Li), Boron (11 B), Sodium (23 Na), Magnesium (24 Mg),
Aluminum (27 Al), Phosphorus (31 P), Sulphur (34 S), Potassium (39 K), Calcium (44 Ca), Chromium (53 Cr),
Manganese (55 Mn), Iron (56 Fe), Cobalt (59 Co), Nickel (61 Ni), Copper (65 Cu), Zinc (66 Zn), Arsenic (75 As),
Selenium (78 Se), Molybdenum (98 Mo), Cadmium (114 Cd), Barium (137 Ba), Lanthanum (139 La), Mercury
(202 Hg), and Lead (208 Bb).
2.2.2. Protein Content
The seed protein content (%) was determined with an NIR sensor (DA 7440TM , Perten,
Stockholm, Sweden).
2.3. Statistical Analysis
The combination of year and location was considered as an environment (site-year). Mixed model
analysis of variance (ANOVA) was performed using the “lmer” function of the “lme4” R package (R
Development Core Team, [22]). Homogeneity and normality were checked before subjecting data to
ANOVA. The genotype was treated as a fixed effect, while the location, year, and replications nested
within site-year were considered as random effects.
The “sommer” package in R was used to determine the variance components. Genotypes,
locations, years, replicates, and their interactions were random effects employed to determine the
genetic variability. Phenotypic variance (σ2 p) was estimated as reported by Falconer and Mackay [23]:
σ2 p = σ2 g + σ2 gy/y + σ2 gl/l + σ2 gly/ly + σ2 e/lyr (1)
where σ2 g is the genotypic variance, σ2 gy is the genotype × year interaction, σ2 gl is the genotype ×
location interaction, and σ2 gyl is the genotype year × location interaction. Broad-sense heritability (H2 )
of the traits was estimated as
H2 = σ2 g/σ2 p (2)
For principal component analysis (PCA), the “prcomp” function in R was used to characterize the
associations among genotypes or mineral elements. The data were visualized using ggbiplot.
3. Results
Among the 24 analyzed elements, Li, Cr, As, La, Hg, and Bp had values of zero. High levels
of As, La, Hg, and Bp in grain pose a potential threat to human health—they are non-essential and
non-threshold carcinogens. Our results showed that faba bean seeds had generous amounts of K
(11,315 ppm), P (5118 ppm), S (1903 ppm), Mg (1334 ppm), and Ca (971 ppm). The Fe and ZnAgronomy 2020, 10, 511 4 of 10
concentrations were 51 and 42 ppm, respectively. The average mineral element and protein content
at three locations, along with the estimated heritability, genotype, environment (year and location),
and genotype × environment (G × E), are presented in Table 2. There was genetic variation in the
concentrations of all mineral elements except Al and Se.
Table 2. Concentration of faba bean seed minerals and protein content averaged ± standard deviation
(SD) across all genotypes and years along with analysis of variance.
Site/Location
Morden Roblin Rosthern S.O.V. 2
Element (ppm E
Mean ± SD Mean ± SD Mean ± SD H2 Genotype G×E
DW 1 ) (Site-Year)
B 12.32 ± 1.42 10.35 ± 0.98 11.73 ± 1.26 0.58 * *** **
Na 21.85 ± 7.38 163.74 ± 55.41 47.33 ± 22.54 0.51 *** *** ***
Mg 1478 ± 91 1232 ± 67 1292 ± 91 0.91 *** *** ns
Al 2.24 ± 0.46 1.91 ± 0.49 5.05 ± 0.91 0.35 ns *** ***
P 6055 ± 305 4961 ± 329 4339 ± 214 0.54 *** *** ***
S 1828 ± 136 1833 ± 82 2047 ± 125 0.81 *** *** ***
K 12055 ± 504 11049 ± 507 10842 ± 343 0.86 *** *** ***
Ca 1030 ± 175 955 ± 125 928 ± 157 0.90 *** ** *
Mn 13.38 ± 0.83 13.03 ± 1.02 15.87 ± 1.79 0.87 *** *** **
Fe 50.87 ± 4.09 48.57 ± 3.59 52.54 ± 3.15 0.77 *** *** ***
Co 0.438 ± 0.283 0.316 ± 0.044 0.495 ± 0.066 0.65 ** *** ns
Ni 3.55 ± 0.45 2.79 ± 0.26 3.85 ± 0.30 0.71 *** *** **
Cu 9.08 ± 0.86 8.00 ± 0.69 7.53 ± 0.51 0.31 ** *** ***
Zn 46.13 ± 3.16 33.77 ± 2.53 45.50 ± 3.09 0.52 *** *** *
Se 0.238 ± 0.036 0.169 ± 0.027 0.233 ± 0.068 0.50 ns *** ***
Mo 3.04 ± 0.72 3.70 ± 1.03 0.60 ± 0.22 0.48 ** *** ***
Cd 0.027 ± 0.012 0.006 ± 0.004 0.024 ± 0.013 0.47 *** *** ***
Ba 1.18 ± 0.27 1.16 ± 0.28 3.04 ± 0.56 0.39 *** *** **
Protein content
28.43 ± 0.56 29.68 ± 0.61 28.55 ± 0.66 0.81 *** * *
(%)
1 2
Dry weight. Source of variance. Asterisks indicate significance at * P ≤ 0·05, ** P ≤ 0·01, or *** P≤ 0·001.
ns, non-significant.
The environment was highly significant for all elements (P ≤ 0.001). The G × E interaction effect
was significant for most elements except Mg and Co. The protein, Zn, and Ca content showed very
weak significance levels (P ≤ 0.05) for G × E. The heritability was high for Mg, Ca, Mn, K, S, protein
content, and Fe; moderate for Cd, Se, Na, Zn, P, B, and Co; and low for Cu, Al, Ba, and Mo (see Table 2).
Seeds harvested from Morden were higher in Mg and P compared to the other locations, and seeds
from Roblin had a markedly high concentration of Na and low concentration of Cd. Seeds harvested
from Rosthern were rich in Al and Ba and poor in Mo.
Figure 1a–s presents the mean of elements at each location on the basis of the tannin content
(white-flowered low-tannin genotypes vs. spotted-flowered high-tannin genotypes). The Ca, Mn,
Mg, Cd, and Bd levels were higher (24.8%, 13.7%, 7.1%, 70.0%, and 27.7%, respectively—across years
and locations) in low-tannin genotypes. For the other mineral elements, no consistent trend was
found across locations between low-tannin and tannin-containing genotypes. Additionally, low-tannin
faba beans had a 1.9% higher protein content on average (Figure 1s), compared to tannin-containing
genotypes (29.14% and 28.59% for low-tannin and tannin-containing genotypes, respectively).
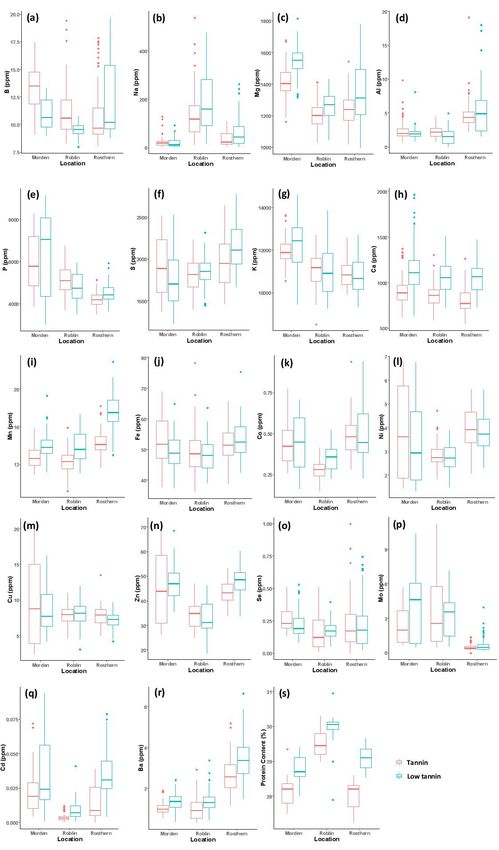
The PCA analysis was employed to illustrate relationships between mineral elements and
genotypes, and showed that the genotypes were, for the most part, arranged into two groups: the first
one includes low-tannin faba beans and the second one includes normal-tannin genotypes (Figure 2).
PCA projection demonstrated that the PC1 (principal component) and PC2 explained an overall
variability of 51%. According to the vector direction of each mineral element, those that are close
together are highly correlated, while vectors that are orthogonal are poorly correlated. The protein
content, Ca, Mg, Mn, Na, and Co were positively correlated and found to be higher in low-tannin faba
bean genotypes, while tannin-containing faba bean genotypes had higher B, Ni, and Al (Figure 2).Agronomy 2020, 10, 511 5 of 10
The Fe and Cu vectors distinguished two different sets of germplasm equality along PC1 and PC2.
Genotype NPZ 14.7340 was characterized by high concentrations of seed Zn, S, P, K, and Mo.
Agronomy 2020, 10, x FOR PEER REVIEW 6 of 11
Figure 1. Boxplots of the seed mineral concentrations and protein content averaged over locations
in ppm dry weight. Red bars are the mean of spotted-flowered high-tannin and blue bars are mean
of white-flowered zero-tannin genotypes. (a) boron; (b) sodium; (c) magnesium; (d) aluminum;
(e) phosphorus; (f) sulphur; (g) potassium; (h) calcium; (i) manganese; (j) iron; (k) cobalt; (l) nickel;
(m) copper; (n) zinc; (o) selenium; (p) molybdenum; (q) cadmium; (r) barium; (s) protein content.close together are highly correlated, while vectors that are orthogonal are poorly correlated. The
protein content, Ca, Mg, Mn, Na, and Co were positively correlated and found to be higher in low-
tannin faba bean genotypes, while tannin-containing faba bean genotypes had higher B, Ni, and Al
(Figure 2). The Fe and Cu vectors distinguished two different sets of germplasm equality along PC1
and PC2.
Agronomy Genotype
2020, 10, 511 NPZ 14.7340 was characterized by high concentrations of seed Zn, S, P, K, and
6 of 10
Mo.
NPZ 14.7330
PC2 (18.2% explained var.)
4
656/657-3 Trumpet
2 RLS 57301
751-2
Na 707-1-1 700-19
Ca Co
Boxer
688-8
Mn NPZ 14.7310
0 Snowbird795-2
Protein Al
BaCd Fabelle
Tiffany
Mg
Snowdrop Ni
766-3
186-4 Laura
219-16
826-18
Mo
1007-1
Se
B
K
Fe
Cu
-2
Zn
NPZ 14.7340 Fatima
667-5
S
P
551-4
-4
-4 -2 0 2
PC1 (32.7% explained var.)
Figure 2. The biplot illustrating the principal components (PC) analysis (PC1 and PC2) for the 25
genotypes with 18 mineral elements and protein content as vectors. Vectors that are close together are
Figure 2. in
correlated The biplot
terms illustrating
of the observedthe principal
minerals components
for each (PC)
crop over analysis
years (PC1 and
and locations. PC2) forshown
Genotypes the 25
genotypes
in with
a red color are18 mineral elementsgenotypes,
tannin-containing and proteinand
content
thoseas vectors.
shown in aVectors thatrepresent
blue color are close together are
low-tannin
correlated in terms of the observed minerals for each crop over years and locations. Genotypes shown
genotypes. var.: variation.
in a red color are tannin-containing genotypes, and those shown in a blue color represent low-tannin
4. Discussion
genotypes. var.: variation.
The genetic variation for faba bean mineral elements reported here indicates that it may be feasible
4. breed
to Discussion
for specific mineral profiles in faba bean seeds. Our results revealed that the seed mineral
concentrations
The geneticin faba bean are
variation for affected
faba bean by mineral
numerous factors, reported
elements such as environmental
here indicatesvariation, G ×be
that it may E
feasible to breed
interaction, fortannin
and the specific mineral
profile. Ourprofiles in faba are
observations bean seeds. Our
consistent withresults
resultsrevealed thatgrown
for pulses the seed
in
mineral concentrations in faba bean are affected by numerous factors, such as environmental
Saskatchewan, Canada [16], where the location, year, and their interaction effects were the predominant
variation,
sources G × E interaction,
of variance for severaland the tannin
minerals. We profile.
have shownOur observations arewhite-flowered
that low-tannin consistent withfaba
results for
beans
were rich in Ca, Mg, Fe, and Zn, which are minerals often lacking in the human diet globally. They also
had a higher protein content when compared to tannin-containing faba beans.
Seed mineral element values reported in the literature for crop species should be used with
caution—when interpreting/comparing these data, one must consider differences in the soil data,
sampling, milling, analytical protocols, and experimental screening design used. The mineral
concentrations observed for faba bean in this study can be compared to concentrations reported for
several pulse crops based on a field evaluation in Western Canada [16]. For most minerals, the content
in faba bean was generally similar to that in other pulse crops examined previously from similar
landscapes [16]. Notably, the Ca concentration was 2–3 fold higher than previously reported for
chickpea and lentil. The Mg seed concentration was 14% and 30% higher in faba bean than pea and
lentil, respectively. Furthermore, the K concentration in faba bean seeds was 9% and 18% higher than
pea and lentil, respectively. Additionally, the Cu concentration in faba bean was 34% higher compared
to pea and similar to lentil. The Fe concentration of faba bean seeds, on average, ranged from 45 to
55 ppm, similar to that observed for other pulses, but less than that reported for lentil (53–93 ppm)
grown in Western Canada [24]. In our study, the average Se concentration (0.213 ppm) was lower
compared to other pulse species (0.443, 0.732, 0.470, and 1.179 ppm for common bean, chickpea, pea,Agronomy 2020, 10, 511 7 of 10
and lentil, respectively—Ray et al. [16]). This might be due to the low Se concentration in soil at the
three locations employed in this study. The values for Fe are significantly higher than other seed or
grain crops (e.g., 7 ppm Fe in white wheat flour) and vegetables such as broccoli (10 ppm Fe) and
spinach (16 ppm Fe) [25]. In our study, the seed Zn concentration was 38–47 ppm, which is higher than
that reported for other pulse species [16,24,26].
The high estimated heritability of seed Mg, Ca, Mn, K, and S concentration and protein content in
this study indicates that good gain from selection can be expected, particularly in early generations
in faba bean breeding strategies aiming to enhance the micronutrient profile. The lower estimated
heritability for some elements and higher site–year effect can be explained by the large impact of
environmental factors on this trait (Table 2). The content of mineral elements such as Zn, Fe, and
Se in seeds is affected by both permanent and variable soil environmental factors, and the larger
variation due to G × E interactions when compared with the protein content, for example, indicates
that the inheritance of these traits may be more complex. However, multi-environment data for several
crop species, including pulses, have identified genotypes with high and stable trait expression in the
presence of high G × E interactions [10]. The seed mineral concentration is shown to be a quantitative
trait in seeds of legume species. In the case of the seed Fe concentration, 2–13 quantitative trait loci
(QTL) for common bean, 21 QTL for lentil, 4–10 QTL for chickpea, and 3–9 QTL for pea Fe concentration
have been reported. Like Fe, several QTL/genes for the Zn concentration (3–13 QTL in common bean,
5–10 in chickpea, and 4–6 QTL in pea) and for Se (3–44 QTL in mung bean) have been identified
(reviewed in [17]). The reported heritability estimates for the uptake of mineral elements were of an
intermediate [24,27] to high [28] magnitude. Similar to our results, heritability was found to be higher
for Ca, Mg, and, S and moderate for Fe and Zn in common bean [28]. The high heritability observed for
this species and for other species suggests that genetic improvement is possible for mineral elements.
Although faba bean is a dietary source of several minerals and protein, their bioavailability may
be affected by anti-nutritional factors, such as phytates and condensed tannins. About 65–85% of total
P is stored in crop seeds as phytate commonly referred to as phytic acid (PA, [29]). High levels of
PA in the diet can lead to a deficiency of K, Mg, Mn, Mg, Ca, Fe, Zn, and Ba [30,31]. PA has strong
binding properties with minerals, protein, and starch, thereby causing a reduction in the digestibility
and bioavailability of nutrients. Faba bean has about 1% PA of seed dry weight [32]. It has been
shown that PA is markedly reduced through numerous processing methods, such as cooking, soaking,
fermentation, and gamma-radiation (reviewed in [33,34]). Plant breeding efforts to reduce faba bean
PA are under way at the University of Saskatchewan. Our preliminary results on different sets of
faba bean genotypes showed that PA ranged from 0.98 (genotype AO1155) to 4.98 mg g dry weight
(genotype 346-10) [unpublished data]. We found no clear pattern between low- and high-tannin
genotypes. The PA was measured following [31]. Tannins, one of the main anti-nutritional factors that
limit the bioavailability of proteins and minerals, are located in the seed testa [1]. Low-tannin faba bean
genotypes are available and relatively easy to develop through breeding due to the monogenic nature
of genes (zt1 and zt2) controlling this characteristic. The reduction of tannins is associated with the
white-flower phenotype in pulses. As our results clearly revealed, the nutritional quality and protein
content of these genotypes are enhanced compared to tannin-containing genotypes (Figure 2). Similar
results were also observed by Crépon et al. [2] for faba beans grown in France. This is mainly due to the
reduction of condensed tannins (proanthocyanidins) in low-tannin genotypes. It is well-documented
that tannins interfere with the digestion of protein in monogastric animals and they can negatively
affect the absorption of several essential micronutrients [33,35,36].
One of the main current challenges for agriculture is attaining nutritional security [37], which is
intended to be a guarantee that every human being will have access to a fully nutritious diet. From
this perspective, research leading to enhancement of the content and availability of micronutrients
of underutilized staple foods of a leguminous origin, such as faba bean, is becoming a priority. The
development of nutritionally improved faba bean varieties represents a new opportunity to increase
the production and use of a crop which has not been exploited to its full potential on a global scale.Agronomy 2020, 10, 511 8 of 10
The environmental impacts of the production of specific crops in specific ecosystems represent an
increasingly important topic. Due to its value in extending crop rotations and its superior nitrogen
fixation ability, it can be expected that there will be an expansion of production of the crop in response
to the increasing demand for plant-based protein. The enhanced use of faba bean in appropriate
agricultural ecosystems will provide increased environmental, ecological, and economic benefits
through the mitigation of biotic stresses that occur when crop rotations are extended.
5. Conclusions
This study indicates a higher seed concentration for Ca, Mn, Mg, Cd, and protein content in
low-tannin faba bean genotypes compared to tannin-containing genotypes when grown in soils of
the eastern Canadian prairies. The high heritability observed for seed mineral concentrations of Mg,
Ca, Mn, K, S, and protein content suggests that genetic improvement is possible for these traits, but
the challenges of reducing anti-nutritional factors such as PA require consideration. The increased
consumption of faba bean seeds and ingredients in the human diet can provide enhanced nutritional
value, including some important mineral micronutrients.
Supplementary Materials: The following are available online at http://www.mdpi.com/2073-4395/10/4/511/s1:
Table S1: Soil analysis of samples obtained from three field locations (mg kg−1 ).
Author Contributions: Conceptualization, A.V. and H.K.; writing—original draft preparation, H.K.;
writing—review and editing, H.K. and A.V. All authors have read and agreed to the published version of
the manuscript.
Funding: This research was supported by ADF (Agriculture Development Fund, Ministry of Agriculture,
Government of Saskatchewan, Canada); the Western Grains Research Foundation, Canada; and the SPG
(Saskatchewan Pulse Growers, Saskatoon, Canada).
Acknowledgments: The authors would like to acknowledge Barry Goetz and Kundu Shudhangshu for their kind
technical support during the experiments.
Conflicts of Interest: The authors declare no conflicts of interest.
References
1. Duc, G. Faba bean (Vicia faba L.). Field Crops Res. 1997, 53, 99–109. [CrossRef]
2. Crépon, K.; Marget, P.; Peyronnet, C.; Carrouée, B.; Arese, P.; Duc, G. Nutritional value of faba bean (Vicia
faba L.) seeds for food and feed. Field Crops Res. 2010, 115, 329–339. [CrossRef]
3. Feedipedia. Faba bean (Vicia faba). 2018. Available online: https://www.feedipedia.org/node/4926 (accessed
on 21 January 2020).
4. Robinson, G.H.J.; Balk, J.; Domoney, C. Improving pulse crops as a source of protein, starch and micronutrients.
Nutr. Bull. 2019, 44, 202–215. [CrossRef] [PubMed]
5. Khazaei, H.; Subedi, M.; Nickerson, M.; Martínez-Villaluenga, C.; Frias, J.; Vandenberg, A. Seed protein of
lentils: Current status, progress, and food applications. Foods 2019, 8, 391. [CrossRef] [PubMed]
6. Food and Agriculture Organization of the United Nations. FAOSTAT. Available online: http://faostat.fao.org
(accessed on 2 March 2020).
7. Stein, A.J. Global impacts of human mineral malnutrition. Plant Soil 2010, 335, 133–154. [CrossRef]
8. Bouis, H.E.; Hotz, C.; McClafferty, B.; Meenakshi, J.V.; Pfeiffer, W.H. Biofortification: A new tool to reduce
micronutrient malnutrition. Food. Nutr. Bull. 2011, 32, S31–S40. [CrossRef]
9. Garg, M.; Sharma, N.; Sharma, S.; Kapoor, P.; Kumar, A.; Chunduri, V.; Arora, P. Biofortified crops generated
by breeding, agronomy, and transgenic approaches are improving lives of millions of people around the
world. Front. Nutr. 2018, 5, 12. [CrossRef]
10. Connorton, J.M.; Balk, J. Iron biofortification of staple crops: Lessons and challenges in plant genetics. Plant
Cell Physiol. 2019, 60, 1447–1456. [CrossRef]
11. Pfeiffer, W.H.; McClafferty, B. HarvestPlus: Breeding crops for better nutrition. Crop Sci. 2007, 47, S88–S105.
[CrossRef]
12. White, P.J.; Broadley, M.R. Biofortification of crops with seven mineral elements often lacking in human
diets–iron, zinc, copper, calcium, magnesium, selenium and iodine. New Phytol. 2009, 182, 49–84. [CrossRef]Agronomy 2020, 10, 511 9 of 10
13. Guzmán-Maldonado, S.H.; Martínez, O.; Acosta-Gallegos, J.A.; Guevara-Lara, F.; Paredes-López, O. Putative
quantitative trait loci for physical and chemical components of common bean. Crop Sci. 2003, 43, 1029–1035.
[CrossRef]
14. Grusak, M.A.; Cakmak, I. Methods to improve the crop-delivery of minerals to humans and livestock.
In Plant Nutritional Genomics; Broadley, M.R., White, P.J., Eds.; Blackwell: Oxford, UK, 2005; pp. 265–286.
15. Amarakoon, D.; Thavarajah, D.; McPhee, K.; Thavarajah, P. Iron-, zinc-, and magnesium-rich field peas
(Pisum sativum L.) with naturally low phytic acid: A potential food-based solution to global micronutrient
malnutrition. J. Food Comps. Anal. 2012, 27, 8–13. [CrossRef]
16. Ray, H.; Bett, K.; Tar’an, B.; Vandenberg, A.; Thavarajah, D.; Warkentin, T. Mineral micronutrient content of
cultivars of field pea, chickpea, common bean, and lentil grown in Saskatchewan, Canada. Crop Sci. 2014, 54,
1698–1708. [CrossRef]
17. Jha, A.B.; Warkentin, T.D. Biofortification of pulse crops: Status and future perspectives. Plants 2020, 9, 73.
[CrossRef] [PubMed]
18. Baloch, F.S.; Karaköy, T.; Demirbaş, A.; Toklu, F.; Özkan, H.; Hatipoğlu, R. Variation of some seed mineral
contents in open pollinated faba bean (Vicia faba L.) landraces from Turkey. Turk. J. Agric. Forest. 2014, 38,
591–602. [CrossRef]
19. Lombardo, S.; Pandino, G.; Pesce, G.R.; Anastasi, U.; Tuttobene, R.; Mauromicale, G. Variation in seed
mineral elements profile and yield in field bean (Vicia faba L. var. minor) genotypes. Ital. J. Agron. 2016, 11,
261–267. [CrossRef]
20. Etemadi, F.; Barker, A.V.; Hashemi, M.; Zandvakili, O.R.; Park, Y. Nutrient accumulation in faba bean
varieties. Commun. Soil Sci. Plant Anal. 2018, 49, 2064–2073. [CrossRef]
21. CEM, MARS 6TH Research Note. Microwave Digestion of Feed Grains. Available online: https://cem.com/
media/contenttype/media/literature/MetNote_MARS6_Feed_Grain_3.pdf (accessed on 30 March 2020).
22. R Core TeamR. A Language and Environment for Statistical Computing; R Foundation for Statistical Computing:
Vienna, Austria, 2019; Available online: http://www.R-project.org/ (accessed on 20 March 2020).
23. Falconer, D.S.; Mackay, T.F.C. Introduction to Quantitative Genetics, 4th ed.; Longmans Green: Harlow, UK,
1996.
24. Khazaei, H.; Podder, R.; Caron, C.T.; Kundu, S.S.; Diapari, M.; Vandenberg, A.; Bett, K.E. Marker–trait
association analysis of iron and zinc concentration in lentil (Lens culinaris Medik.) seeds. Plant Genome 2017,
10. [CrossRef]
25. Food Standards Agency (FSA). McCance and Widdowson’s the Composition of Foods, 6th ed.; Royal Society of
Chemistry: Cambridge, UK, 2002.
26. Jukanti, A.K.; Gaur, P.M.; Gowda, C.L.L.; Chibbar, R.N. Nutritional quality and health benefits of chickpea
(Cicer arietinum L.): A review. Br. J. Nutr. 2012, 108, S11–S26. [CrossRef]
27. Blair, M.W.; Astudillo, C.; Grusak, M.; Graham, R.; Beebe, S. Inheritance of seed iron and zinc content in
common bean (Phaseolus vulgaris L.). Mol. Breed. 2009, 23, 197–207. [CrossRef]
28. McClean, P.E.; Mafi Moghaddam, S.; Lopéz-Millán, A.F.; Brick, M.A.; Kelly, J.D.; Miklas, P.N.; Osorno, J.;
Porch, T.G.; Urrea, C.A.; Soltani, A.; et al. Phenotypic diversity for seed mineral concentration in North
American dry bean germplasm of Middle American ancestry. Crop Sci. 2017, 57, 3129–3144. [CrossRef]
29. Raboy, V. Accumulation and storage of phosphate and minerals. In Cellular and Molecular Biology of Plant
Seed Development; Larkins, B.A., Vasil, I.K., Eds.; Kluwer Academic Publishers: Dordrecht, The Netherlands,
1997; pp. 441–447.
30. Zhou, J.R.; Erdman, J.W., Jr. Phytic acid in health and disease. Crit. Rev. Food Sci. Nutr. 1995, 35, 495–508.
[CrossRef] [PubMed]
31. Shunmugam, A.S.K.; Bock, C.; Arganosa, G.C.; Georges, F.; Gray, G.R.; Warkentin, T.D. Accumulation of
phosphorus-containing compounds in developing seeds of low-phytate pea (Pisum sativum L.) mutants.
Plants 2015, 4, 1–26. [CrossRef] [PubMed]
32. Afinah, S.; Yazid, A.M.; Anis Shobirin, M.H.; Shuhaimi, M. Phytase: Application in food industry. Int. Food
Res. J. 2010, 17, 13–21.
33. Multari, S.; Stewart, D.; Russell, W.R. Potential of fava bean as future protein supply to partially replace meat
intake in the human diet. Compr. Rev. Food Sci. Food Saf. 2015, 14, 511–522. [CrossRef]
34. Gupta, R.K.; Gangoliya, S.S.; Singh, N.K. Reduction of phytic acid and enhancement of bioavailable
micronutrients in food grains. J. Food Sci. Technol. 2015, 52, 676–684. [CrossRef]Agronomy 2020, 10, 511 10 of 10
35. Bond, D.A. In vitro digestibility of the testa in tannin-free field beans (Vicia faba L.). J. Agric. Sci. 1976, 86,
561–566. [CrossRef]
36. Griffiths, D.W. The inhibition of digestive enzymes by extracts of field bean (Vicia faba). J. Sci. Food Agric.
1979, 30, 458–462. [CrossRef]
37. Keatinge, J.D.H.; Yang, R.-Y.; Hughes, D.A.J.; Easdown, W.J.; Holmer, R. The importance of vegetables in
ensuring both food and nutritional security in attainment of the Millennium Development Goals. Food Secur.
2011, 3, 491–501. [CrossRef]
© 2020 by the authors. Licensee MDPI, Basel, Switzerland. This article is an open access
article distributed under the terms and conditions of the Creative Commons Attribution
(CC BY) license (http://creativecommons.org/licenses/by/4.0/).You can also read