DETOUR LAKE MINE J A MODEL FOR RESPONSIBLE, VALUE-CREATING GOLD MINING IN ONTARIO
←
→
Page content transcription
If your browser does not render page correctly, please read the page content below
DETOUR LAKE MINEJ
A MODEL FOR RESPONSIBLE, VALUE-
CREATING GOLD MINING IN ONTARIO

Detour Lake Technical Report, Dec. 31, 2020
Investor Presentation |
March 31, 2021
FORWARD-LOOKING
INFORMATION                             Cautionary Note Regarding Forward-Looking Information
                                        The information in this presentation has been prepared as at March 30, 2021. This presentation contains “forward-looking statements” and "forward-looking information"
                                        within the meaning of applicable securities laws, including statements regarding the plans, intentions, beliefs and current expectations of Kirkland Lake Gold with respect to
                                        future business activities and operating performance. Forward-looking information is often identified by the words "may", "would", "could", "should", "will", "intend", "plan",
                                        "anticipate", "believe", "estimate", "expect" or similar expressions and include information regarding: (i) changes in Mineral Resource estimates, potential growth in Mineral
                                        Resources, conversion of Mineral Resources to proven and probable Mineral Reserves, and other information that is based on fo recasts of future operational or financial
                                        results, estimates of amounts not yet determinable and assumptions of management; (ii) the amount of future production over any period; (iii) assumptions relating to
                                        revenues, operating cash flow and other revenue metrics set out in the Company's disclosure materials; (iv) statements made with respect to our guidance for production,
                                        cash flow, free cash flow, all-in sustaining costs, and capital expenditures; (iv) future exploration plans; (v) the declaration payment and sustainability of the Company's
                                        dividends;(vi) optimization of mine plans; (vii) the schedules and budgets for the Company's projects; and (viii) the Company's continuous improvement initiatives and the
                                        potential impacts thereof.
                                        Investors are cautioned that forward-looking information is not based on historical facts but instead reflect Kirkland Lake Gold's management's expectations, estimates or
                                        projections concerning future results or events based on the opinions, assumptions and estimates of management considered rea sonable at the date the statements are
                                        made. Although Kirkland Lake Gold believes that the expectations reflected in such forward-looking information are reasonable, such information involves risks and
All dollar amounts in this              uncertainties, and undue reliance should not be placed on such information, as unknown or unpredictable factors could have material adverse effects on future results,
                                        performance or achievements of the combined company. Among the key factors that could cause actual results to differ material ly from those projected in the forward-
presentation are expressed in U.S.      looking information are the following: the future development and growth potential of the Canadian and Australian operations; the future exploration activities planned at
                                        the Canadian and Australian operations and anticipated effects thereof; potential impacts of COVID 19; changes in general economic, business and political conditions,
dollars except as otherwise noted. In   including changes in the financial markets; changes in applicable laws; and compliance with extensive government regulation. Exploration results that include geophysics,
                                        sampling, and drill results on wide spacings may not be indicative of the occurrence of a mineral deposit. Such results do not provide assurance that further work will establish
cases where amounts have been           sufficient grade, continuity, metallurgical characteristics and economic potential to be classed as a category of mineral resource. A mineral resource that is classified as
                                        "inferred" or "indicated" has a great amount of uncertainty as to its existence and economic and legal feasibility. It cannot be assumed that any or part of an "indicated
converted to US$ from C$ as             mineral resource" or "inferred mineral resource" will ever be upgraded to a higher category of resource. Investors are cautioned not to assume that all or any part of mineral
                                        deposits in these categories will ever be converted into proven and probable reserves. This forward-looking information may be affected by risks and uncertainties in the
disclosed in the technical report       business of Kirkland Lake Gold and market conditions. This information is qualified in its entirety by cautionary statements and risk factor disclosure contained in filings made
                                        by Kirkland Lake Gold, including its annual information form for the year ended December 31, 2020, and the financial statements and related MD&A for the financial year
entitled, Detour Lake Operation,        ended December 31, 2020 and for the interim period ended December 31, 2021, which are filed with the securities regulatory authorities in certain provinces of Canada and
                                        available at www.sedar.com.
Ontario, Canada, NI 43-101 Technical     Should one or more of these risks or uncertainties materialize, or should assumptions underlying the forward-looking information prove incorrect, actual results may vary
Report” they have been converted at     materially from those described herein as intended, planned, anticipated, believed, estimated or expected. Although Kirkland Lake Gold has attempted to identify important
                                        risks, uncertainties and factors which could cause actual results to differ materially, there may be others that cause result s not to be as anticipated, estimated or intended.
a C$/US$ exchange rate of 1.31.         Kirkland Lake Gold does not intend, and do not assume any obligation, to update this forward-looking information except as otherwise required by applicable law.

                                        Use of Non-IFRS Measures
                                        This Presentation refers to average realized price, operating costs, operating costs per ounce sold, all-in sustaining cost (“AISC”) per ounce of gold sold, free cash flow,
                                        sustaining capital expenditures and growth capital expenditure because certain readers may use this information to assess the Company’s performance and also to determine
                                        the Company’s ability to generate cash flow and meet its expenditure requirements. This data is furnished to provide additional information and are non-IFRS measures and
                                        do not have any standardized meaning prescribed by International Financial Reporting Standards (“IFRS”). These measures should not be considered in isolation as a
                                        substitute for measures of performance prepared in accordance with IFRS and are not necessarily indicative of operating costs presented under IFRS. Refer to each Company’s
                                        most recent MD&A for a reconciliation of these measures. The most comparable IFRS Measure for operating cash costs, operating cash costs per ounce sold and AISC per
                                        ounce sold is production costs as presented in the Consolidated Statements of Operations and Comprehensive Income, while tota l additions and construction in progress are
                                        the most comparable measures for sustaining and growth capital expenditures.                                                                                                        2
OTHER CAUTIONARY
DISCLOSURES        Cautionary Note to U.S. Investors - Mineral Reserve and Resource Estimates
                   All resource and reserve estimates included in this presentation or documents referenced in this news release have been prepared in accordance with
                   Canadian National Instrument 43-101 - Standards of Disclosure for Mineral Projects ("NI 43-101") and the Canadian Institute of Mining, Metallurgy and
                   Petroleum (the "CIM") - CIM Definition Standards on Mineral Resources and Mineral Reserves, adopted by the CIM Council, as amended (the "CIM
                   Standards"). NI 43-101 is a rule developed by the Canadian Securities Administrators, which established standards for all public disclosure an issuer makes
                   of scientific and technical information concerning mineral projects. The terms "mineral reserve", "proven mineral reserve" and "probable mineral reserve"
                   are Canadian mining terms as defined in accordance with NI 43-101 and the CIM Standards. These definitions differ materially from the definitions in SEC
                   Industry Guide 7 ("SEC Industry Guide 7") under the United States Securities Act of 1933, as amended, and the Exchange Act.

                   In addition, the terms "mineral resource", "measured mineral resource", "indicated mineral resource" and "inferred mineral re source" are defined in and
                   required to be disclosed by NI 43-101 and the CIM Standards; however, these terms are not defined terms under SEC Industry Guide7 and are normally not
                   permitted to be used in reports and registration statements filed with the U.S. Securities and Exchange Commission (the "SEC"). Investors are cautioned not
                   to assume that all or any part of mineral deposits in these categories will ever be converted into reserves. "Inferred mineral resources" have a great amount
                   of uncertainty as to their existence, and great uncertainty as to their economic and legal feasibility. It cannot be assumed that all or any part of an inferred
                   mineral resource will ever be upgraded to a higher category. Under Canadian rules, estimates of inferred mineral resources may not form the basis of
                   feasibility or pre-feasibility studies, except in very limited circumstances. Investors are cautioned not to assume that all or any part of a mineral resource
                   exists, will ever be converted into a mineral reserve or is or will ever be economically or legally mineable or recovered.

                   Qualified Persons
                   Natasha Vaz, P.Eng., Senior Vice President, Technical Services and Innovation is a "qualified person" as defined in NI 43-101 and has reviewed and approved disclosure of
                   the Mineral Reserves technical information and data for the Canadian Assets (excluding Detour) included in this presentation.
                   Eric Kallio, P. Geo., Senior Vice President, Exploration is a “qualified person” as defined in NI 43-101 and has reviewed and approved disclosure of the Mineral Resource
                   technical information and data for the Canadian Assets (excluding Detour) included in this presentation.
                   Andre Leite, P.Eng , AUSIMM CP (MIN), MEng, Mine Technical Services Manager is a "qualified person" as defined in NI 43-101 and has reviewed and approved disclosure
                   of the Mineral Reserves and Mineral Resources technical information and data for Detour included in this presentation.

                   Readers are referred to the Appendix for the detailed footnotes with respect to mineral reserves and resources.

                                                                                                                                                                                               3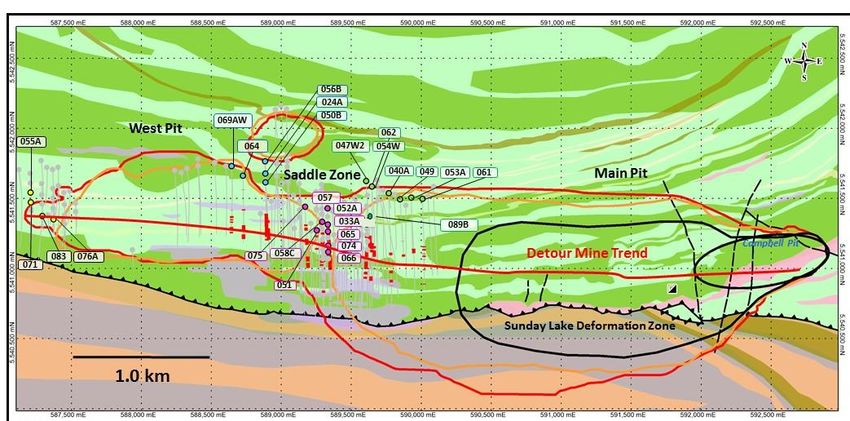
DETOUR LAKE MINE LEADERSHIP
                                                                                      President & CEO
                                                                                       Tony Makuch

  Participants on the conference call:                    SVP Exploration
                                                                                      Chief Operating
                                                                                          Officer
                                                            Eric Kallio
                                                                                       Natasha Vaz
  Tony Makuch – President & CEO
                                                                                        Mine General
                                                                                          Manager
  Natasha Vaz – Chief Operating Officer                                                 Larry Lazeski

  Jennifer Wagner – Executive Vice-President, Corporate           Mine Operation and                    Mine Technical
                                                                     Maintenance                           Services
  Affairs & Sustainability                                           Barry Kellar                        Andre Leite

                                                                  Plant Operation and
  Mohammed Ali – Vice President, Environment                         Maintenance
                                                                                                        Health & Safety
                                                                                                         Dennis Sobey
                                                                    Mark Melanson
  Larry Lazeski – General Manager
                                                                    Human Resource                          Camp
  Andre Leite – Technical Service Manager                          Lindsay Anderson                     Brett Bottyan

  Eric Kallio – Senior Vice President, Exploration                     Capital &
                                                                                                           Tailings
                                                                     Infrastructure
                                                                                                         Colin Ashton
                                                                     Neil Gauthier
                                                                                                                          4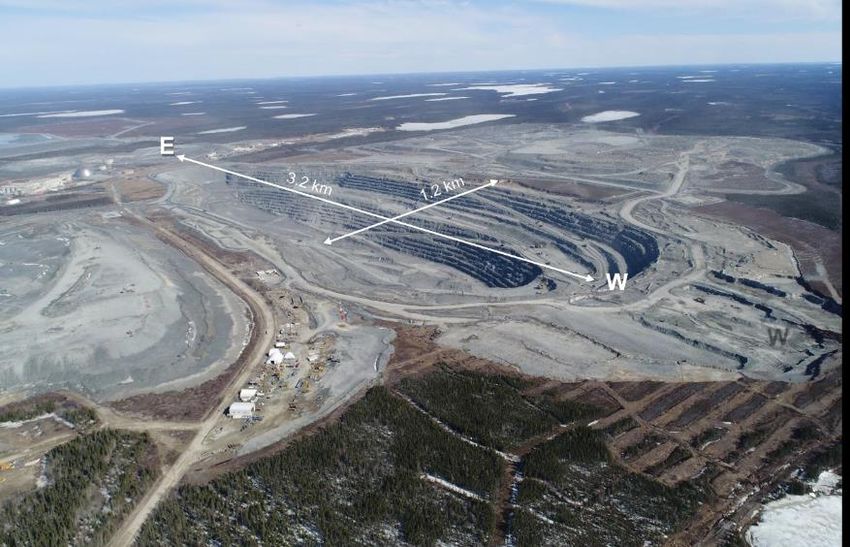
DETOUR GOLD ACQUISTION:
RIGHT DEAL AT THE RIGHT TIME
 ▪   Acquisition of Detour Gold announced November 25, 2019 at equity value of US$3.7Bn and then gold price of
     US$1,457/oz
 ▪   Acquisition closed January 31, 2020
 ▪   77,217,129 KL shares issued, exchange ratio of 0.4343
 ▪   Common shares of 267.0M, 27% higher than pre-transaction level
 ▪   Shares O/S reduced ~20.0M or 7% since transaction completed on January 31, 2020

 Acquisition Rationale
 ▪   Adds high-quality, low-risk asset in low-risk jurisdiction (excellent geographic fit)
 ▪   Solidified KL’s position as senior gold producer with industry-leading cash flow
 ▪   Greatly expanded KL’s Mineral Reserve base
 ▪   Value creation opportunity through continued optimization and expansion of Detour Lake Mine
 ▪   Significant exploration upside
 ▪   Supportive of KL’s commitment to responsible mining and strong community relationships

 Kirkland Lake M&A track record – acquiring assets where we can add value in both operating
 excellence and aggressive exploration                                                                           5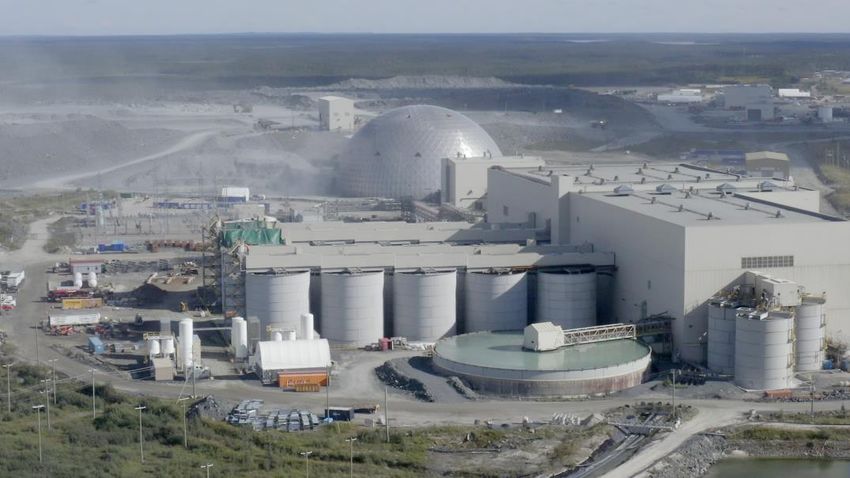
DETOUR LAKE:
A MODEL FOR RESPONSIBLE, VALUE-CREATING
GOLD MINING IN ONTARIO
                Quality People
                ▪ Improving safety performance
                ▪ 85% of workforce from Northern Ontario
                ▪ 21% of workforce identifies themselves as being indigenous

                Responsible Mining
                ▪ Zero Process water discharge
                ▪ Greenhouse gas emissions well below industry average
                ▪ Award-winning mine reclamation program

                Valued Member of Local Communities
                • $105M in annual wages (majority remains in regions)
                • $760M in annual procurement ($600M remains in Ontario)
                • $263M in spending with Indigenous businesses

                                                                               6
DETOUR LAKE:
      A MODEL FOR RESPONSIBLE, VALUE-CREATING
      MINING IN ONTARIO
                                                                       Large-Reserve, Long-Life Operation
                                                                       • 13.8M oz @ 0.96 g/t Mineral Reserve (above 0.50 g/t cut-off grade)*
                                                                       • 2.0m oz @ 0.41 g/t Mineral Reserve to be processed at end of mine
                                                                         life (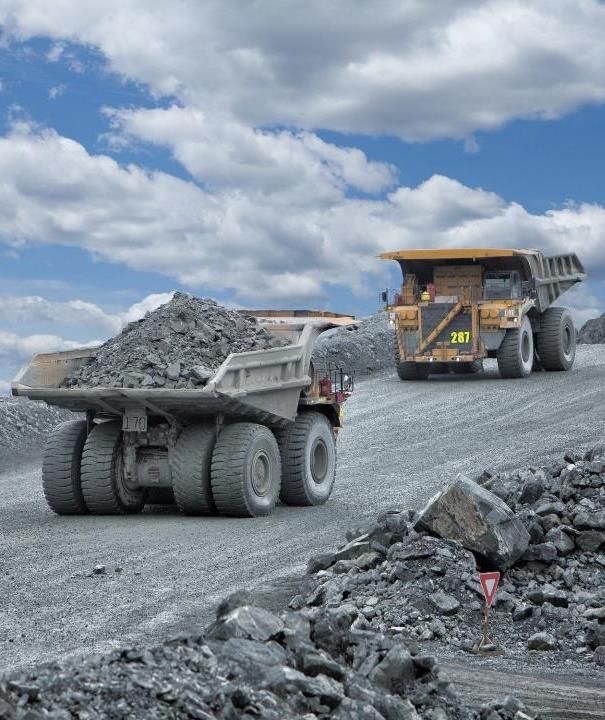
DETOUR LAKE:
VALUE ENHANCEMENT – CURRENT PRIORITIES
 DRIVE FOR SUSTAINABILITY                                                                   OPTIMIZE PROCESSES

                       ▪ Invest in technology and        ▪ Optimize pit design, expand
                         innovation to reduce carbon       drilling and blasting capacity
                         emissions                       ▪ Improve ore fragmentation
                       ▪ Build mine of the future with   ▪ Maximize plant throughput
                         digitization and automation       and recoveries
                       ▪ Support communities and         ▪ Expand fleet maintenance
                         strengthen relationships          capacity and effectiveness

 CAPTURE SYNERGIES                                                                          ACHIEVE FULL POTENTIAL
                       ▪ Centralizing functions          ▪ Invest to achieve 28M tonnes
                         (Timmins Hub opened in Q3         per year by 2025 (permitted
                         2020)                             to 32.8M tonnes)
                       ▪ Renegotiate contracts to        ▪ Employ greater selectivity to
                         capture global pricing            optimize grade
                         advantages                      ▪ Complete 272,000 drill
                       ▪ Enhancing finance and             program in 2021 to realize
                         procurement systems and           full exploration upside
                         procedures
                                                                                                                     8
DETOUR LAKE:
     TARGETING HIGHER PRODUCTION LEVELS
                                                                              ESTIMATED ANNUAL PRODUCTION
                                                        1,000                                (Thousands of Ounces)
                                                                                                                                          800
                                                          800                               680 – 720 680 – 720 680 – 720 680 – 720
                                                          600
                                                                     602            563

                                                          400

                                                          200

                                                             0
                                                                    2019        2020(1)      2021(2)    2022(2)      2023(2)   2024(2)   2025(2)

                                                                       ESTIMATED ANNUAL PROCESSING TONNES
                                                          30                                  (Millions of Tonnes)
                                                                                                                                27.8      28.0
                                                                                                                      27.0
                                                                                                          25.5
                                                                                              24.5
                                                          25                      23.0
                                                                    22.0
                                                          20

                                                          15

                                                          10
                                                                   2019         2020(1)     2021(2)     2022(2)      2023(2)   2024(2)   2025(2)
(1) For twelve months ended December 31, 2020.                                                                                                     9
(2) Included in Company’s production guidance (see press release dated December 10, 2020)
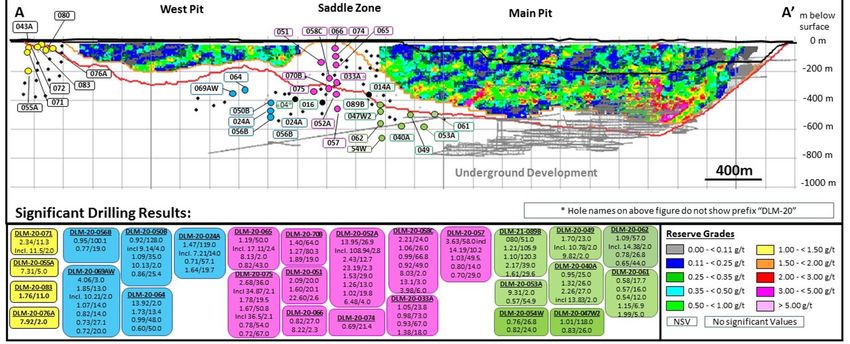
DETOUR LAKE:
 A STORY OF TRANSFORMATION
OUR VISION: TO TRANSFORM DETOUR LAKE MINE INTO ONE OF THE WORLD’S LARGEST AND MOST
PROFITABLE GOLD MINES
Investment Thesis
There is a much larger deposit at Detour Lake than is currently reflected in Mineral Reserves. This will support:
1.   Substantial growth in Mineral Reserves
2.   Transition to larger design
3.   Increased production
4.   Improved unit costs
5.   Significant value creation

Drilling Results to Date Demonstrate:
▪ Continuous corridor of mineralization extends through Saddle Zone to beyond West Pit
▪ High-grade intersections near surface and at depth support potential for substantial growth in Mineral Reserves
▪ Mineralization extends at least 300 m west of West Pit and remains open                                           10
DETOUR LAKE:
ACCOMPLISHMENTS TO DATE
Received Key Permits
▪   Received permit to increase throughput to 32.8M tonnes/year
▪   Received environmental permit authorizing layout of the West Detour Project (“WDP”)

Finance/Administration improvements
▪   Eliminated debt, closed out hedge positions
▪   Realized synergies, re-negotiated large-dollar contracts
▪   Opened Timmins Hub in Q3 2020 (54 positions centralized)

Process Improvements
▪   Expanded drilling and blasting capacity
▪   Improved shovel productivity
▪   Optimized pit bench heights
▪   Increased throughput and processing efficiency
▪   Commenced construction of assay lab, air strip, expanded shops and other site infrastructure
▪   Arrangements made for private area communications network at site                              11
DETOUR LAKE:
ACCOMPLISHMENTS TO DATE
Mineral Reserves and Mineral Resources
▪ New Mineral Reserve and Mineral Resource estimates reflect increased selectivity, improved grade
  control and creation of low-grade reserves to be processed at end of mine life (0.35 – 0.5 g/t material
  mined regardless, but previously classified as waste)
Completed 2021 Life-of-Mine Plan (“LOMP”)
▪   Based on Mineral Reserve and Mineral Resource estimates as at December 31, 2020
▪   Reduced strip ratio (1.90:1)
▪   Increased mill throughput and higher production levels
▪   Improved unit costs
▪   Improved overall site footprint (reduced environmental impact)

                                                                                                            12
DETOUR LAKE: 2021 NI 43-101 TECHNICAL REPORT
What it is . . .
▪ Required regulatory filing to replace outdated 2018 NI 43-101 Technical Report
▪ Incorporates operating and capital costs based on 2018-2020 costs and expenditures
▪ Includes higher throughput levels, based in ongoing investments to increase process plant capacity and
receipt of new permit to process 32.8M tonnes/year without daily limits
▪ Establishes low-grade Mineral Reserve to be processed at end of operating life (ounces previously
assumed to be mined as waste)
What it isn’t . . .
▪ DOES NOT incorporate any benefit for exploration drilling in 2020 and 2021
▪ DOES NOT incorporate full impact of business improvement initiatives
▪ DOES NOT incorporate productivity and grade control benefits from new assay lab (currently under
development)
13SUSTAINABILITY AND
RESPONSIBLE MINING
14
14DETOUR LAKE MINE:
LARGEST MINE IN OPERATION IN NORTHERN ONTARIO
~40% of the total mineral reserves in the region are at DetourLake
>25 M oz produced since 1985
>40 M oz in mineral reserves
15DETOUR LAKE:
CURRENT & FUTURE INFRASTRUCTURE
16RESPONSIBLE GOLD MINING:
COVID-19 RESPONSE
▪ Extensive Health & Safety Protocols
o Reduced operations in Q2 2020
o Remote work where possible
o Suspended non-essential work (exploration &
projects)
o Mandatory rapid testing introduced in early 2021
o Increased cleaning and sanitizing
o Mandatory social distancing and face masks
o Extensive measures to ensure food safety
o Job protection for impacted workers
▪ No transmission of COVID-19 at Detour Lake operation
o Enhanced health and safety protocols in place
o Mandatory rapid testing introduced
17
17RESPONSIBLE GOLD MINING:
IMPROVING HEALTH & SAFETY
Total Recordable Injury Frequency Rate (TMIFR)1
(Annual Average)
2.05 31.%
2.1
Improvement
1.78
1.8 1.68
1.5
1.44 1.42
1.2
0.9
0.6
0.3
0.0
2016 2017 2018 2019 2020
18
1. TMIFR: Total recordable injuries x 200,000 hours divided by total man hours worked. 18RESPONSIBLE GOLD MINING:
PROVIDING EMPLOYMENT TO NORTHERN ONTARIO
WORKFORCE ORIGIN: 86% from Northern Ontario
Total: 1,153 FTE(1) (100%) Cochrane & Nearby Districts
565 positions (49% of total)
Northern Ontario
992 positions (86% of total)
Ontario
1063 positions (92% of total)
Cochrane ▪ Increased Cochrane & Northern Ontario employee representation
▪ (86% of total workforce)
▪ 73% of workforce are hourly employees (operators)
▪ 21% of workforce identifies themselves as Indigenous
19
1) Full-time equivalent as at December 31, 2020.RESPONSIBLE GOLD MINING:
INDIGENOUS PARTNERS
▪ Moose Cree First Nation (MCFN)
▪ Taykwa Tagamou Nation (TTN)
▪ Wahgoshig First Nation (WFN)
▪ Metis Nation of Ontario (MNO)
▪ Quebec Cree
▪ Grand Council of the Crees
▪ Cree Nation of Waskaganish
▪ Local land users
20
20RESPONSIBLE GOLD MINING:
TRAINING & DEVELOPMENT
▪ In-house Learning and Development
program, SkillMine, fosters employee
growth and development
• Team completed more than 22,000 training
courses in 2020 with a focus on health and safety,
employee and leadership development
▪ Indigenous Supervisor Training Program
• 5-year training program with 2 graduates
▪ Partnerships with Keepers of the Circle -
Aboriginal Women in Mining and Aboriginal
Young Men in Mining
▪ Every employee receives Indigenous
Awareness training as part of the
onboarding process
▪ New Resiliency in Indigenous Society
program for supervisors, superintendents
and mangers
▪ Indigenous Peoples Advisory Committee
21RESPONSIBLE GOLD MINING:
Clean Water
• Zero discharge of process water
• Over 95% recycle rate in the mill
Clean Air
DETOUR LAKE MINE
• 60% lower greenhouse gases
A LEADER IN ENVIRONMENTAL than global Industry average
MANAGMENT
Community Partnerships
• Established partnerships with
Indigenous groups
Closure Planning
• 2020 recipient of Tom Peters
Rehabilitation Industry Award 22PERMITTING WEST DETOUR PROJECT (“WDP”)
Through a collaborative process that involves Indigenous Partners and a One-Window
regulatory process, the WDP is geared up for success. All permits are on schedule.
2020
Ongoing Baseline Studies and Fieldwork
Environmental Assessment Process: Permit for WDP received
Mill Throughput Expansion: Permit for 32.8M tonnes/year received
2021
Caribou Management Plan
Fisheries Management Plan
Discharge Location Authorization
Closure Plan Amendment
2022
Permit to Take Water
Air and Noise Amendment
23REVIEW OF
OPERATIONS
24MINING OPERATIONS
Main Pit1
1 Pit dimensions reported include the previous Campbell pit. Ni43101 pit dimensions reported based on future mining areas only 25MAIN MINE FLEET
DETOUR LAKE MINING FLEET IN USE
36 x CAT 795F AC HAULING Mining Method
▪ Conventional truck-shovel open-
pit mining
▪ Drilling & blasting required
02 x CAT 7495 Rope Shovel
▪ Management of old
05 x CAT 6060 Shovel Front
LOADING underground workings
▪ Similar mining methods planned
for West Detour – initially to use
smaller equipment
▪ 1,725 Mt to be moved over 18
07 x Epiroc Pit Viper 271 years (2021 – 2038)
DRILLING ▪ 596 Mt of material processed
over 22 years (2021 – 2042)
05 x Epiroc SmartROC D65
26TOTAL EXPIT PRODUCTION (ORE & WASTE)
TOTAL EXPIT TONNES & GOLD PRODUCTION
Impact of
120 COVID-19 900
104.8 106.2
101.1 101.0 800
100 94.7
87.4 680 – 720 ▪ 2020 impacted by COVID-19
Thousands of Ounces
Millions of Tonnes
700
80 621 ▪ Lower total tonnes mined expected in 2021
602 compared to 2019
571 563 600
538 ▪ Targeting record production in 2021 due to:
60
500 o Reduced strip ratio
40 o Higher average grade
400
20 300
2016 2017 2018 2019 2020(1) 2021(2)
(1) For twelve months ended December 31, 2020.
(2) As disclosed in the 2021 LOMP.
(3) Gold production as included in Company’s 2021 guidance.
27BUSINESS IMPROVEMENT INITIATIVES
Area Main actions Expected Value
Dilution control whilst achieving fragmentation
Geology Higher plant throughput delivering
Ongoing review of grade control and forecasted head grades
reconciliation processes
Optimization of drilling and blasting for wall
control and higher Plant throughput Higher plant throughput
Drill & Blast
Reduced stripping ratio
1 PitViper delivered in Q2 2021
Improve wall monitoring and structure
mapping for wall control blasting aiming pit Reduced stripping ratio
Geotechnical
slope optimization
Radar Monitoring system Installed in
October – Improved site coverage
Transition to 14.5 m bench height
Higher plant throughput
Mine Operation & Dyno/KL transition completed
Lower Mining costs
Maintenance Improved Data Analytics – site driven
dashboards developed
Tire Pressures monitoring system (Q4/2020) 28DRILLING AND BLASTING (“D&B”) IMPROVEMENTS
▪ D&B capacity expanded (one D65 in 2020 and one
PV271 in 2021), with continuous monitoring
introduced
▪ Higher energy blasting introduced to increase % of
fines in defined ore types
Benefits:
▪ Haulage with higher payload per trip
▪ Wear on gear including truck boxes
▪ Bench floor conditions and impact on tire life
▪ Throughput in process plant
▪ Crusher & mill liner life
▪ Reduction in energy consumption for crushing and
grinding
29INCREASING ROPE SHOVEL PRODUCTION
▪ Higher rope shovels production aims to reduce mining costs
▪ Mine has transitioned to 14.5m bench height in 2020 to better match rope shovel optimum operating conditions
▪ Flitch mining in areas mined by the hydraulic shovels is also expected to improve selectivity
30IMPROVING RELIABILITY
ROPE SHOVEL RELIABILITY
100%
% Scheduled Work
80%
7495 ▪ 7495 Rope shovel reliability has increased over the past
60% 3 years
40% ▪ Focus on improving equipment reliability by analyzing
20%
downtime drivers and completing root cause analysis
for equipment breakdown events
0%
▪ Update shovel maintenance strategies to ensure
components are replaced at optimal time and prevent
unnecessary work/over-maintaining
ROPE SHOVEL RELIABILITY ▪ Trialing different rebuild facilities and vendors/supplies
30.0
Medium time between shuts (hours) 7495 for components to ensure competitive pricing
25.0 ▪ Collection of validated data and optimizing downtime
20.0 events with Maintenance Dispatchers
15.0
▪ Developing management plan for welding projects to
10.0
maximize use of internal resources and reduce
5.0
contractor requirements for rebuilds
0.0
31MOBILE MAINTENANCE
Key Improvement Initiatives:
▪ Ending maintenance and repair contract
and assuming this work internally
▪ Constructing four new service bays
▪ Constructing new welding shop
▪ Internal rebuilds of large components
▪ New equipment lifecycle policy
(equipment replaced once lifetime has
been achieved
o Increased reliability
o Reduced downtime
o Lower maintenance costs
32PROCESSING OPERATIONS
33PROCESSING OPERATIONS
▪ Two independent milling circuits involving gravity separation,
concentrate leach, agitated tank leaching, carbon-in-pulp
(“CIP”), solvent extraction and electrowinning, cyanide
▪ Initially designed for 20.0M tonnes/year (55,000 tpd)
▪ Processing rates consistently exceed design capacity, with
23.0M tonnes (62,857 tpd) processed in 2020
▪ Multiple initiatives aimed at increasing capacity to 28.0M
tonne/year by 2025 (permit received to go to 32.8M
tonnes/year) Conventional Milling Flowsheet
o Improved fragmentation
o Improved primary crusher choke feeding
o Secondary crusher screens
o Curved pulp lifters
o SAG mill speed increase
o Re-feed system after the secondary crushers
o Ore blending based on grindability
34
o Increase plant operating time to 93% (from 92%)PROCESS PLANT PERFORMANCE
MILL PRODUCTION MILL OPERATING TIME
(Millions of Tonnes/Year) (Hours per Line/Year)
25
2%↑
11% 8 4%↑ 7.79
23.0 7.65
7.39 Operating time 2%
22.0 4%↑
21.4 7 higher YoY –
20.8 20.7
Operating improved
20
6
Hours maintenance
strategy
5
2018 2019 2020(1)
15
2016 2017 2018 2019 2020(1) MILL THROUGHPUT
4 (Tonnes per Hour/Year)
3%↑ 3%↑
2.95
Throughput 3%
23.0M tonnes milled in 2020 – 3 2.80 2.88
higher YoY –
improved ore
4% increase from 2019 2 fragmentation and
choke feeding
1 strategy
0
(1) For twelve months ended December 31, 2020. 2018 2019 2020(1) 35PROCESS PLANT PERFORMANCE
GOLD PRODUCTION Recoveries (%)
(Thousands of Ounces Recovered) Head grade (g/t)
800
100 1.4
680 – 720
92.1 91.3 92.3 1.3
621 89.2 89.5 90.0
602 90 1.2
600 538 571 563
1.04 1.1
0.97
80 0.93 0.92 1.0
0.90
400 0.83 0.9
70 0.8
0.7
200 60 0.6
0.5
50 0.4
0 0.3
2016 2017 2018 2019 2020(1) 2021(2) 40 0.2
2016 2017 2018 2019 2020(1) 2021(2)
(1) For twelve months ended December 31, 2020. (1) For twelve months ended December 31, 2020.
(2) Included in Company’s production guidance for 2021 (see press release dated (2) As disclosed in the 2021 LOMP.
December 10, 2020).
563k ounces recovered in 2020 - 6% lower Recovery in 2020 is 1% lower and
YoY – Largely reflects impact of COVID-19 head grade 10% lower YoY
measures Recovery rate in 2021 expected to
Planned increase in 2021 reflects both higher increase 11% from 2020 and exceed
36
tonnes processed and improved grade 2019 levelPROCESS PLANT CAPACITY GROWTH
GROWTH PLAN FOR MILLING CAPACITY
(Millions of Tonnes)
22%
30
27.8 28.0
27.0
25.5
24.5
23.0
22.0
5-year investment plan to
20
bring Detour Lake Mine to
its 28M tpy mill capacity
10
2019 2020(1) 2021(2) 2022(2) 2023(2) 2024(2) 2025(2)
(1) For twelve months ended December 31, 2020.
(2) As disclosed in the 2021 LOMP.
37PROCESS PLANT CAPACITY GROWTH
PLANT CAPACITY BREAKDOWN
(Millions of Tonnes/Year)
29
0.30
28 0.70 28.00 MT/Year
Runtime improvements 1.44
27
Secondary Crusher Screens
26 1.06
610 Conveyor Refeed
Removal of mill limit 25 1.50
Pulp lifter 24
D&B Fragmentation 23.00 Total capital expenditures to
23
Actual Capacity achieve 28MT/Year estimated at
22 $65 – $75 million
21
20
2020 2021 2022 2023 2024 2025
▪ Secondary crusher screens to be installed in end 2021 represent 2.25M tonnes additional in capacity
▪ 610 Conveyor refeed adds an additional 750K tonnes of capacity
38WATER MANAGEMENT
Cell #1
▪ Centerline method
▪ Construction started in 2013
▪ Cell #1 is at a final elevation of 322 masl and total
volume of 153.1M tonnes
Cell #2
▪ Downstream method
▪ Construction started in 2018 (completed in 2020)
▪ Tailings deposition commenced in Q4 2020
▪ Total containment estimated at 246M tonnes
Cell #3
▪ Downstream method
▪ Construction starting in 2027
▪ Total containment of 208M tonnes
39THE WAY FORWARD
Maximize the business for free cash flow
▪ Plant growth strategy to bring milling capacity to 28M tonnes per year by 2025
▪ 2021 LOMP
o Includes capital to execute KL’s growth strategy for Detour Lake Mine
o Captures upside observed in production reconciliation
o Updated and realistic cost assumptions for mine, plant, tailings and G&A
o Objective to maximize risk-adjusted NPV
o Required for regulatory purposes
o Does not include any new drilling
▪ Complete exploration program in Saddle Zone and West Detour area by late 2021
▪ 2022 life of mine plan to incorporate exploration success being achieved and further
progress on business improvement initiatives
▪ Continue to drive for world class performance and value creation
▪ Evaluate technology solutions to improve business competitiveness and sustainability 402021 LOMP
412021 LOMP GOLD PRODUCTION SCHEDULE
2021 LOMP GOLD PRODUCTION
1000 3.0
916 915
902 890 896
900
800 808 2.5
800
735
706 706 691 715 701
Recovered Ounces (Thousands)
700 675
2.0
596
Head Grade d(g/t)
600
549
518 517
500 1.5
400 1.10 1.09 1.08 1.07 1.07 379
0.97 0.93 0.96 0.97 354
0.87 0.87 0.89 0.85
326 1.0
300
0.82
0.73
0.63 0.63 0.67
204
200 0.47 0.44
0.40 0.44 0.5
100
0 0.0
2021 2022 2023 2024 2025 2026 2027 2028 2029 2030 2031 2032 2033 2034 2035 2036 2037 2038 2039 2040 2041 2042 2043
Recovered Ounces Recovered Ounces - LG Stock Head Grade Mill Cut-Off Grade
▪ Production schedule plan targets maximum discounted cash-flow
42
▪ 2027/2028: includes reclaiming of stockpiles2021 LOMP MINE PRODUCTION SCHEDULE
MINED TONNES (ORE & WASTE)
140 6
131 130 120 133
127
120
120 111
113 5
109 4.53 4.43 107
101
100 96
3.72 4
Millions of Tonnes
Stripping Ratio
80 2.94
79
2.99 3.02 70
3
63
60 2.16 55
1.72
1.62 1.47
1.63 2
40 30
1.14
20
0.85 0.86 0.74 0.86
0.68 0.79 1
20
- 0
2021 2022 2023 2024 2025 2026 2027 2028 2029 2030 2031 2032 2033 2034 2035 2036 2037 2038
Ore Waste SR
▪ Average total material moved in first five years (2021 – 2025): 114.8 MT
43
▪ Average strip ratio in first five years (2021 – 2025): 2.20 (LOM 1.90)2021 LOMP – UNIT COSTS FOR NEXT FIVE YEARS
600
OPERATING CASH COSTS (US$/oz)
$556
550 $542
$528 $524
$499 $500
500
450
▪ Operating cash cost decreasing over next 5
400
years with increasing gold production
2021 2022 2023 2024 2025 2021-2025 ▪ Cash AISC decreasing over next 5 years with
AISC (US$/oz)
significant sustaining CAPEX in first years
850
$844 ▪ Cash AISC decreasing with significant growth
CAPEX to achieve 28Mt/y milled and
800 $792 transition to thickened tailings
$780 $775
750 $741
$726
700
650
2021 2022 2023 2024 2025 2021-2025
44
1. See Non-IFRS Measures section in forward-looking statements slide
2. Refers to all-in sustaining costs.2021 LOMP CAPEX ANALYSIS – FIVE YEARS
CAPEX - SUSTAINING & GROWTH (2021-2025)
(US$ Millions) ▪ TMA includes construction of Cell 2 and
400 Mine Water Pond for transition to
344 347
350
309 thickened tailings
300 ▪ Process Plant includes Growth capital to
254 256
250 increase production to 28Mt/y by 2025
200 ▪ Mining includes equipment
150 replacement, planned component
100 replacements, and capitalized
50 maintenance of 795 haul trucks
-
▪ G&A is mostly related to West Detour
2021 2022 2023 2024 2025 environmental permitting
Mining Deferred Stripping Processing Tailings Management West Detour Site Admin
2021 2022 2023 2024 2025 Total
Mining 62 98 85 69 90 404
Deferred Stripping 101 82 46 68 165 463
Processing 64 50 54 50 12 230
TMA 68 40 45 50 32 235
West Detour 2 40 18 3 3 66
Site Admin. 48 36 7 15 7 113
45
Total 344 347 254 256 309 1,5102021 LOMP CASH FLOW MODEL
Economic Assumptions
Gold Price US$/oz 1,500
Exchange Rate CAD:USD 1.31
Discount Rate % 5
Pre-Tax Annual Cash Flow Before Capital Expenditures Diesel US$/L 0.61
(US$ Millions) Electricity US$/MWh
2021-24: 19
1,000 2025-LOM: 56
820 836 885
814 830 Project Start Date(1) Jan. 1, 2021
800 755
670 673
625 615 587
600 536 581
534
396 443
400
370
303
262
200 190 245 173
-16
0
-85 -51 -35 -32 -26 -20 -21 -16
-106 -133 -94
-200 -159
-256 -183 -183
-254 -270
-400 -347 -309 -346
-344 -350
-600
2021 2022 2023 2024 2025 2026 2027 2028 2029 2030 2031 2032 2033 2034 2035 2036 2037 2038 2039 2040 2041 2042 2043
Capital Expenditures Pre-Tax Annual Cash Flow Before Capital Expenditures (US$ Millions)
46
1. Discounting is to this date.2021 LOMP KEY RESULTS
Physicals(1) Financials (US$ Millions)
Mining Gross Revenues 21,778
Ore Mined (Mt) 593.9 Refining & Transport Costs (25)
Net Revenues 21,754
Waste Mined (Mt) 1,131.4
Operating Costs - Mining (3,526)
Ex-Pit Mined (Mt) 1,725.3 Operating Costs - Processing (3,976)
Strip Ratio (waste/ore) 1.90 Operating Costs - Site Admin (1,458)
Ex-Pit Ore Grade (g/t) 0.82 Operating Costs (8,960)
Processing Royalties and First Nations Payments (584)
Milled (Mt)* 596.1 Changes in Inventory (27)
Operating Margin 12,182
Head Grade (g/t) 0.82
Capital Expenditures (3,621)
Recovery 91.9% Reclamation (79)
Gold Recovered (koz) 14,499 Lease Payments (9)
Gold Poured (koz) 14,518 Less: Changes in Working Capital 32
Sales Free Cash Flow Before Taxes 8,505
Gold Sold (koz) 14,519 Taxes (2,127)
Free Cash Flow After Taxes 6,377
Average Unit Costs (US$/Oz) (2) Net Present Value Before Tax (5%) 5,049
Operating Cash Costs 619 Net Present Value After Tax (5%) 3,792
AISC(3) 821
1. Tonnes and ounces are based on Mineral Reserves and Mineral Resources as at December 31, 2020.
2. See Non-IFRS Measures section in forward-looking statements slide.
3. Refers to all-in sustaining costs. 47
* Mineral Reserves accounts for actual 2020 end of year mine surface and stockpile balances.SIGNIFICANT SENSITIVITY TO GOLD PRICE
Cumulative Undiscounted After-Tax Cash Flow (US$M) SENSITIVITY OF AFTER-TAX NPV TO GOLD
8,332 6,000 PRICE(1)
9,000
5,000 5,035
$ Millions
8,000
6,377 4,000
4,417
7,000 3,792
6,000 3,000 3,143
4,323 2,479
5,000 2,000
4,000 1,000
3,000 -
2,000 1300 1400 1500 1600 1700
1,000 Gold Price (US$/oz)
-
1. Assumes base case exchange rate of (C$/US$) 1.31.
US$ 1,300/oz Gold US$ 1,500/oz Gold US$ 1,700/oz Gold SENSITIVITY OF AFTER-TAX NPV TO
EXCHANGE RATE(1)
5,000
Exchange Rate (CAD/USD) 4,440
4,000 4,116
After-Tax NPV @ 5% (C$M) -0.10 -0.05 Base +0.05 +0.10 3,792
3,452
$ Millions
3,000 3,119
1.21 1.26 1.31 1.36 1.41
2,000
-200 1,300 1,893 2,180 2,479 2,784 3,071 1,000
Gold Price
(USD/oz)
-100 1,400 2,504 2,833 3,143 3,452 3,768 0
1.21 1.26 1.31 1.36 1.41
Base 1,500 3,119 3,452 3,792 4,116 4,440 Exchange Rate
+100 1,600 3,718 4,069 4,417 4,762 5,106
1. Assumes base case gold price of $1,300/oz.
+200 1,700 4,298 4,667 5,035 5,402 5,761
48EXPLORATION OVERVIEW
49EXPLORATION OVERVIEW
50DETOUR LAKE: A MODEL FOR RESPONSIBLE, VALUE-
CREATING GOLD MINING IN ONTARIO
Quality People Large-Reserve,
Long-Life Mining
Responsible Strong FCF &
Mining Profitability
Community Substantial Value
Focused Creation Upside
OUR VISION
TO TRANSFORM DETOUR LAKE MINE INTO ONE OF THE
WORLD’S LARGEST AND MOST PROFITABLE GOLD MINES 51APPENDIX
Readers are referred to the Technical Report entitled "Detour Lake Operation, Ontario, Canada, NI 43 -101 Technical Report" that has an effective date of December 31, 2020, and prepared by Mr.
Andre Leite, P.Eng., Mr. Jean-Francois Dupont, P.Eng., Dr. Veronika Raizman, P.Geo., and Mr. Paul Andrew Fournier, P.Eng., each of whom is a “qualified person” pursuant to NI 43-101. For full
technical details of the report, reference should be made to the complete text of the Detour Technical Report, which has been filed with the applicable regulatory authorities and is available under the
Company’s SEDAR profile at www.sedar.com and on EDGAR at www.sec.gov.
Mineral Reserves Notes:
1. The Mineral Reserves have an effective date of December 31, 2020. The Qualified Person for the estimate is Mr. Andre Leite
2. Mineral Reserves amenable to open pit mining methods were estimated using a gold price assumption of US$1,300/oz, an exchange rate of 1.31 C$/US$, a 2% net smelter return royalty, refining
charge of 0.05%, variable metallurgical recoveries based on a formula, inter-ramp pit slope angles that range from 25.1–56.3º, mining cost of C$3.42/t mined, incremental haulage costs of
C$0.019/7.25 m bench at Detour Lake and C$0.15/5 m bench at West Detour and North Pit, process costs of C$9.75/t milled, general and administrative costs of C$3.59/t milled, non-mining
sustaining capital costs of C$3.42/t milled, and mining sustaining capital costs of C$0.35/t mined. The estimate is reported above variable optimized cut-off and a minimum cut-off grade of
0.35 g/t Au.
3. Estimates were rounded in accordance with reporting guidelines. Totals may not sum due to rounding.
4. Totals may not add up due to rounding.
Mineral Resources Notes:
1. The Mineral Resources have an effective date of December 31, 2020. The Qualified Person for the estimate is Mr. Andre Leite, P.Eng., a Kirkland Lake employee.
2. Mineral Resources are reported exclusive of those Mineral Resources converted to Mineral Reserves. Mineral Resources that are not Mineral Reserves do not have demonstrated economic
viability. Mineral Resources are reported using the 2014 CIM Definition Standards.
3. Mineral Resources considered amenable to open pit mining methods were estimated using a gold price of US1,500/oz, an exchange rate of 1.31 C$/US$, variable metallurgical recovery
assumptions based on formulae, refining and transport costs of C$5/oz Au, mining costs of C$3.42/t mined, process costs of C$ 9.75/t milled, tailings management costs of C$1.50/t milled, general
and administrative costs of C$3.59/t milled, non-mining sustaining capital costs of $2.44/t milled, mining sustaining capital costs of C$0.35/t mined, incremental bench cost of $0.019/t/bench, and
variable pit slope angles that range from 25–56º. The estimate is reported above a cut-off grade of 0.5 g/t Au.
4. Mineral Resources considered amenable to underground pit mining methods were estimated assuming long-hole and transverse stoping methods. The estimates used a gold price of US1,300/oz,
metallurgical recovery assumption of 97%, refining and transport costs of C$5/oz Au, average mining cost of C$75/t mined, pro cess and tailings costs of C$9/t milled, general and administrative
costs of C$11.50/t, assumed dilution average of 12%. The estimate is reported above a cut-off grade of 2.2 g/t Au.
5. Estimates have been rounded in accordance with reporting guidelines. Totals may not sum due to rounding.
6. Totals may not add up due to rounding.
52You can also read