Investor Presentation - Seeking Alpha
←
→
Page content transcription
If your browser does not render page correctly, please read the page content below

Investor Presentation
August 2021

Disclaimer
General
You are advised to read this disclaimer carefully before reading, accessing or making any      should not be considered an alternative to IFRS financial measures, such as net income.
other use of the information included herewith. These materials are not an offer or the        As non-IFRS financial measures do not have standardized definitions prescribed by IFRS,
solicitation of an offer to purchase any securities or make any investment. This               they are less likely to be comparable with other issuers or peer companies. A description
presentation includes information about Tricon Residential Inc. and its subsidiaries and       of the non-IFRS measures used by the Company in measuring its performance is included
investees (together, the “Company”) as of March 31, 2021, unless otherwise stated. These       in its Management Discussion and Analysis available on the Company’s website at
materials should be reviewed in conjunction with the Company’s Financial Statements and        www.triconresidential.com and on SEDAR at www.sedar.com.
Management Discussion and Analysis for the periods ending March 31, 2021 and are
subject to the detailed information and disclaimers contained therein. All dollar amounts      This presentation may contain information and statistics regarding the markets in which
are expressed in U.S. Dollars unless otherwise stated.                                         the Company and its investees operate. Some of this information has been obtained from
                                                                                               market research, publicly available information and industry publications. This information
The Company measures the success of its business in part by employing several key              has been obtained from sources believed to be reliable, but the accuracy or completeness
performance indicators that are not recognized under IFRS including net operating income       of such information has not been independently verified by the Company and cannot be
(“NOI”), funds from operations (“FFO”), core funds from operations (“core FFO”), adjusted      guaranteed. Disclosure of past performance is not indicative of future results.
funds from operations (“AFFO”), and assets under management (“AUM”). These indicators

Forward-Looking Statements
This presentation may contain forward-looking statements and information relating to            In regards to the strategic goals and targets presented herein, these are based on the
expected future events and the Company’s financial and operating results and projections,       assumed impact of the growth drivers, proposed transactions, and sources of cash flow
including statements regarding the Company’s growth and performance goals and                   described and on the assumption that other drivers of performance will not deteriorate
expectations, including, in particular, targeted returns, expected future performance, and      over the relevant period. There can be no assurance that such growth drivers, transactions
growth projections, that involve risks and uncertainties. Such forward-looking information is   or cash flow will occur, be realized, or have their anticipated impact and therefore no
typically indicated by the use of words such as “will”, “may”, “expects” or “intends”. The      assurance that actual performance will align with the Company’s targets.
forward-looking statements and information contained in this presentation include
statements regarding the Company’s strategic priorities; expected or targeted financial and     Projected returns and financial performance are based in part on projected cash flows for
operating performance including project timing, projected cash flow; projected NOI and          incomplete projects as well as future company plans. Numerous factors, many of which
other projected performance metrics; the ability of the Company to extend debt maturities       are not in the Company’s control, and including known and unknown risks, general and
and refinance debt; the ability to attract third-party investment and the current private       local market conditions and general economic conditions (such as prevailing interest rates
fundraising pipeline FFO growth and the potential drivers of that growth; expectations for      and rates of inflation) may cause actual performance and income to differ from current
the growth in the business; the availability and quantum of debt reduction opportunities        projections. Accordingly, although we believe that our anticipated future results,
and the Company’s ability to avail itself of them; improvements to the Company’s financial      performance or achievements expressed or implied by the forward-looking statements and
reporting, the acquisition and development plan of the Queen & Ontario project; the             information are based upon reasonable assumptions and expectations, the reader should
Company's future balance sheet composition; the anticipated quantum and availability of         not place undue reliance on forward-looking statements and information. If known or
leverage to facility home acquisitions; the anticipated value of the Company's assets and       unknown risks materialize, or if any of the assumptions underlying the forward-looking
managed portfolios; the potential up-size of the Homebuilder Direct JV; the Company's           statements prove incorrect, actual results may differ materially from management
acquisition program and the anticipated pace and number of home acquisitions; Tricon’s          expectations as projected in such forward-looking statements. Examples of such risks are
growth strategies and projections for its single-family rental business; and the Company’s      described in the Company’s continuous disclosure materials from time-to-time, as
capital raising targets and anticipated future investment vehicles. These statements reflect    available on SEDAR at www.sedar.com. The Company disclaims any intention or
the Company’s current intentions and strategic plans however, the items noted may not           obligation to update or revise any forward-looking statements, whether as a result of new
occur in line with the Company’ expectations or at all. These statements are based on           information, future events or otherwise, unless required by applicable law.
management’s current expectations, intentions and assumptions which management
believes to be reasonable having regard to its understanding of prevailing market
conditions and the current terms on which investment opportunities may be available
                                                                                      Jacksonville, FL
                                                                                          1
Tricon Residential is an owner and operator of a growing portfolio of over 31,000 single-family rental
homes and multi-family rental apartments in the United States and Canada with a primary focus on the
U.S. Sun Belt. Our commitment to enriching the lives of our residents and local communities underpins
Tricon's culture and business philosophy. We strive to continuously improve the resident experience
through our technology-enabled operating platform and innovative approach to rental housing. At Tricon
Residential, we imagine a world where housing unlocks life's potential.

                                                                                                                   Coolray Field,
                                              Atlanta, GA                                  Houston, TX               Atlanta, GA

                                                                                                           The Reserve at Alafaya,
                                           Charlotte, NC                                Jacksonville, FL             Orlando, FL     The Selby, Toronto, ON

Note: The above photos may not be representative of all Tricon investment properties.

                                                                                                    2
Our mission is to provide quality housing for families                                                                                                              TSX: TCN
across North America and to generate strong risk-adjusted
returns for our public and private investors

   1988                       Founded                                        23,502                              Single-Family
                                                                                                                 Rental (“SFR”)
                                                                                                                                                      C$3.1B   Market
                                                                                                                                                               Capitalization
                                                                                                                 Homes

                                                                                                                                                               Dividend Yield
  2010                        Listed (TSX)                                        7,789                          Stabilized
                                                                                                                 Multi-Family                          1.9%    (C$0.07/Quarter)
                                                                                                                 Rental Apartments

                                                                                                                                                           1
                                                                                                                 Multi-Family
             33
                              Years of Investing
                              In Communities                                      3,720                          Rental Apartments                      17%    Annualized Growth
                                                                                                                                                               In Book Value Per
                                                                                                                 Under Development                             Share Since Entering
                                                                                                                                                               SFR In 2012

All data presented as at December 31st, 2020. Share price is as of July 30th, 2021. All figures in U.S. dollars unless otherwise indicated.
1. Annualized growth in book value per share is calculated based on CAD book value since Tricon entered the Single Family Rental sector in Q1 2012.

                                                                                                                      3
Our Evolution as a Rental Housing Company

  1988              2010               2012              2017                2018              2019             2020                  2021

Founded with a     Listed on          Entered U.S.      Acquisition of     Formed $2B SFR     $450M JV formed   Internalized          Formed $1.3B JV
focus on           the TSX with an    Single-family     Silver Bay Trust   joint venture to   with ASRS to      U.S. multi-family     and re-capitalized
providing equity   Initial Public     rental business   for $1.4B          acquire ~10,000    pursue B2R        asset                 U.S. multi-family
to developers      Offering of $60M                                        homes              communities       management &          portfolio
                   CAD                                                                        ---               Canadian multi-       ---
                                                                                                                family property
                                                                                              Acquisition of                          Formed $1.1B
                                                                                                                management
                                                                                              $1.3B U.S.                              (C$1.4B) Toronto
                                                                                              multi-family      ---                   multi-family
                                                                                              portfolio         $300M Preferred       development JV
                                                                                                                Equity investment     with CPP
                                                                                                                led by Blackstone     Investments
                                                                                                                Real Estate           ---
                                                                                                                Investment Trust      Formed $1.5B
                                                                                                                ---                   single-family
                                                                                                                Closed a 6 year       rental
                                                                                                                $553M                 Homebuilder
                                                                                                                securitization at a   Direct JV
                                                                                                                coupon of 2.34%       ---
                                                                                                                ---                   Formed $5.0B
                                                                                                                Closed a 7 year       single-family
                                                                                                                $441M                 rental JV-2 to
                                                                                                                securitization at a   acquire 18,000
                                                                                                                coupon of 1.83%       homes over 3
                                                                                                                                      years

                                                                             4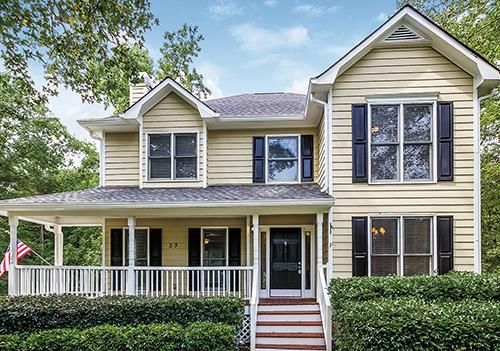
Our Strategic Vision
   Tricon generates predictable cash flow from rental assets and enhances its investment returns with
                       contractual fees earned from managing third-party capital.

               Predictable                        Access to                        Centralized
              Rental Income                    Strategic Capital                Operating Platform

          Generate recurring rental     Raise third-party capital to enhance   Leverage operating synergies
          income from single-family       scale and improve operational        and innovation across single-
            and multi-family rental      efficiency, reduce balance sheet         family and multi-family
                 properties.            exposure to development activities,              portfolios.
                                          and drive return on equity with
                                              incremental fee income.

                                                       5
Our Purpose Statement and Guiding Principles

                                Our Purpose Statement

                                Imagine a world where housing
                                unlocks life’s potential

                                Our Guiding Principles

                                • Go above and beyond to enrich the
                                  lives of our residents

                                • Commit to and inspire excellence in
                                  everything we do

                                • Ask questions, embrace problems,
                                  thrive on the process of innovation
                                • Do what is right, not what is easy

                                • Elevate each other so together we leave
                                  an enduring legacy

                            6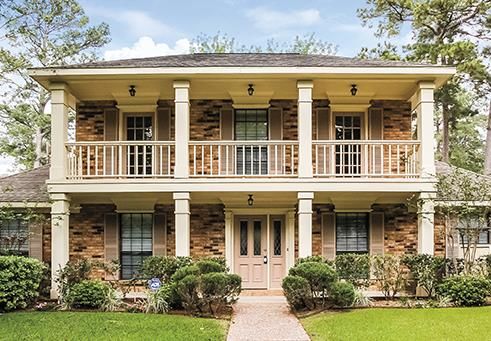
The U.S. Sun Belt – A Vast Rental Housing Opportunity
                          The U.S. Sun Belt is home to about ~40% of all U.S. households, and is expected to see
                                         ~60% of the growth in U.S. households from 2016-2025.

  Projected population
  growth from 2016-2025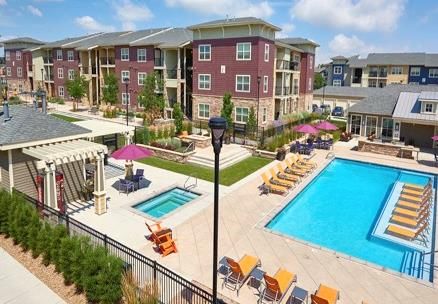
Long-term Trends Support Tricon’s Investment Strategy
                            Well-established migration trends support Tricon’s Sun Belt middle-market strategy.

        Sun Belt Migration                                                 Population Growth from 2010 to 2020 in
                                                                           Tricon’s Key Markets1
        • States where Tricon operates
          experienced population growth of 11%                                   Texas                               15%
          over the past decade on average, 400
          bps above the national average                                       Nevada                                15%

        • We expect these migration trends to                                   Florida                             14%
          continue as Americans move to
          markets with superior job growth, lower                              Arizona                        12%
          taxes, more affordable living options
          and better weather                                             South Carolina                 10%             21.7M people
                                                                                                                     moved to Tricon’s
                                                                               Georgia                  10%          key markets over
                                                                                                                      the past decade
                                                                         North Carolina              9%

                                                                            Tennessee              8%

                                                                     National Average           7%

                                                                              California      6%

1.   U.S. Census Data, April 26th, 2021

                                                                     8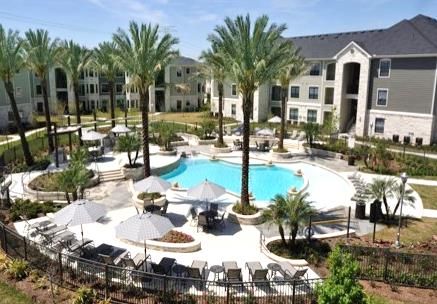
Long-term Trends Support Tricon’s Investment Strategy
                                Demographic shifts are driving demand for Tricon’s single-family rental homes.

     Demographic Shifts                                                                 Family-age Millennials and Baby Boomers are
                                                                                        Driving Housing Demand1
     • The large Millennial and Baby
       Boomer demographic cohorts are                                              30
                                                                                                                                 ~72M Millennials are
                                                                                                                                 seeking single-family
       the key drivers of demand for                                                                                             homes as they form                                         …while ~69M
                                                                                                                                 families…                                                  Baby Boomers
       single-family housing                                                                                                                                                                are preferring
                                                                                                                                                                                            to age in place

        • Millennials are reaching the

                                                             U.S. Population (M)
                                                                                   20
          peak of their family-forming
          years from 2020 to 2030, and
          are seeking more space,
          proximity to schools and parks,
                                                                                   10
          and other lifestyle benefits of
          single-family homes

        • Baby Boomers are preferring to
                                                                                   0
          age in place, with occupancy

                                                                                                                                45 - 49
                                                                                        25 - 29

                                                                                                  30 - 34

                                                                                                            35 - 39

                                                                                                                      40 - 44

                                                                                                                                          50 - 54

                                                                                                                                                     55 - 59

                                                                                                                                                               60 - 64

                                                                                                                                                                                  70 - 74

                                                                                                                                                                                            75 - 79

                                                                                                                                                                                                      80 - 84
                                                                                                                                                                         65- 69

                                                                                                                                                                                                                85 >
          declining in seniors housing
          due to concerns related to
          COVID-19
                                                                                                                                          Population Age

                                                                                                                                              2020                  2030
1.   U.S. Census Data, April 26th, 2021

                                                                                        9
Tricon’s Middle Market Focus
Tricon’s U.S. rental strategy is focused on serving the middle market, an addressable market of almost 9
million households with strong long-term rentership fundamentals.
HOUSEHOLD 7.1M RENTERS
INCOME 39M $1,800+ Monthly Rent
HOUSEHOLDS Temporary renters
>$100K Higher turnover
Higher ownership rate
$100K
8.8M RENTERS
28M $1,000 − $1,800 Monthly Rent
HOUSEHOLDS Long-term renters
$60K − $100K Lower turnover
Stable cash flow
$60K
28.2M RENTERS
61M < $1,000 Monthly Rent
HOUSEHOLDS Higher eviction ratesOur People
A dynamic, high-performing team of industry leaders and housing experts leading 800+ dedicated employees
across Toronto, Orange Country, San Francisco, Houston, and other local field offices.
Our C-Suite
Gary Berman Wissam Francis Jonathan Ellenzweig Kevin Baldrige Sherrie Suski David Veneziano
President & CEO EVP & Chief Financial Officer Chief Investment Officer Chief Operating Officer Chief People Officer Chief Legal Officer
David Berman Geoff Matus Andy Carmody Evelyne Dubé Reshma Block Andrew Joyner Wojtek Nowak
Executive Chairman Co-Founder Managing Director Managing Director, Head of Technology Managing Director Managing Director,
& Co-Founder Private Funds and Innovation Capital Markets
John English Alan O’Brien Douglas Quesnel Sandra Pereira David Mark Gina McMullan Bill Richard
Head of Development Head of Property Operations Chief Accounting Officer SVP, Managing Director, SVP, Head of SFR Acquisitions &
Canada Head of Tax Services Finance Corporate Reporting Asset Management
11Technology & Innovation
Technology and innovation are at the core of our success. Our tech-enabled operating platform allows us to
scale our business, drive operating efficiencies and continuously improve our resident experience.
Asset Management Acquisitions
Revenue optimization tools used TriAD acquisitions platform filters
to balance rent vs. occupancy vs. millions of listings per year, ranks
time on market; dedicated ancillary homes against key criteria, and
revenue team are continually standardizes hundreds of key
adding new service offerings to underwriting steps, enabling the
benefit residents and drive team to convert listings to offers in
revenue growth. minutes.
Call Center
Intelligent Virtual Agents Resident Underwriting
streamline resident inquiries Statistical screening model
ranging from new leases to used to qualify residents,
service requests; centralized drive retention and reduce
administration and oversight of turnover costs.
repair and maintenance results
in efficient repairs.
Repair & Maintenance Leasing
TriForce platform enables real-time data Leverage 360-degree online tours,
sharing by field staff and central office; self-showing technology, and
mobile inventory management drives algorithmic lead scoring in order to
efficiency for maintenance techs. maximize prospect conversion.
12Our Single-Family Rental Portfolio
Tricon operates one of the largest portfolios of single-family rental homes in the U.S. Sun Belt.
23,502 1,625 SF $1,483 $0.91 1994 $179,000
Total Homes Avg. Home Size Avg. Monthly Rent Avg. Monthly Rent / SF Avg. Vintage Avg. Home Value
Charlotte, NC
Atlanta, GA Houston, TX Charlotte, NC
Atlanta, GA
Jacksonville, FL Columbia, SC Atlanta, GA
Jacksonville, FL
Note: Homes depicted may not represent all homes in the portfolio.
13SFR Represents a Vast Market Opportunity
Tricon’s existing Sun Belt markets present a vast growth opportunity, with a deep supply of resale homes to
allow us to potentially acquire up to 5,000 SFR homes per year that meet our acquisition criteria (vs. ~3,200
current run-rate).
U.S. Market Opportunity Illustrative Acquisition Funnel1
U.S. rental housing is a deep market with institutionally owned single-
family rental operators owning ~2% of the SFR universe.
250:1
~1,200,000
Listings
SFR
16.4M
SFR
0.3M Institutionally- 40:1
~200,000
Homes Homes 16.4M Buy Box
Owned SFR Homes
Owned Rented MFR
78.7M 48.9M 16.2M (~2% of SFR
62% 38% MFR
Universe) 13:1 ~65,000
16.2M Offers
Other Rental
16.3M
~5,000
Tricon is well equipped to expand its exposure and increase acquisition Acquisitions
volume by leveraging its proprietary acquisition platform to source and
underwrite homes that meet its rating criteria, and execute offers on 1:1
homes within minutes
Annual Home Sales in Tricon’s Existing Markets2
Las Northern San Southeast Southern
Atlanta Charlotte Columbia Dallas Houston Indianapolis Jacksonville Nashville Orlando Phoenix Raleigh Reno Tampa Total
Vegas California Antonio Florida California
2020 116,262 38,648 13,831 111,092 97,481 40,728 31,392 44,425 39,739 111,759 47,057 112,831 32,261 8,171 39,374 74,722 192,554 71,346 1,223,673
2019 116,249 37,183 13,745 103,548 90,891 39,968 31,867 46,331 41,041 112,560 50,310 112,390 30,878 8,505 35,949 79,569 194,594 73,829 1,219,407
2018 113,861 35,546 13,506 100,334 87,190 40,037 30,540 48,955 39,332 116,163 50,169 108,244 29,946 8,590 33,583 83,958 195,991 73,179 1,209,124
Source: John Burns Real Estate Consulting.
1. Illustrative funnel based on Tricon management estimates.
2. Represents full year home sales in existing markets; excludes potential new markets where Tricon currently operates its multi -family strategy or could expand its single-family strategy in the future.
14SFR Acquisition Channels
Tricon has expanded its single-family rental acquisition program across multiple channels and formed
complementary joint ventures with third-party investors to scale faster.
Investment Vehicle
MLS Off Market SFR JV-2
Traditional resale home Includes emerging “iBuyer” Homebuilder Direct JV
channel direct sales channel which
allows sellers to bypass THPAS JV-1
MLS
Development of New Portfolios
Home Communities
Leverage Tricon’s
Development of industrywide relationships
dedicated single-family and strong operating
rental home communities platform to buy stabilized
homes in bulk
Existing New Home Scattered New Homes
Communities Acquisition of newly-built
Acquisition of dedicated homes
single-family rental home
communities
15Single-Family Rental: Consistently Strong Operating Metrics
Same Home NOI Growth Same Home NOI Margin Same Home Average Blended Rent Growth
66.8% 66.7%
66.2%
66.0% 66.1% 6.6%
6.2%
10.0% 65.5% 5.3% 5.6% 5.2% 5.6%
65.3%
4.7%
6.5% 6.3%
5.5% 5.1% 5.1%
4.1%
Q3/19 Q4/19 Q1/20 Q2/20 Q3/20 Q4/20 Q1/21 Q3/19 Q4/19 Q1/20 Q2/20 Q3/20 Q4/20 Q1/21 Q3/19 Q4/19 Q1/20 Q2/20 Q3/20 Q4/20 Q1/21
70 bps margin improvement year-over- Strong demand and scarcity of available
Consistently delivering industry-leading homes enable outsized rent growth,
year due to stringent expense control
same home NOI growth. while self-governing on renewals.
and strong top-line growth.
Same Home Occupancy Same Home Annualized Turnover
97.5%97.5%
97.3%97.3% 30.8%
25.7% 26.1%
96.7% 21.4% 22.7% 22.2% 20.6%
96.5%
95.9%
Q3/19 Q4/19 Q1/20 Q2/20 Q3/20 Q4/20 Q1/21 Q3/19 Q4/19 Q1/20 Q2/20 Q3/20 Q4/20 Q1/21
Continued focus on customer service
Sustaining near-record occupancy
and resident retention has driven
throughout the pandemic.
turnover down 80 bps year-over-year.
Note: Metrics reflect Tricon’s proportionate share of the managed portfolio and exclude limited partners’ interests in the SFR JV-1 portfolio.
Jacksonville, FL
16Our U.S. Multi-Family Rental Portfolio
Tricon owns a portfolio of high quality affordably priced suburban garden-style apartments
in the U.S. Sun Belt.
23 7,289 966 SF $1,212 $1.25 2012
Properties Total Units Avg. Unit Size Avg. Monthly Rent Avg. Monthly Rent / SF Avg. Vintage
Falls at Eagle Creek, Houston, TX The Allure, Austin, TX The Reserves at Alafaya, Orlando, FL
The Callie, Dallas, TX Carrick Bend, Denver, CO Altis at Sand Lake, Orlando, FL
Note: Representative images are of select units and may not represent all properties.
17Canadian Multi-Family Growth Vehicle: JV with CPP
Tricon’s $1.1B (C$1.4B1) JV with CPP Investments provides a path of growth to 7,000 units for our Canadian
multi-family portfolio which is projected to be valued close to C$4.00 per share upon stabilization.
~7,000
Units
WDL Down-
The WDL Remaining
The Selby The Ivy 7 Labatt The James Blocks 10, town East
Taylor Block 81 CPP JV
3/4/7, 201 (CPP)
1,200 to
Suites 500 286 231 770 558 120 1,755 870
2,000
Initial
Stabilized 2022 2022 2023 2024 2025 2024-2026 2025 2025+
Occupancy
Current IFRS Illustrative NAV per Share upon Illustrative NAV per Share upon
NAV per Share2 Stabilization of Existing Projects3 Stabilization of CPP JV Projects3
C$1.06 ~C$3.00 ~C$3.75
Note: this information is based on current project plans, which are subject to change.
1. The West Don Lands includes four developments with initial occupancy projected to commence in 2023 and continue through 2026.
2. Current IFRS NAV includes development properties and The Selby.
3. Assumes development yield of 4.75% on cost and market stabilized cap rate for downtown Class A multi-family assets. CPP Investments JV developments are projected at a total cost of C$1.4B. NAV per
share is based on 193M basic shares outstanding.
4. Expected total development cost of the JV's projects.
18Strong Private Fundraising Pipeline
2021 is poised to be the most prolific year of fundraising in Tricon’s history, with $2B of third-party equity
commitments already raised year-to-date. Tricon expects to earn over $10M of annual asset management fees
from fundraising vehicles closed this year.
Canadian
Strategy Single-family Rental U.S. Multi-family Rental
Multi-family Rental
• SFR JV-2 – $4.7 to $5.2B JV • Syndication of 80% of Tricon’s • Investment partnerships across
Existing
focused on resale homes and U.S. multi-family portfolio, 10 development projects
Investment portfolios of existing homes raising $432M in equity
Vehicles proceeds • Recently announced $1.1B
• Homebuilder Direct – $1.0 to (C$1.4B) JV with CPP
$1.5B JV focused on buying new Investments
homes from homebuilders
• THPAS JV-1 - $1.0B JV focused
on development of SFR
communities (build-to-rent)
Planned • Launch of a growth vehicle to
Investment acquire multi-family properties
Vehicles in Tricon’s Sun Belt markets
$2B of third-party equity commitments raised year-to-date with more to come
Projected
Financial
Impact for ~$10M of projected annual asset management fees on investment vehicles raised in 2021
Tricon (as well as property management, acquisition, development/construction and leasing fees to offset associated
overhead expenses, and potential performance fees)
Refer to “General” and “Forward-Looking Statements” on Page 1
19Tricon’s Balance Sheet Asset Composition
Single-family rental is Tricon’s core balance sheet growth strategy and represents more than 90% of our assets
following the syndication of the U.S. multi-family rental portfolio.
Multi-family Rental (2%)
Residential Development (5%) Reduced to 2% of assets as a result of
Focused on Canadian multi-family 2% the recent syndication transaction;
and U.S. single-family rental build- 5% expected to remain below 5% of assets
to-rent growth strategies, expected
to remain near 5% of assets
$5.7B
of Real Estate
Assets1
93%
Single-family Rental (93%)
Core balance sheet growth strategy
expected to account for over 90% of our
assets
Note: Refer to “General” and “Forward-Looking Statements” on Page 1
1. Total assets based on reported fair market value of consolidated assets as of Q1/21 Jacksonville, FL
20Consolidated Debt and Liquidity Profile
Tricon’s liquidity profile has continued to improve significantly compared to last year, and near-term debt
maturities present an opportunity to refinance at lower prevailing interest rates.
Debt Maturity Schedule Improved Liquidity Profile ($M)
(including Tricon’s extension options)
Q1/21 Q1/20
Credit Facility $500 $500
$1,400 Less: Amounts Drawn -$19 -$326
Corporate Plus: Unrestricted cash $295 $53
$1,197
$1,200 SFR Total $776 $227 +242%
Development y/y
$1,000 $886
$800
$600
$440
$373
$400 $313
$200 $143
$0
$0
2021 2022 2023 2024 2025 2026 2027
• $41M development debt – to be repaid or • $471M SFR Term Loan – to be partially
refinanced in 2021 repaid with cash on hand Blended rate of 2.97%
with potential to be
• $102M SFR subscription line – to be repaid • $459M 2017-1 SFR Securitization – to
refinanced at lower
jointly by Tricon and investors in JV-1 be refinanced
prevailing interest rates
• $236M SFR JV Warehouse Facilities –
to be refinanced
21Our Key Priorities1
• Provide stable, predictable income for shareholders by focusing on defensive
Grow FFO per rental housing
Share • Target 10%+ compounded annual growth rate in FFO per Share over three years
• Raise third-party capital in all our businesses to enhance scale, improve
Increase Third-Party operational efficiency, and drive return on equity with incremental fee income
AUM
• Add new third-party equity capital commitments of ~$1B over three years
Grow Book Value • Build shareholder value by deploying our free cash flow into accretive growth
per Share opportunities focused on rental housing
• Minimize corporate-level debt while maintaining prudent and largely non-recourse
Reduce Leverage leverage at the business segment or asset level
• Pursue consolidated leverage target of 50-55% net debt to assets
• Adopt financial disclosure practices that reduce complexity and improve
Improve Reporting comparability of results with real estate peers
1. Refer to the Forward-Looking Statements on page 1.
22Performance Dashboard1
Grow FFO per Share Increase Third-Party AUM Grow Book Value per Share
Target 10%+ compounded Tricon has met its target of raising $2B 17% annualized growth since entering
annual growth of fee-bearing equity capital ahead of SFR in 2012
schedule C$11.06
59% increase year-
over-year
$2.0B
$0.3B CA MF
$0.4B U.S. MF
$0.52 to C$3.01
$1.0B
$0.57
$0.463 $1.3B SFR
$0.29 2012 2013 2014 2015 2016 2017 2018 2019 2020 Q1/21
Book Value per Share does not fully capture the value
2019 2020 2022 Target 2021 YTD 2022 Target from embedded growth in underlying investments or the
Private Funds & Advisory business segment
Reduce Leverage2 Improve Reporting
Q1/21 Consolidated
2019 Consolidated
Leverage – Targeted
Leverage
Range Achieved Tricon has achieved its □
✓ Adopt consolidated accounting
leverage target of 50- □
55% net debt to assets
✓ Adopt more conventional company-
39% wide real estate performance metrics,
on a consolidated
51% 49% such as FFO / AFFO per share
basis, ahead of
schedule □
✓ Enhance financial disclosure practices
61%
□
✓ Adopt comprehensive ESG plan
(46% proportionate
Equity Debt
leverage)
1. Refer to “General” and “Forward-Looking Statements” on Page 1, USD./CAD exchange rate used are 1.2660 at March 31, 2021
2. All debt figures are presented net of cash and exclude Tricon’s outstanding 5.75% convertible debentures
3. Jacksonville,
The comparative period results have been recast to present the consolidated results in conformity FLperiod presentation. Please refer to MD&A for further details.
with the current
23Upcoming Catalysts1
Syndication of U.S. multi-family portfolio
Reduce leverage
Raise third-party capital across all residential strategies
Grow single-family rental portfolio
Cash generation from legacy for-sale housing assets
Construction and stabilization of Canadian multi-family developments
1. Refer to the Forward-Looking Statements on Page 1
24Gary Berman Wissam Francis Wojtek Nowak
President and Executive Vice President Managing Director,
Chief Executive Officer and Chief Financial Officer Capital Markets
wfrancis@triconresidential.com wnowak@triconresidential.com
triconresidential.comYou can also read