Results presentation Berlin, 30 November 2020 - ADLER Real Estate AG
←
→
Page content transcription
If your browser does not render page correctly, please read the page content below
Results presentation Berlin, 30 November 2020

Adler Group | Third quarter results 2020

Welcome to the Adler Group
                                                                                                                               Well diversified €14.6bn pan German
Adler in short                                                          Driving future growth                                  residential real estate portfolio
Rental units1                     EPRA NAV                              Adler is a pure play German residential
                                                                        company with a unique development                                     Schleswig-Holstein          Mecklenburg-

70,741                            €45.27
                                                                                                                                                                       Western Pommerania
                                                                        pipeline, striving to deliver sustainable                                     1,803
                                                                                                                                                                                 1,015
In operation                      Per share                             shareholder value by:                                    Lower Saxony             Hamburg
                                                                                                                                     15,631                   2,000       Brandenburg
                                                                                                                                                Bremen
                                                                        1. Managing the core portfolio to grow earnings                                                         3,703
                                                                                                                                                 1,516
                                                                           and improve EBITDA margins                                                                 Saxony-           Berlin
Average rent/ month1              LTV                                        -   Like for like rental growth                                                          Anhalt            1,000        19,193
                                                                             -   Reduction in vacancies
                                                                                                                                                                      3,877
€6.55                             53.0%                                 2. Optimising the portfolio and recycling capital
                                                                                                                              North Rhine-Westphalia
                                                                                                                                 4,000    12,165                                        Saxony
Per   m2   in top 13              Pro-forma2                               through selective acquisitions and sales                                           Thuringia                  9,617
                                                                                                                                              Hesse             1,938
                                                                        3. Adding value through development and                               2,000                                              Development Portfolio

Vacancy1                          FFO I                                    modernisation – driving organic growth                                                                                residential units

                                                                             -   Elevating quality of portfolio                                       other units
                                                                                                                                                                                                 Portfolio of residential
                                                                             -   Improving energy efficiency                                              283

2.5%                              €1.06
                                                                                                                                                                                                 rental units

                                                                        4. Simplifying capital structure                                   Baden-
Of top 13 rental portfolio        Per share                                                                                              Wuerttemberg
                                                                             -   Reducing LTV (mid term target 50%)
                                                                             -   Targeting investment grade rating                            1,500
                                                                             -   Reducing cost of debt

2          1 Calculated based on rental units in operation, hence excluding units under renovation and development projects
           2 Pro-forma for the disposal of non-core Consus’ projects to Partners Immobilien Capital Management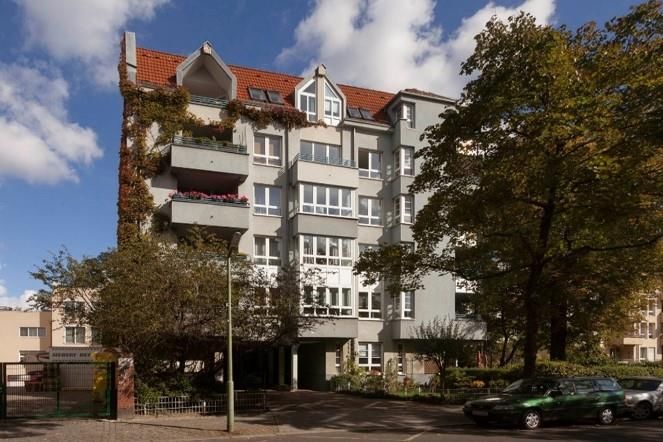
Adler Group | Third quarter results 2020

Highlights – first time consolidation of Consus
                          ▪   €203.2m of NRI realized over the nine months of 2020, up from €101.7m in Q3 19 mainly as a result of the consolidation of Adler per April 2020
    Operational           ▪
                          ▪
                              €6.25/sqm/month average residential rent, up from €6.14/sqm/month in Q3 19
                              1.4% like-for-like rental growth at Q3 20, down from 3.4% in Q3 19 due to the effects of the Berlin rent freeze
    performance           ▪   3.9% vacancy rate, down marginally from 4.1% in Q3 19
                          ▪   €74.7m FFO 1, up from €50.4m in Q3 19, mainly as a result of the consolidation of Adler per April 2020

                          ▪   Rent deferrals relating to COVID-19 as of today stand at 1.2% of the monthly rent, mainly coming from our commercial units
                          ▪   During September we announced the disposal of around 5,000 residential units to a major international real estate company further streamlining the portfolio and leading to a
      Portfolio               200bps reduction in LTV. The portfolio was generating a NRI of €18.6m pa, with an average rent of €5.46 /sqm/month and a vacancy rate of 12%
                          ▪   Investments in the portfolio continue and we have spent €4.8/sqm on maintenance (Q3 19: €4.9) and €13.4/sqm on capex (Q3 19: €17.0/sqm) during the first nine months
                              of 2020 as most of the capex programs in Berlin have been put on hold as a consequence of the Berlin rent freeze

                          ▪   €14.6bn total assets as of Q3 2020, up from €10.4bn at H1 2020, mainly on the back of the consolidation of Consus
      Valuation           ▪   +6.6% value uplift like-for-like realized in the first nine months of 2020
                          ▪   EPRA NAV stood at €4.7bn (NRV: €5.6bn) as of Q3 2020 equating EPRA NAV per share of €45.27 (NRV: €53.46 per share)

                          ▪   3.20% weighted average cost of debt as per the end of Q3 2020 on the back of consolidation of Consus, as of today we have been able to further decrease the weighted
    Financing and         ▪
                              average cost of debt to 2.98% and expect to decrease this going forward
                              Successfully issued two €400m bonds, the first was placed in July at a 3.25% fixed coupon and a 5-year maturity, the second was placed in November at a 2.75% fixed coupon
         LTV                  and a 6-year maturity. The November issue was more than 4.0x oversubscribed with a high-quality book of pan European institutional investors
                          ▪   51.3% net LTV excluding convertibles, 50.1% pro-forma for the disposal of Consus’ projects to Partners Immobilien Capital Management

3
Adler Group | Third quarter results 2020

Agenda

    Operational performance

    Financing structure

    Developments

    Guidance confirmed

    Appendix

4
Operational performance

Adler Group | Third quarter results 2020

Operational highlights, portfolio optimization ongoing
✓                                             ✓                                             ✓                                                 ✓
              Successful sale of
                                                           Vacancy reduction                            Further rent increase                                    Value uplift
               non-core assets

✓ As announced in September, we               ✓ As of the end of Q3 2020, vacancy           ✓ Despite the challenging regulatory              ✓ On the back of further rent increases
    successfully sold c. 5,000 units to an        stands at 2.5% for the top 13 cities of       environment and the ongoing COVID-                and yield compression outside Berlin,
    international real estate investor at a       our rental portfolio                          19 pandemic, like-for-like rental growth          the portfolio has seen a +6.6% value
    premium to latest book values                                                               remains at +1.4% year-to-date as                  uplift like-for-like during the first nine
                                              ✓ The vacancy of the total portfolio stands
                                                                                                expected                                          months of 2020
✓ On the back of the Consus transaction,          at 3.9% at the end of the period
    17 non-strategic development projects                                                   ✓ The portfolio outside Berlin continues to
    with a GAV €0.6bn were sold to Gröner                                                       generate a solid +2.0% like-for-like
    Group GmbH                                                                                  rental growth
✓ 8 non-strategic development projects                                                      ✓ As the Berlin rent freeze regulation has
    with a GAV of €0.4bn will be disposed                                                       entered into effect, realized like-for-like
    to Partners Immobilien Capital                                                              rental growth amounted to +0.4% for
    Management before the end of the year                                                       the first nine months of 2020

6
Adler Group | Third quarter results 2020

Value of the underlying portfolio continues to increase
Development of GAV (€m)                                                        Development of number of units                                               Development of fair value (€/sqm)
 10,000                                                                          90,000                                                                       2,000
                                                          9,396
                                         9,039                                                                        81,807
    9,000                                        8,551                                                                                                        1,800                                                  1,741
                                                                                 80,000                                        75,721
                                                                                                                                                                                                       1,635 1,624
                                                                                                                                        70,741                                                 1,553
    8,000                                                                                                    68,149                                           1,600
                                                                                 70,000             66,362                                                                             1,452
                                                                                           63,957
    7,000                                                                                                                                                     1,400
                                6,325                                            60,000
                                                                                                                                                                               1,215
    6,000                                                                                                                                                     1,200
                                                                                 50,000
    5,000              4,733                                                                                                                                  1,000      905
                                                                                 40,000
    4,000      3,694                                                                                                                                            800
                                                                                 30,000
    3,000                                                                                                                                                       600

                                                                                 20,000
    2,000                                                                                                                                                       400

    1,000                                                                        10,000                                                                         200

       –                                                                               –                                                                           –
               2015     2016    2017     2018     2019     Q3                               2015     2016     2017    2018     2019      Q3                             2015    2016   2017    2018    2019    Q3      Q3
                                                          2020                                                                          2020                                                                  2019    2020

7           Please note that the KPIs presented on this page include ground level commercial units, and exclude units under renovation and development projects and note that the numbers for the years 2015-2019 are provided
            for your convenience and serve for illustrative purposes of combining ADLER Group and ADLER Real Estate only. Metrics have been computed by using weighted averages on the back of publicly available information.
Adler Group | Third quarter results 2020

Positive trend in average monthly rents
Residential average rent (€/sqm/m)                                         LfL residential rental growth YTD                                            Residential portfolio vacancy rate
 7.0                                                                         2.5%                                                                         9.0%

                                        6.2     6.1     6.2                                                                                                        8.0%
                                6.0                                                                                                                       8.0%
 6.0                    5.6                                                                                  2.0%
                5.4                                                          2.0%
        5.1                                                                                                                                               7.0%
 5.0
                                                                                                                                                          6.0%             5.7%

                                                                             1.5%                                              1.4%                                               5.0%
 4.0                                                                                                                                                      5.0%
                                                                                                                                                                                          4.3%
                                                                                                                                                                                                  4.0%    4.1%    3.9%
 3.0                                                                                                                                                      4.0%
                                                                             1.0%
                                                                                                                                                          3.0%
 2.0
                                                                                           0.4%                                                           2.0%
                                                                             0.5%
 1.0
                                                                                                                                                          1.0%

    –                                                                        0.0%                                                                         0.0%
        2015   2016    2017    2018    2019     Q3      Q3                                Berlin        All other cities   Total portfolio                         2015    2016   2017    2018    2019     Q3      Q3
                                               2019    2020                                                                                                                                               2019    2020

8       Please note that the KPIs presented on this page include ground level commercial units, and exclude units under renovation and development projects and note that the numbers for the years 2015-2019 are provided
        for your convenience and serve for illustrative purposes of combining ADLER Group and ADLER Real Estate only. Metrics have been computed by using weighted averages on the back of publicly available information.
Adler Group | Third quarter results 2020

Investments in the rental portfolio continue
Total Capex and Maintenance (€m)                                                                                                         Maintenance expense (€/sqm)
 180.0                                                                                                                                     10.0                 8.9                           8.6
                                                                                                                                            8.0                           7.2
                                                                                                                                                      6.5                           6.7
 160.0
                                                                                                                                            6.0                                                          4.9       4.8
                                                                                 40.8
 140.0                                                                                                                                      4.0

                                                                                                                                            2.0
 120.0
                                                                 34.4                                                                         –
                                                                                                                                                     2015      2016      2017      2018       2019    Q3 2019 Q3 2020
 100.0                                                                                           25.4

    80.0                                         31.3
                                                                                                                                         Capex invested (€/sqm)
                                                                                                                  23.2
                                                                                                                                           30.0                                               26.1
    60.0                         34.4                                            124.3
                                                                                                                                           25.0
                                                                 97.7                                                                                                               18.9
                                                                                                 88.6                                      20.0                                                         17.0
    40.0                                                                                                                                                                 14.7                                     13.4
                 26.6                                                                                                                      15.0
                                                 63.5                                                             65.3                                         10.8
                                 42.0                                                                                                      10.0       5.8
    20.0
                 23.6                                                                                                                       5.0
      –                                                                                                                                       –
                2015             2016            2017            2018            2019          Q3 2019         Q3 2020                               2015      2016      2017      2018       2019    Q3 2019 Q3 2020

                                                     Capex      Maintenance

9          Please note that the numbers for the years 2015-2019 are provided for your convenience and serve for illustrative purposes of combining ADLER Group and ADLER Real Estate only. Metrics have been computed by
           using weighted averages on the back of publicly available information.
Adler Group | Third quarter results 2020

Vacancy reduction and rent increase ongoing
                               Fair Value         Fair Value                             Lettable area               NRI1           Rental yield            Vacancy     Vacancy   Q3 20 Avg. Rent         NRI
Location                                                                     Units
                               €m Q3 20         €/sqm Q3 20                                       sqm            €m Q3 20        (in-place rent)              Q3 20       Δ YoY    €/sqm/month      Δ YoY LFL

Berlin                               3,948               2,967              19,193            1,330,653                116.7                3.0%                 1.4%      0.3%              7.53        0.4%
Leipzig                               444                1,744                4,746             254,629                 17.6                4.0%                 3.0%     -2.0%              6.01        4.7%
Wilhelmshaven                         393                  970                6,890             405,194                 23.8                6.1%                 4.3%     -2.8%              5.20        2.8%
Duisburg                              339                1,111                4,923             305,003                 19.8                5.8%                 1.9%     -0.8%              5.58        0.7%
Wolfsburg                             150                1,708                1,301              87,614                   6.5               4.3%                 2.2%      0.0%              6.41        0.6%
Göttingen                             144                1,692                1,377              85,238                   6.1               4.3%                 1.5%     -1.3%              6.11        2.4%
Dortmund                              139                1,356                1,769             102,251                   7.1               5.2%                 1.8%     -0.8%              5.97        2.8%
Hanover                               127                2,011                1,112              63,253                   5.4               4.3%                 1.2%     -1.1%              7.32        2.8%
Kiel                                  120                1,798                  970              66,768                   5.5               4.6%                 1.3%      0.2%              7.05        3.5%
Düsseldorf                            114                3,106                  577              36,719                   3.5               3.1%                 1.7%     -1.0%              8.20        0.6%
Halle (Saale)                           94                 889                1,858             105,892                   5.5               5.8%               11.2%       0.2%              4.94       -0.5%
Essen                                   91               1,377                1,043              66,341                   4.5               5.0%                 2.1%     -1.8%              5.88        3.6%
Cottbus                                 86                 782                1,868             110,045                   6.0               6.9%                 5.7%     -0.8%              4.82        1.3%
Top 13 total                        6,189                2,050              47,627           3,019,600                 228.2                3.7%                2.5%      -0.4%              6.55       1.3%
Other                                1,577               1,094              23,114            1,441,457                 87.8                5.6%                 6.7%      0.1%              5.59        1.5%
Total                               7,766                1,741              70,741           4,461,057                 316.0                4.1%                3.9%      -0.2%              6.25       1.4%

10         Please note that, for all KPIs in the table ground level commercial units are included, and units under renovation and development projects are excluded
           1. Annualized
Financing structure
Adler Group | Third quarter results 2020

Financial highlights, already refinanced €1.9bn in 2020
✓                                                       ✓                                                       ✓                                                      ✓
                                                                       Secured financing                                         Financing and                                          Refinancing of
                 Rights issue
                                                                         and extended                                                                                                 mezzanine debt and
              & Bond placement                                                                                                        LTV
                                                                          maturities                                                                                                  synergy generation
✓ Completion of €457m rights issue with                 ✓ Secured market remains attractive for                 ✓ 3.20% weighted average cost of debt                  ✓ Financial integration process and
     98% take-up closed on 21 July 2020                     financing opportunities                                 as per the end of Q3 2020 on the back                     synergy realization on track
                                                                                                                    of consolidation of Consus
✓ Successful bond placement of €400m                    ✓ Secured financing of a volume of                                                                             ✓ Repayment of €479m of mezzanine
     with a 5-year maturity and a 3.25%                     €677m at 2.1% cost of debt to further               ✓ Successful recent bond issuance at                          loan with a WACD at 12% to
     fixed coupon on July 29, 2020 to partly                reduce financing costs for the group                    2.75% fixed coupon bond bringing the                      significantly reduce expensive debt,
     repay outstanding bridge facility                                                                              average cost of debt to 2.98% as of                       generating €41m in savings on interest
                                                        ✓ The secured financing has an average                      today                                                     costs as of Nov 30, 2020
                                                            maturity of around 4.7 years and
✓ Additional bond placement of €400m                        extends our maturity profile on group
     with a 6-year maturity and a 2.75%                     level                                               ✓ LTV on a pro-forma basis around                      ✓ Further refinancing synergies and
     fixed coupon on November 09, 2020 to                                                                           50.1% (excl. convertible) and 53.0%                       extension of maturities to be crystallized
     refinance existing indebtedness                                                                                (incl. convertible)                                       in Q4 2020 by repaying more expensive
                                                                                                                                                                              and short-dated liabilities

12       Please note, KPIs on this page have been adjusted for the disposal of Consus’ projects to Partners Immobilien Capital Management, expected to be closed in Q4 2020
Adler Group | Third quarter results 2020
Potential to further improve financial KPIs
Net loan to value Weighted average cost of debt Interest coverage ratio
70% 3.5% 3.3% Pro-forma 3.5
3.2%
63.3%
Pro-forma 2.9% 3.0% 3.0
60% 3.0% 3.0 2.8
Pro-forma
53.8% 54.1% 53.0%
51.0% 52.9% > 2.4
50% 2.5% 2.5 2.4 2.4
2.2% 2.3
44.5%
2.0%
40% 2.0% 1.9% 2.0
1.8
30% 50.1% 1.5% 1.5
51.3%
20% 1.0% 1.0
10% 0.5% 0.5
0% 0.0% –
2015 2016 2017 2018 2019 Q3 PF 2015 2016 2017 2018 2019 Q3 PF 2015 2016 2017 2018 2019 Q3 PF
2020 2020 2020
▪ The group anticipates a further strengthening of the capital structure as well as improvements of the average cost of debt and the average maturity
13 Please note, the following KPIs; Pro-forma LTV, WACD and Pro-forma WACD on this page have been adjusted for the disposal of Consus’ projects to Partners Immobilien Capital Management, expected to be closed in Q4
2020Adler Group | Third quarter results 2020
Well balanced debt maturity profile offers opportunities
Debt maturity schedule (€m) Debt KPIs Sources of funding
Total interest-bearing debt (€m) 7,911 Developments
2,500
Undrawn facilities (€m) 100 16%
53.0%1/ 50.1%1
Net LTV / Pro-forma LTV 8%
2,000 €250m already 54.1%2/ 51.3%2
4%
refinanced
ICR (x) / Pro-forma ICR 2.4 / >2.4
1,543
1,500 1,448 1,477 Fixed / hedged debt 88.4%
46%
Unsecured debt 48.5%
1,001 871
1,000 Weighted average cost of debt 3.20%
454 695 42%
Weighted average maturity 3.2 years
500 422
Corporate rating S&P BB
Outlook S&P Stable 84%
0
2020 2021 2022 2023 2024 2025 2026 >2027 Corporate rating Moody’s Ba2 Rental
Bank debt Bridge loan
Corporate bonds Convertibles Outlook Moody’s Stable
Bank Debt Corporate bonds
Bank debt negotiations Bond rating S&P BB+ Convertible Bridge loan
▪ 2020 maturities: €101m has been repaid, €14m will be repaid, € 112m has been extended and € 195m are in advanced stages of
prolongation/refinancing as of November 30, 2020
▪ 2021 maturities: €325m are already in advanced stages of refinancing discussions as of November 30, 2020
▪ Bridge facility: €250m of the bridge has been refinanced with a new bond issued at the 9th of November 2020
14 Please note, all KPIs, except Net LTV and ICR, have been adjusted for the disposal of Consus’ projects to Partners Immobilien Capital Management
1 Excluding convertibles
2 Including convertiblesDevelopments
Adler Group | Third quarter results 2020

Enhanced focus on top 7 cities and newly built flats
                      The portfolio today – Berlin anchored                                                                          The portfolio in the future1
                                                                                                                                                                         Other
 Geographical split

                                                                                                                                                                               24.3%
                                                                                                                                                                                                            Berlin
                                            Other                                                                                                                                                   36.8%
                                                    42.0%
                                                                           50.8% Berlin

                                                            7.2%                                                                                                                     38.9%

                                                         Top 7                                                                                                                    Top 7

                                                               4.0%                                                                                                                       2.0%
                                                                                                                                                                                           0.7%
                                                       12.0%
 Sector split

                                                    10.8%      GAV                                                                                                                          GAV
                                                             €11.4bn                                                                                                                      €13.5bn

                                                                        73.2%

                                                                                                                                                                                          100.0%

                                                                                  Residential rental portfolio    Build-to-hold     Forward- & Condo Sales        Non-strategic
16                     1 Assumes that the full €5.2bn of GDV has been completed, therewith transferring the current 10.8% of build-to-hold GAV to the residential rental portfolio
Adler Group | Third quarter results 2020
Pipeline with €5.2bn worth of future rental product
Projects under Build-to-Hold strategy Portfolio overview
Construction Yield on cost2
# Project Name City Area (k sqm) GAV (€m) GDV (€m)
Period (%)
Hamburg
1 Wasserstadt - Kornspeicher & Building 7 Berlin 2018-2024 11.1 54.5 98.5 4.8%
2
2 Schwabenland Tower (Residential)1 Stuttgart 2019-2021 11.5 48.9 82.3 3.9% 0.4 188
3 Böblingen Stuttgart 2019-2022 9.3 25.4 55.2 3.9%
132
3
4 Grafental II - WA 12 & WA 13 social Düsseldorf 2020-2023 29.1 14.5 109.2 3.5% Berlin
323 2 0.1
Düsseldorf
5 Neues Korallusviertel Hamburg 2020-2024 38.0 35.9 175.9 3.7% 0.3
6 COL III (Windmühlenquartier) Cologne 2021-2024 24.2 36.2 136.8 5.0% 24
Cologne 0.04 1
7 Holsten Quartiere Hamburg 2021-2026 150.0 319.2 942.6 4.3%
Frankfurt 0.1
8 Grand Central Düsseldorf 2022-2025 78.5 180.0 565.3 3.7% 1 43
9 VAI Campus (without Eiermann)1 Stuttgart 2022-2028 163.4 205.9 952.3 4.5%
10 Benrather Gärten Düsseldorf 2023-2030 215.5 115.3 1,128.1 5.0%
184 Stuttgart
1
11 Schönefeld Nord - (Residential) Berlin 2024-2030 121.2 85.5 606.8 5.0% 3
0.3
12 Ostend Frankfurt 2026-2028 42.6 112.0 300.8 4.2%
Total 3 894.0 1,231.2 5,153.8 4.5%
€bn GAV Projects
Area (sqm): ~894 k sqm
17 1 GDV and GAV split based on corresponding area Number of projects: 12
2 Yield on cost has been calculated based on underwriting ERV / expected total cost, including land
3 Includes ADLER Real Estate Build-to-Hold development projectAdler Group | Third quarter results 2020
Expected capex requirements of build to hold projects
Annual overview of envisaged capex for the build to hold development projects (€m)
495
Envisaged capex Annual capex as % of 475
GAV1
Avg.
381 €380m
346
CAPEX
P.A.
185
37
2020 2021 2022 2023 2024 2025
0.3% 1.6% 3.0% 3.3% 4.2% 4.3%
Capex is expected to be funded on project level with a 65-70% Loan-to-Cost and active capital recycling
18 1 GAV calculated as investment properties including inventories (€11.4bn)Guidance confirmed
Adler Group | Third quarter results 2020

Synergies at top end of guidance - €71m realised
Achievements                                       Run-rate synergies realized year-to-date (€m)
During 2020 we expect to be able to meet all          Operational synergies       Financial synergies    Expected synergies
synergy targets and will continue to work on the
realization of the 2021 targets
                                                                                                                                                             72
                                                                                                                                                                  2020E
                                                                                                                              9.0
2020E synergy targets:                                                                                                                                       63
                                                                                                                                                                  Target

✓ Total financing synergies: €50-54m

                                                                                                                                         50.0
✓ Total operational synergies: €13-18m                                                                             41.0
                                                                                                                                                   70.8
✓ Total synergies: €63-72m

                                                                                             3.3
                                                                                 6.4
                                                                  0.3                                   20.8
                                                      10.8

                                                    Platform     Board        Marketing Expected in   Total   Refinanced Expected in    Total     Synergy
                                                    savings                              December operational Consus debt December    financial   realized
                                                                                                    synergies                        synergies     2020E
20
Adler Group | Third quarter results 2020
2020 guidance confirmed despite COVID-19
Objectives 2020 Key takeaways
2020 Guidance
(i.e. combining the companies as of the
effectuation in April 2020)
▪ The acquisition of ADLER has been successfully completed and
Net rental income (€m) €280-300m Consus has been consolidated
FFO I (€m) €105-125m
▪ Synergies realized at the end of the year are at the upper end of
Dividend (€/share) 50% of FFO I the guidance (€71m)
▪ Successfully refinanced €479m of mezzanine debt with a WACD
of 12%, leading to run-rate interest savings of €41m
▪ We placed two €400m bonds to refinance existing facilities,
extending maturities whilst lowering WACD
▪ And finally our outlook for 2020 is reiterated
Ahornstraße Steglitz Allerstr. 46 Neukölln
21Appendix
Adler Group | Third quarter results 2020

Guidance - Net rental income for FY20E of €280-300m
NRI in the range of €280-300m for existing portfolio for 2020E                                                                                                              Legend
                                                                                                                                                                        1   First full year effect from the €920m disposal of
                                                                                                                                                                            5,900 units to Gewobag effective 1 December 2019

                                                                                                     60                                                                 2   Berlin rental growth at zero under new legislation
                                                                                                                                                        280-300
                                                                                                                                                                        3   Letting activity in Q4 19 lowering vacancy whilst
                                                                                                                                                                            adding to NRI

                                                                                                                                                                        4   Downward adjustment of rents to caps under new
                                                                                       249                                                                                  legislation initially at -€1.2m in 2020E (-€9.4m in
                                                                                                                                                                            2021E)

                                                                                                                                                                        5   First full year effect from €345m 2019 and
                                                                                                                                                                            anticipated closings in 2020 of BCP commercial
                                                                                                                                                                            asset disposals
     134
                   27                                                    106                                                                                                Lease-up phase of Riverside development in Berlin
                                 0                           1                                                                                                          6
                                                                                                                                                                            scheduled for completion

                                                                                                                                                                        7   Organic rental growth for 2020

                    1             2             3            4                                                      5            6             7             8          8   The combined expected NRI for ADLER Group is
                                                                                                                                                                            €280-300m. Please note that ADLER Group has
ADO FY19 Gewobag              Rental       Lettings Mietendeckel FY20 PF             ADLER        ADLER Commercial Riverside               Rental      Combined             consolidated ADLER post-closing (April 2020),
                              growth        Q4 19                                     FY19        Q1 20  disposal                          growth       FY20E               which means consolidated NRI for the full year run
                                                                                                                                                                            rate would have been €340-360m
23         The numbers reflected concern the 2020E full-year run-rate. Please note that as a result of the accounting treatment of the merger, the accounts will only
           be consolidated from April 2020 onwards and as such will reflect a lower reported number and the ADLER Q1 20 result will be reflected directly in equity.
Adler Group | Third quarter results 2020
Guidance - FFO I for FY20E of €105-125m
FFO I of €105-125m generated by existing portfolio* for 2020E Legend
1 First full year effect from the €920m disposal to
Gewobag, corrected for impact of lower overhead
12 and lower financing costs
2 First full year effect from €345m 2019 BCP retail
105-125 asset disposals, corrected for impact of lower
overhead and financing costs
3 Downward adjustment of rents to caps under new
84
legislation
4 Lease-up phase of Riverside development in Berlin
5 Berlin indexation at zero under new legislation, but
indexation and reversionary in the rest of Germany
to continue at a rate of c. 2% LFL
6 First operational synergies expected to be visible in
2020
63 7 The combined expected FFO I for ADLER Group is
€105-125m. Please note that ADLER Group has
consolidated ADLER post-closing (April 2020),
1 2 3 4 5 6 7 which means consolidated FFO I for the full year run
rate would have been €120-140m
ADO FY19 ADLER FY19 ADLER Gewobag Commercial Mietendeckel Riverside Rental Synergies Combined
Q1 20 disposal growth FY20E
24 *Illustrating the run rate impact of synergies to be realized in 2020E, excluding one off expenditures related to the integration.
The numbers reflected concern the 2020E full-year run-rate excluding Consus. Please note that as a result of the accounting treatment of the merger, the accounts will only be consolidated from April 2020 onwards and as such
will reflect a lower reported number and the ADLER Q1 20 result will be reflected directly in equity.Adler Group | Third quarter results 2020
Profit & Loss statement
P&L statement Comments
In € thousand, except per share data 9M 2020 1 9M 2019 •1 Net rental income increased on the back of solid like-for-like rental growth of 1.4% and
Net rental income 203,223 101,727 consolidation of ADLER into the Group.
Income from charged costs of utilities 45,966 -
Income from property development 141,506 - •2 Costs of operations mainly relate to costs of rental operations (salaries and other expenses,
Other revenue 26,187 17,898 costs of apportionable utilities, costs for property operations/ maintenance ), costs relating
Revenue 416,882 119,625 to the selling of condominiums and cost of property development. The increase in costs of
(221,637) 2 (32,573)
Cost of operations operations is split between increase due to the cost of rental operations (€87m) coming
Gross profit 195,245 87,052 from consolidation of ADLER and costs of property development (€73m) attributable to
General and administrative expenses (66,872) (14,666) first time consolidation of Consus.
Other expenses (51,638) (10,815)
90,744 3 -
Other income •3 The preliminary purchase price allocation of ADLER resulted in a gain from bargain
Changes in fair value of investment properties 189,084 4 342,766
purchase of €75m, which was recognized in other income. The remaining other income
Results from operating activities 356,563 404,337
5
relates mainly to the reduction of existing liabilities.
Net finance income / (costs) (212,875) (17,422)
Net income from investments in associated companies (1,373) -
•4 Changes in the fair value of investment properties for the first nine months of 2020
Income tax expense (42,566) (58,843)
amount to €189m mainly relating to the residential portfolio netted off by decrease in fair
Profit for the period 99,749 328,072
values of commercial assets due to the impact of COVID-19 (€11m).
•5 The increase in net finance costs is mainly due to consolidation of ADLER and Consus.
25Adler Group | Third quarter results 2020
FFO I and FFO II
FFO I calculation FFO II calculation
In € thousand, except per share data 9M 2020 9M 2019 In € thousand, except per share data 9M 2020 9M 2019
Net rental income 203,223 101,727 Income from rental activities 266,114 107,494
Income from facility services and recharged utilities costs 62,891 5,767 Income from property development 141,506 2 -
Income from rental activities 266,114 107,494 Income from other services 4,538 -
Costs from rental activities (101,916) (23,903) Income from selling of trading properties 4,724 12,131
Net operating income (NOI) from rental activities 164,197 83,591 Revenue 416,882 119,625
Overhead costs from rental activities (30,427) (11,158) Cost from rental activities (101,916) (23,903)
EBITDA from rental activities 133,771 1 72,433 Other operational costs from development and
Net cash interest (50,346) (20,422) privatisation sales (111,920) (8,760)
Current income taxes (4,688) (1,592) Net operating income (NOI) 203,045 87,052
Interest of minority shareholders (3,999) - Overhead costs from rental activities (30,427) (11,158)
Overhead costs from development and privatisation
FFO I (from rental activities) 74,738 50,419 sales (14,909) -
No. of shares(*) 70,565 44,151 EBITDA Total 157,710 75,894
FFO I per share 1.06 1.14 Net cash interest (68,173) 3 (20,422)
Current income taxes (11,868) (3,304)
Maintenance capital expenditures (5,774) (10,437) Interest of minority shareholders (3,999) -
AFFO (from rental activities) 68,964 39,982 FFO II 73,670 52,168
The number of shares is calculated as weighted average for the reported period. No. of shares(*) 70,565 44,151
FFO II per share 1.04 1.18
1• EBITDA from rental activites increased on the back of the consolidation of ADLER into the
group as per April 2020, clearly the disposal to Gewobag, the Berlin Rent freeze and the The number of shares is calculated as weighted average for the reported period.
recent disposal of 5,000 units imposed a dampening effect
2• As a result of the consolidation of Consus since the beginning of the third quarter, FFO II
reflects the income from property development generated by Consus
3• Net cash interest in FFO II also reflects the additional interest from financing related to the
landbank and ongoing development projects of Consus
26Adler Group | Third quarter results 2020
Balance sheet
Balance sheet Comments
In € thousand Q3 2020 FY 2019 ▪1 The fair value of the portfolio was assessed by CBRE & NAI Apollo and shows the impact of
Investment properties including advances 10,039 1 3,631 positive revaluation of the combined group for the first nine months of 2020.
Other financial asset 363 99
Goodwill 589 2 - ▪2 Goodwill is arising from the acquisition of Consus on the back of the assessment of
Other non-current assets 239 202 preliminary purchase price allocation.
Non-current assets 11,230 3,932
3 ▪3 The increase in inventories is mainly due to the first-time consolidation of Consus given
Inventories 1,348 26
that project developments, which are to be sold, are administered as inventories and
Contract assets 374 -
contract assets, rather than investment properties.
Cash and cash equivalents 378 388
Other current assets 857 4 51 ▪4 Other current assets include among others restricted bank deposits, and receivables. The
Current assets 2,957 464 increase is mainly due to the consolidation of ADLER and Consus.
Non-current assets held for sale 383 -
Total assets 14,570 4,396 ▪5 The rise in interest bearing debt is attributable to the consolidation of ADLER and Consus.
Interest-bearing debt 8,290 5 1,332
Other liabilities 1,016 6 127 ▪6 Other liabilities contain prepayments received, payables and derivatives amongst others.
Deferred tax liabilities 849 239 The increase is mainly due to the consolidation of Consus.
Total liabilities 10,155 1,658
Non-current liabilities held for sale* 31 -
Total equity attributable to owners of the Company 3,767 2,647
Non-controlling interests 617 51
Total equity 4,384 2,698
Total equity and liabilities 14,570 4,396
27Adler Group | Third quarter results 2020
EPRA NAV and EPRA NRV
EPRA NAV calculation EPRA NRV calculation
In € thousand, except per share data Q3 2020 FY 2019 In €thousand, except per share data Q3 2020 FY 2019
Total equity attributable to owners of the Company 3,775,081 1 2,646,792 Total equity attributable to owners of the Company 3,775,081 1 2,646,792
Fair value of derivative financial instruments 5,754 6,150 Fair value of derivative financial instruments 5,754 6,150
Deferred taxes 950,547 257,249 Deferred taxes 950,547 257,249
Revaluation of trading properties 12,658 13,410 Revaluation of trading properties 12,658 13,410
EPRA NAV 4,744,040 2,923,601 Real estate transfere tax 858,266 3 324,183
No. of shares 104,786 1 44,195 EPRA NRV 5,602,306 3,247,784
EPRA NAV per share 45.27 2 66.15 No. of shares 104,786 1 44,195
Convertible bonds 97,277 156,334 EPRA NRV per share 53.46 2 73.49
EPRA NAV fully diluted 4,841,317 3,079,935 Convertible bonds 97,277 156,334
No. of shares (diluted) 106,703 46,929 EPRA NRV fully diluted 5,699,583 3,401,118
EPRA NAV per share fully diluted 45.37 65.63 No. of shares (diluted) 106,703 46,929
EPRA NRV per share fully diluted 53.42 72.54
1• The changes in equity versus FY19 are the combined effects of both the acquisition of
ADLER and Consus as well as the successfully completed rights issue
2• The EPRA NAV stood at €45.27/share at the end of the quarter, whereas EPRA NRV
amounted to €53.46 /share
3• The structural difference between EPRA NAV and NRV is the correction for Real Estate
Transfer taxes which is made in the calculation of NRV
28Adler Group | Third quarter results 2020
Net LTV
LTV calculation Comments
In € thousand Q3 2020 FY 2019 ▪1 On the back of the combined consolidation of both ADLER and Consus into the group, the
Corporate bonds, other loans and borrowings and other associated debt has increased in line with the increased size of the portfolio
7,966,619 1 1,223,201
financial liabilities
▪2 The net financial liabilities are adjusted for selected financial assets like purchase price
Convertible bonds 323,663 156,334
receivables, granted loans and held bonds; amongst others, they include 1) loans granted
Cash and cash equivalents (377,601) (387,558) (€416m) 2) trade receivables from the sale of real estate investments (€340m) and 3)
Selected financial assets (919,781) 2 (98,871) other financial assets (€163m)
Net contract assets (410,237) 3 - ▪3 In relation to the Group’s development activities, an adjustment is made for the net
Assets and liabilities classified as held for sale (351,877) 4 - position of contract assets and liabilities, basically reflecting unbilled receivables
Net financial liabilities 6,230,786 893,106
▪4 As announced in September, the Group has entered into an agreement for the sale of
Fair value of properties (including advances) 11,431,808 3,670,023 c.5,000 units which is expected to close by the end of 2020
Investment in real estate companies 89,449 186,158
▪5 As of the reporting date, our Loan-to-Value (LTV) excl. convertible is 51.3% (incl.
Gross asset value (GAV) 11,521,257 3,856,181
convertible 54.1%)
Net Loan-to-Value 54.1% 23.2% ▪6 At the end of the year we are expecting a pro-forma LTV excl. convertible of 50.1% (incl.
5 convertible 53.0%) thanks to the anticipated closing of the sale of Consus’ non-core
Net Loan-to-Value excluding convertibles 51.3% 19.1% projects to Partners Immobilien Capital Management
Pro-forma Net Loan-to-Value 53.0% -
Our goal is to deleverage the company and improve our financial KPIs further. Our sustainable
6 financing strategy targets an LTV ratio of 50% in the mid-term.
Pro-forma Net Loan-to-Value excluding convertibles 50.1% -
29Adler Group | Third quarter results 2020
Composition of the Board of Directors
Dr. Peter Maser Arzu Akkemik
Maximilian Rienecker Thierry Beaudemoulin
Chairman Director
Executive Director Executive Director
German, born in 1961 Turkish, born in 1968
German, born in 1985 French, born in 1971 Fund manager and founder
Partner Deloitte Co-CEO Adler Group Co-CEO Adler Group Cornucopia Advisors Limited
Claus Jorgensen Thomas Zinnöcker
Thilo Schmid Dr. Michael Bütter
Director Director
Director Director
Danish, born in 1965 German, born in 1961
German, born in 1965 German, born in 1970
Head of EMEA Credit CEO ISTA International and
Investment Manager Care4 CEO Union Investment Real
Trading Mizuho Chairman ICG (Corp.
Estate
Governance)
30Adler Group | Third quarter results 2020
Experienced management team with a real estate track record
Maximilian Rienecker Thierry Beaudemoulin Sven-Christian Frank Jürgen Kutz Theodorus Gorens
Co-Chief Executive Officer Co-Chief Executive Officer Chief Legal Officer Chief Development Officer Chief Integration Officer
Carsten Wolff Thorsten Arsan Michael Grupczynski Gerrit Sperling
Group Accounting Group Financing Innovation & New Services Portfolio Management & Transactions
17 years 19 years 3 years 23 years
real estate experience real estate experience real estate experience real estate experience
Dennis Heffter Andreas Mier Hans-Ulrich Mies Markus Rübenkamp
Letting Property Management East Property Management West Architecture
20 years 23 years 36 years 32 years
real estate experience real estate experience real estate experience real estate experience
31Adler Group | Third quarter results 2020
Selected development projects in detail (1/2)
Cologne Dusseldorf Dusseldorf
COL III Benrather Gärten Grand Central
GDV (€m): 136.8 GDV (€m): 1,128.1 GDV (€m): 565.3
Yield on cost: 5.0% Yield on cost: 5.0% Yield on cost: 3.7%
GLA (K sqm): 24.2 GLA (K sqm): 215.5 GLA (K sqm): 78.5
Completion: 2024 Completion: 2030 Completion: 2025
Additional details Additional details Additional details
GAV (€m) 36.2 GAV (€m) 115.3 GAV (€m) 180.0
Construction start: 2021 Construction start: 2023 Construction start: 2022
Residential (%): 69.1% Residential (%): 17.5% Residential (%): 77.8%
Number of residential units: 363 Number of residential units: 1,330 Number of residential units: 914
Status: Working on zoning plan Status: Working on zoning plan Status: Building permit in place
32Adler Group | Third quarter results 2020
Selected development projects in detail (2/2)
Frankfurt Hamburg Stuttgart
Ostend Holsten Quartiere VAI Campus
GDV (€m): 300.8 GDV (€m): 942.6 GDV (€m): 952.6
Yield on cost: 4.2% Yield on cost: 4.3% Yield on cost: 4.5%
GLA (K sqm): 42.6 GLA (K sqm): 150.0 GLA (K sqm): 163.4
Completion: 2028 Completion: 2026 Completion: 2028
Additional details Additional details Additional details
GAV (€m) 112.0 GAV (€m) 319.2 GAV (€m) 205.9
Construction start: 2026 Construction start: 2021 Construction start: 2022
Residential (%): 61.7% Residential (%): 65.5% Residential (%): 39.7%
Number of residential units: 250 Number of residential units: 1,158 Number of residential units: 1,949
Status: Working on zoning plan Status: Zoning in place Status: Working on zoning plan
33Adler Group | Third quarter results 2020 Disclaimer THIS PRESENTATION AND ITS CONTENTS ARE NOT FOR RELEASE, PUBLICATION OR DISTRIBUTION, IN WHOLE OR IN PART, DIRECTLY OR INDIRECTLY, IN OR INTO OR FROM THE UNITED STATES OF AMERICA, CANADA, AUSTRALIA, JAPAN OR ANY JURISDICTION WHERE SUCH DISTRIBUTION IS UNLAWFUL. This presentation (“Presentation”) was prepared by ADLER Group S.A. (“ADLER”) solely for informational purposes and has not been independently verified and no representation or warranty, express or implied, is made or given by or on behalf of ADLER Group. Nothing in this Presentation is, or should be relied upon as, a promise or representation as to the future. This Presentation does not constitute or form part of, and should not be construed as, an offer or invitation or inducement to subscribe for, underwrite or otherwise acquire, any securities of ADLER Group, nor should it or any part of it form the basis of, or be relied on in connection with, any contract to purchase or subscribe for any securities of ADLER Group, nor shall it or any part of it form the basis of, or be relied on in connection with, any contract or commitment whatsoever. This Presentation is not an advertisement and not a prospectus for purposes of Regulation (EU) 2017/1129. Any offer of securities of ADLER Group will be made by means of a prospectus or offering memorandum that will contain detailed information about ADLER Group and its management as well as risk factors and financial statements. Any person considering the purchase of any securities of ADLER Group must inform itself independently based solely on such prospectus or offering memorandum (including any supplement thereto). This Presentation is being made available solely for informational purposes and is not to be used as a basis for an investment decision in securities of ADLER Group. Certain statements in this Presentation are forward-looking statements. These statements may be identified by words such as “expectation”, “belief', “estimate”, “plan”, “target” or “forecast” and similar expressions, or by their context. By their nature, forward-looking statements involve a number of risks, uncertainties and assumptions that could cause actual results or events to differ materially from those expressed or implied by the forward-looking statements. These risks, uncertainties and assumptions could adversely affect the outcome and financial consequences of the plans and events described herein. Actual results may differ from those set forth in the forward-looking statements as a result of various factors (including, but not limited to, future global economic conditions, changed market conditions affecting the industry, intense competition in the markets in which ADLER Group operates, costs of compliance with applicable laws, regulations and standards, diverse political, legal, economic and other conditions affecting ADLER Group’ markets, and other factors beyond the control of ADLER Group). Neither ADLER Group nor any of its respective directors, officers, employees, advisors, or any other person is under any obligation to update or revise any forward-looking statements, whether as a result of new information, future events or otherwise. No undue reliance shall be placed on forward-looking statements, which speak of the date of this Presentation. Statements contained in this Presentation regarding past trends or events should not be taken as a representation that such trends or events will continue in the future. No obligation is assumed to update any forward-looking statements. This document contains certain financial measures (including forward-looking measures) that are not calculated in accordance with IFRS and are therefore considered “non-IFRS financial measures”. Such non-IFRS financial measures used by ADLER Group are presented to enhance an understanding of ADLER Group's results of operations, financial position or cash flows calculated in accordance with IFRS, but not to replace such financial information. A number of these non-IFRS financial measures are also commonly used by securities analysts, credit rating agencies and investors to evaluate and compare the periodic and future operating performance and value of other companies with which ADLER Group competes. These non-IFRS financial measures should not be considered in isolation as a measure of ADLER Group’s profitability or liquidity, and should be considered in addition to, rather than as a substitute for, net income and the other income or cash flow data prepared in accordance with IFRS. In particular, there are material limitations associated with the use of non-IFRS financial measures, including the limitations inherent in determination of each of the relevant adjustments. The non-IFRS financial measures used by ADLER Group may differ from, and not be comparable to, similarly-titled measures used by other companies. Certain numerical data, financial information and market data (including percentages) in this Presentation have been rounded according to established commercial standards. Furthermore, in tables and charts, these rounded figures may not add up exactly to the totals contained in the respective tables and charts. Accordingly, neither ADLER Group nor any of its directors, officers, employees or advisors, nor any other person makes any representation or warranty, express or implied, as to, and accordingly no reliance should be placed on, the fairness, accuracy or completeness of the information contained in the Presentation or of the views given or implied. Neither ADLER Group nor any of its respective directors, officers, employees or advisors nor any other person shall have any liability whatsoever for any errors or omissions or any loss howsoever arising, directly or indirectly, from any use of this information or its contents or otherwise arising in connection there-with. It should be noted that certain financial information relating to ADLER Group contained in this document has not been audited and in some cases is based on management information and estimates. This Presentation is intended to provide a general overview of ADLER Group’ business and does not purport to include all aspects and details regarding ADLER Group. This Presentation is furnished solely for informational purposes, should not be treated as giving investment advice and may not be printed or otherwise copied or distributed. Subject to limited exceptions described below, the information contained in this Presentation is not to be viewed from nor for publication or distribution in nor taken or transmitted into the United States of America (“United States”), Australia, Canada or Japan and does not constitute an offer of securities for sale in any of these jurisdictions. Any securities offered by ADLER Group have not been, and will not be, registered under the U.S. Securities Act of 1933, as amended (the “Securities Act”), or the securities laws of any state or other jurisdiction of the United States and such securities may not be offered or sold within the United States, except pursuant to an exemption from, or in a transaction not subject to, the registration requirements of the Securities Act and applicable state or local securities laws. This Presentation does not contain or constitute an offer of, or the solicitation of an offer to buy or subscribe for, securities to any person or in any jurisdiction to whom or in which such offer or solicitation is unlawful. Any failure to comply with these restrictions may constitute a violation of applicable securities laws. This Presentation does not constitute investment, legal, accounting, regulatory, taxation or other advice. 34
You can also read


