Commerzbank German Investment Seminar New York, 13-15 January 2014 Dr. A. Stefan Kirsten, CFO
←
→
Page content transcription
If your browser does not render page correctly, please read the page content below

Commerzbank German Investment Seminar
                                     New York, 13-15 January 2014
                                         Dr. A. Stefan Kirsten, CFO
      1 – Syndicate Analyst Presentation – May 2013
© Deutsche Annington Immobilien SE    13-15 January 2014
Overview              Market           Operations    Financing   Financials

  Deutsche Annington: Innovation leader based on a long-term
  vision, operational excellence and unique financing structure

                      A top European real estate play
                                                                                     Built-in growth and enhanced
                                                                                   profitability expected to drive FFO
                                                                                     per share and NAV per share
                Largest player in a highly stable asset
                                                                                                  accretion
                     class – German residential

                                                                                    Entrepreneurial approach to a
                   Industrial-like process approach to                              stable and low-risk asset class
                     operations designed for growth

                Financing strategy in line with leading
                                                                                       Platform for consolidation
                          European peers

© Deutsche Annington Immobilien SE   13-15 January 2014                                                                  2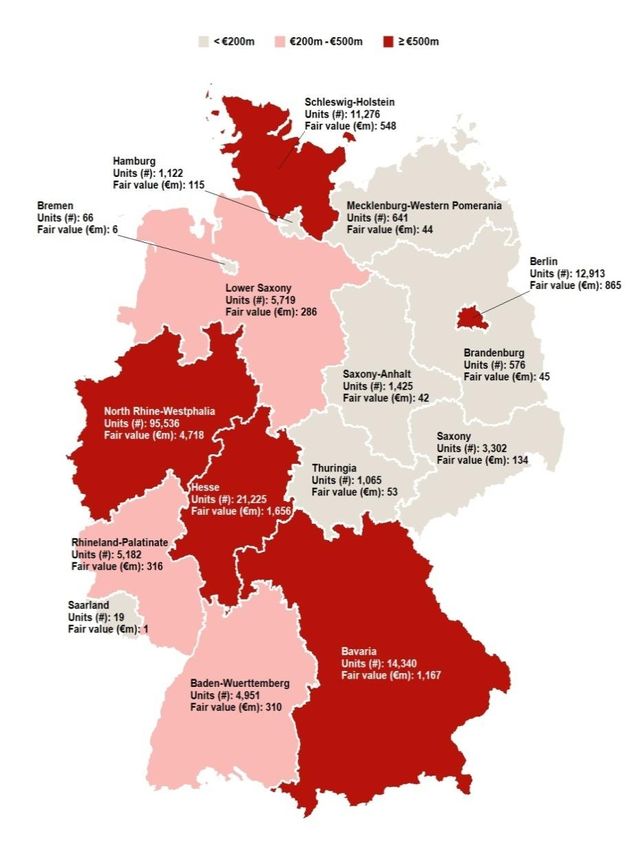
Overview                        Market                     Operations                Financing         Financials

  Attractive asset class supported by favourable environment

         Low home ownership driving rental demand                                                                 High average tenancy length
                                                                                                    85%
                                                                                                                         14,5 yrs
                                                                                 77%
                                                                69%                                                                                        12,0 yrs
                                         58%
                46%

                                                                                                                                                                                             3,7 yrs
                                                                                                                                                                                                                             1,7 yrs

             Germany                   France                   UK                Italy             Spain              Deutsche                        German avg.                       France avg.                         UK avg.
                                                                                                                       Annington
       Source: Federal Statistical Office, Euroconstruct, ifo                                                   Source: Schader Stiftung (Germany), Clameur (France), Association of Residential Letting Agents (UK)

         Favourable household development in Germany (m)                                                          Rent evolution below disposable income growth
                      1 and 2 person households                        3 and more-person households                                                                                  1
                                                                                                                                     Disposable income                           Rent
                                                     Total growth: +2.9%
                                                                                                                   125
                                                                                                                   120
                         40,4                                   41,0                         41,5                  115
                                                                9,6                           8,8                  110
                         10,3
                                                                                                                   105
                                                                                                                   100
                         30,1                                   31,4                         32,8                    95
                                                                                                                           Q1 2003

                                                                                                                                       Q1 2004

                                                                                                                                                 Q1 2005

                                                                                                                                                             Q1 2006

                                                                                                                                                                       Q1 2007

                                                                                                                                                                                   Q1 2008

                                                                                                                                                                                               Q1 2009

                                                                                                                                                                                                         Q1 2010

                                                                                                                                                                                                                   Q1 2011

                                                                                                                                                                                                                               Q1 2012

                                                                                                                                                                                                                                         Q1 2013
                         2010                                   2016                         2025

       Source: BBSR Wohnungsmarktprognose 2009-2025. Projections based on 2009 numbers                          Source: Verband deutscher Pfandbriefbanken, Bundesbank
       1 Rent evolution for multifamily housing

© Deutsche Annington Immobilien SE                   13-15 January 2014                                                                                                                                                                            3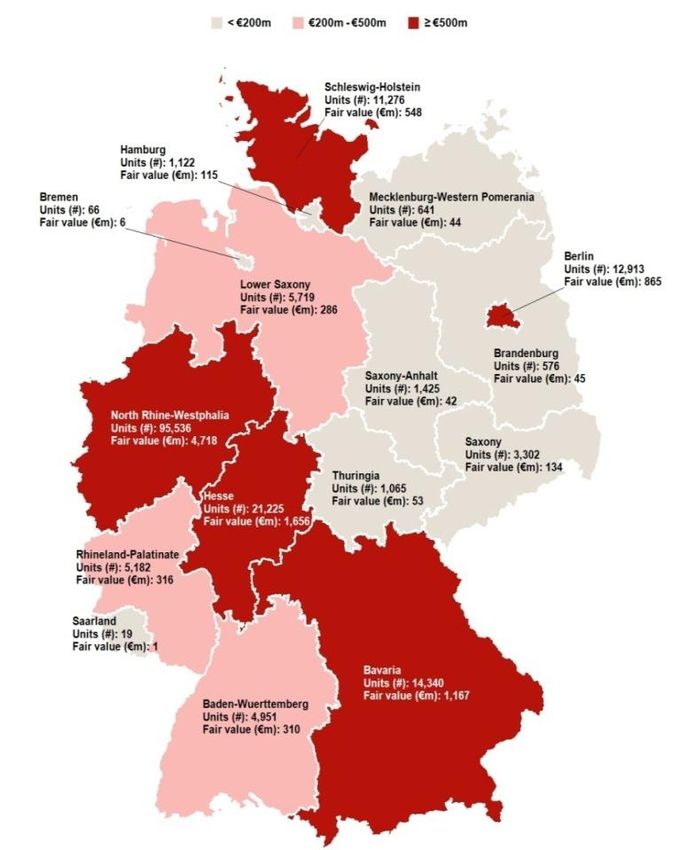
Overview                      Market                    Operations                     Financing                     Financials

  Deutsche Annington’s portfolio footprint benefits from
  continuing supply / demand imbalance

                                    Positive market dynamics …                                                                                                  … benefit Deutsche Annington

           Continuing supply / demand imbalance (units)                                                                              85% of DA’s portfolio in states with strongest rental growth
                         Building completions in Germany                        Housing Demand                                                                 Berlin                                       1,6%
                                                                                                                                                                                                                                       85% of
                                                                                                                                              North-Rhine-Westphalia                                      1,5%
           350.000                                                                                                                                                                                                                   Deutsche
                                                                                                                                                             Bavaria                                    1,4%                        Annington’s
                                                                                                                                                              Hesse                                   1,3%                           fair value5
           300.000
                                                                                                                                                        Baden-Württ.                                1,2%
           250.000                                                                                                                                     Lower Saxony                              1,0%
                                                                                                                                                 Rhineland-Palatinate                            1,0%
           200.000                                                                                                                                          Saarland                         0,7%
           150.000                                                                                                                                     Saxony-Anhalt                       0,6%
                                                                                                                                      Mecklenburg-Western Pomerania                        0,6%                                        15% of
           100.000                                                                                                                                      Brandenburg                        0,6%                                      Deutsche
                                                                                                                                                                                                                                    Annington’s
                                                                                                                                                            Thuringia                      0,6%
            50.000                                                                                                                                                                                                                   fair value5
                                                                                                                                                             Saxony                    0,3%
                                                                                                                                                                 4
                 0                                                                                                                                           Bremen              N/A
                                                                                                                                                                 4
                     2001 2003 2005 2007 2009 2011 2013 2015 2017 2019 2021 2023 2025                                                                       Hamburg              N/A
                                                                                                                                                                 4
                                                                                                                                                   Schleswig-Holstein            N/A
       Source: JLL, BBSR
                                                                                                                                   Source: Destatis, 2010-2012 rental growth p.a.   >5%        >2.5%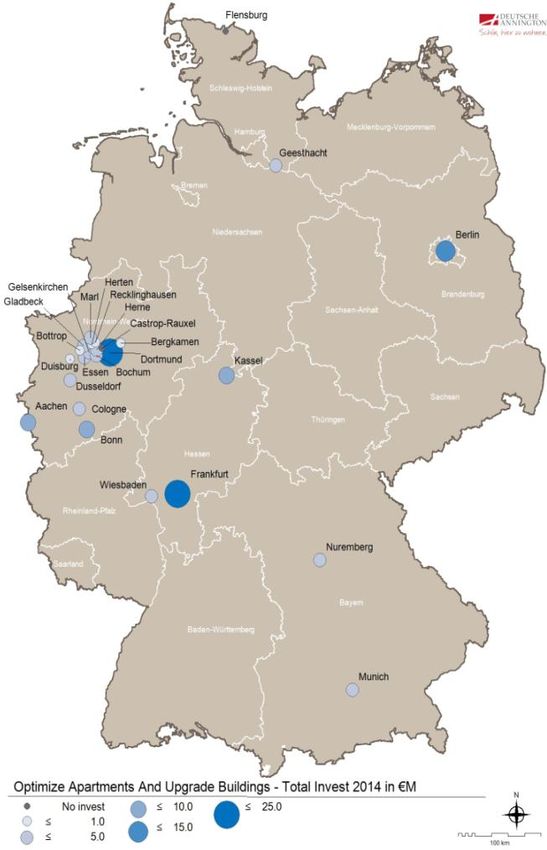
Overview                     Market                    Operations                    Financing       Financials

  German-wide geographical footprint provides
  rent increase stability

         Rent increases in the 5 strongest federal states

                                                   Baden-Württemberg                            Bavaria    Berlin      Hesse      NRW     Average
        2,5%

        2,0%

        1,5%

        1,0%

        0,5%

        0,0%
                               2006                          2007                          2008            2009            2010         2011        2012

       Source: Destatis. Rental growth data not provided for Bremen, Hamburg and Schleswig-Holstein

© Deutsche Annington Immobilien SE               13-15 January 2014                                                                                        5
Overview Market Operations Financing Financials
Our portfolio strategy: nationwide footprint, clearly structured,
well-managed and balanced
Portfolio strategy Portfolio distribution
Rental Only (82%)
Operational value generation I. Operate (44%)
through • No need for larger action in
Rental growth the next few years
Vacancy reduction
Effective and sustainable
maintenance spent
Cost efficiency through scale
Additional value creation through II. Upgrade Buildings (24%)
investments • Invest in energy efficiency
€800m capex opportunities upgrades
Core Returns above cost of capital • €500m of opportunities
95% Cost of capital lower than for identified
acquisitive growth
Track record of c. €100m of III. Optimise Apartments (14%)
investments since 2010 at 7% • Invest in apartments for
unlevered yield on average senior living and high stan-
dard flats in strong markets
Additional value creation through IV. Privatise (13%)
retail sales • Sell opportunistically if
Total of 22k apartments prepared sufficient premium value is
Track record of selling >20% offered
above fair value
Non- V. Non-core (5%)
Insufficient medium- to long-term
core • Sell mid-term around fair
growth prospects
5% value
© Deutsche Annington Immobilien SE 13-15 January 2014 6
Overview Market Operations Financing Financials
Investment programme proactively capitalising on mega-trends
supported by German regulation
Upgrade Buildings Optimise Apartments
Targeting energy efficiency Capitalising e.g. on development of senior population
European CO2 emission targets (vs. 1990 levels) > 60y 40-60y 20-40y 0-20y
100%
100%
80%
90%
Further targets by
80%
2020:
70%
20% increase in 60%
5-20% energy efficiency 50%
20% share of 40%
1990 - Base 2020 2050 renewable energy 30% 35.5
20% 26.3
Strong regulatory push at the EU level towards energy 20.4
10%
efficiency 1990 1994 1998 2002 2006 2010 2014 2018 2022 2026 2030
Supportive German regulatory framework allowing for rent
Significant increase in share of elderly population expected
increases following modernisation (up to 11% of energy
modernisation cost) Public subsidised funding available to support investments
into apartments for elderly people
Public subsidised funding available to support energy
efficiency investments
€500m investment opportunities identified €300m investment opportunities identified1
Attractive growth potential at ~7% unlevered yield, proven by our track-record
Source: European Commission, BBSR-Bevölkerungsprognose 2030
1 Including investments for senior living as well as investments in high demand markets
© Deutsche Annington Immobilien SE 13-15 January 2014Overview Market Operations Financing Financials
Preparation of investment program 2014 fully on track
Current status Geographic Distribution – Top 25 cities
Preparation of investment program 2014
fully on track
Hand-picked house by house
Individual projects range from ~€ 5k to ~€1.5m
Total volume of € 150m and 7% unlevered
yield will be achieved
Closing of €90m KfW funding expected until
year-end 2013
Tender offers and craftsmen capacity for
projects with construction start in Q1-2014
secured, remainder in progress
Target KPI reached, i.e. investment volume of € 150m and 7% unlevered yield
© Deutsche Annington Immobilien SE 13-15 January 2014 8Overview Market Operations Financing Financials
All projects planned bottom-up
Example Dortmund
„Optimize“ projects
worth up to €0.2m
(12 units)
„Upgrade“ projects
worth ~€2.2m
(112 units)
Example Berlin
„Upgrade“ and
„Optimize“
projects combined
worth ~€4m
(135 units)
„Upgrade“
projects worth
~€1.5m
(69 units)
Note: numbers are budget values. Actuals may vary until end of 2014 due to local circumstances, e.g. lower or higher tenant turnover than planned
(segment „Optimize Apartments“), longer procedures for building permits (segment „Upgrade Buildings“), etc.
© Deutsche Annington Immobilien SE 13-15 January 2014 9Overview Market Operations Financing Financials
Scale and professional portfolio management allowing for
cross-selling opportunities
Deutsche Telekom partnership
In 2011, Deutsche Annington signed a contract with Deutsche Telekom whereby
Deutsche Telekom will equip 145,000 residential units throughout Germany with
modern fibre-optic technology
Both parties enter into a marketing cooperation for Deutsche Telekom’s telephone,
internet and television products
In 2012, Deutsche Annington restructured existing agreements with fragmented supply
base of cable networks in order to enable implementation of Deutsche Telekom
partnership
By the end of the third quarter of 2013, 44,000 residential units were connected and
additional 14,000 units will follow in Q1 2014.
© Deutsche Annington Immobilien SE 13-15 January 2014 10Overview Market Operations Financing Financials
Insourcing initiatives provide unique operating platform and
economies of scale
Deutsche Annington B&O – one of Set-up of service company TGS
– the biggest housing Germany’s biggest well on track:
company in Germany craftsmen companies Since the beginning of 2013,
massive expansion of regional
DA Joint B&O
presence of TGS
51% Venture 49%
All DA customers directly
reachable via TGS craftsmen
Around 1.200 FTE nationwide;
further expansion planned
Strategic advantages of the TGS joint venture: Example: Central-heating boiler
Total costs in €m p.a.
Direct access to craftsmen capacities 3.4 (50%)
Improvement of quality through the build-up of
Even 11%
know-how and the implementation of efficient and 1.9
(11%) below standard
wholesaler
closely coordinated processes prices
Cost reduction by managing total costs of process 1.7
Nationwide scalable operating platform Shop Wholesaler DA
Best price through bundling and industry
knowledge
© Deutsche Annington Immobilien SE 13-15 January 2014 11Overview Market Operations Financing Financials
Successful Non-Core sales program
Non-Core segment Sale of residential units with
insufficient medium- to long-term
growth prospects
Expected sale of appx. 4,100 units in
2013 representing appx. 28% of Non-
Core segment end of 2012, driven by
sale of package of 2,100 units
Non-Core disposals fully on track, yet
~28% exceeding 2013 budget and achieving
a selling price at around fair market
value as planned
Reduced number of DA locations by
around 20 since end of last year
Positive effects on major portfolio
KPIs (vacancy rate, in-place rent, fair
value/sqm)
© Deutsche Annington Immobilien SE 13-15 January 2014 12Overview Market Operations Financing Financials
Higher flexibility for acquisitions and continuing
strong deal flow
There is a continuing flow of attractive portfolios
As per October 2013 we have
Examined: 91k units
Analysed in more details: 76k units
Performed due diligence on: 64k units
Thereof prepared indicative bids for: 31k units
Thereof Submitted binding bids for more than: 10k units
As the largest residential real estate company in Germany operating throughout the country
and due to our authorized capital and increased financial flexibility, we have strengthened our
market position significantly and are able to bid for every attractive portfolio
However we continue to have a disciplined approach. The preconditions for any purchase are:
Fit to portfolio, FFO/share accretion, non NAV/share dilution, maintaining our BBB rating
© Deutsche Annington Immobilien SE 13-15 January 2014 13Overview Market Operations Financing Financials
Implementation of unique and best-in-class financing structure
in the German real estate sector completed
Illustrative targeted evolution of Deutsche Annington financial liability structure (€bn, nominal)
Secured debt CMBS Corporate bonds
6.3 5.8 5.8
4.3 3.2 2.5 50%
3.3 50%
2.6
2.0
December 2012 Pre IPO Current (as per Oct. 31, 2013) Target capital structure
LTV (nominal) 59% 53% c. 50% c. 50%
Unencumb.
0% 0% c. 34% ≥50%
assets in %
Ongoing optimisation
Financing cost 4.4% 3.7% 3.3% based on most
economical funding
© Deutsche Annington Immobilien SE 13-15 January 2014 14Overview Market Operations Financing Financials
Optimal financing platform designed and established in 2013
First European residential real estate company to issue a US-Dollar bond
USD 1.0 bn in Sep./Oct. 2013
First German real estate company to issue an unsecured corporate bond
EUR 1.3 bn in July 2013
EUR 4.0 bn EMTN-Program set in place with the issuance of first notes of EUR 500 m
EUR 3.5 bn firepower on hand remain within the EMTN-Program
Refinancing of eight portfolios amounting to more than EUR 1.7 bn - mortgaged backed
Financing partners include main German Pfandbriefbanks, international insurance companies & pension funds
Hence, full and premature repayment of GRAND-CMBS
EUR 4.3 bn in July 2013 gaining full operational flexibility
Capital increase by issuing new shares within the IPO
EUR 400 m in July 2013
Best-in-class financing structure to ensure full flexibility, best pricing and access to all sources in shortest time.
© Deutsche Annington Immobilien SE 13-15 January 2014 15Overview Market Operations Financing Financials
Simplification and increased stability through enhanced
maturity profile and financing product mix
Comparison of maturity profiles FY 2012 vs Oct. 31, 2013
Debt structure as of Oct. 31, 2013 Maturity profile further extended and smoothed
No major refinancing before 2015
Mortgage
loans 18% Higher flexibility and cost efficiency through
tailored mix of financing instruments
Corporate
bonds 44%
Structured
real estate
loans 38%
© Deutsche Annington Immobilien SE 13-15 January 2014 16Overview Market Operations Financing Financials
9M 2013 figures confirm positive development
Rent/sqm/mth (€) and vacancy Fair value (€m)
Total portfolio Rental Only portfolio Fair value Fair value per sqm (€) # of units at period end (k)
Vacancy
181.7 178.6
5.37 5.48
5.37
5.26 10,375
9,982
4.4% 3.9%
889
3.3% 3.1%
839
9M 2012 9M 2013 31 Dec 2012 9M 2013
Note: Like-for-like in-place residential rent
Net debt (€m) and LTV EPRA NAV (€m)
Net debt¹ LTV 4,767
59% 51%
5,848 3,449
-9.8%
5,277
31 Dec 2012 9M 2013 31 Dec 2012 9M 2013
1 Based on nominal debt amounts net of cash;
© Deutsche Annington Immobilien SE 13-15 January 2014 17Overview Market Operations Financing Financials
9M 2013 figures confirm positive development
Adjusted EBITDA (€m) FFO 1 and FFO 2 (€m)
Adj. EBITDA Rental Adj. EBITDA Sales Adj. EBITDA Rental / unit1 FFO 1 Adj. EBITDA Sales FFO 1 / unit (€)1
352 363 191
30 27 27
145
336 30
323 909
1,867
1,744
625
163
116
9M 2012 9M 2013 9M 2012 9M 2013
AFFO (€m) FFO 1 ex. maintenance (€m)
AFFO AFFO / unit1 FFO 1 ex. maintenance FFO 1 ex. maintenance / unit (€)1
148 259
215
105
821 1,443
565 1,161
9M 2012 9M 2013 9M 2012 9M 2013
1 Based on average number of units over the period
© Deutsche Annington Immobilien SE 13-15 January 2014 18Overview Market Operations Financing Financials
FY 2013 outlook confirmed,
FFO 1 expected to be at top end of guidance
KPI
Rental growth 1.8 – 2.0 %
Modernisation volume from 2014 p.a. € 150 m
Planned disposals (privatisation) >2.0 k units
FFO 1 target € 210 – 220 m
Dividend policy ~70% of FFO 1
FFO 1 expected to be at top end of guidance
© Deutsche Annington Immobilien SE 13-15 January 2014 19Appendix © Deutsche Annington Immobilien SE 13-15 January 2014
Key facts & figures about Deutsche Annington
Key Facts 9M 2013 Portfolio snapshot
Top 5 European real estate company1 and the
largest German residential firm²
179k residential units across Germany, 97% by fair
value in Western Germany and Berlin
€10.4bn portfolio valuation
€4.8bn EPRA NAV
€546m rental income
€5.37 residential in-place rent per square meter per
month
2.1% rent per sqm growth p.a.
3.9% residential vacancy rate
€336m Adjusted EBITDA Rental
€363m Adjusted EBITDA
€163m FFO 1 and €191m FFO 2
Dedicated portfolio strategy and investment program
focused on value creation
Note: all data as of Sep. 30, 2013, unless otherwise stated
1By GAV; ² In listed German residential sector
© Deutsche Annington Immobilien SE 13-15 January 2014 219M 2013 key figures confirm the positive development
Key Figures
in €m 9M 2013 9M 2012 Change in %
Residential Units k 178.6 183.2 -2.5%
Rental income 546.1 547.3 -0.2%
Vacancy rate % 3.9 4.4 -0.5pp
Monthly in-place rent €/sqm 5.37 5.26 2.1%
Adjusted EBITDA Rental 335.7 322.9 4.0%
Adj. EBITDA Rental / unit in € 1,867 1,744 7.1%
Income from disposal of properties 226.1 226.1 0.0%
Adjusted EBITDA Sales 27.4 29.6 -7.4%
Adjusted EBITDA 363.1 352.5 3.0%
FFO 1 163.4 115.7 41.2%
FFO 2 190.8 145.3 31.3%
FFO 1 before maintenance 259.4 214.8 20.8%
AFFO 147.7 104.5 41.3%
Fair value market properties1 10,375.4 9,982.0 3.9%
EPRA NAV1,2 4,766.5 3,448.9 38.2%
LTV, in % 50.9 58.6 -7.7pp
FFO 1 / share in €3 0.73 0.58 25.9%
NAV / share in €4 21.26 17.24 23.3%
1) Previous year as of Dec. 31, 2012; 2) Before IPO proceeds; 3) Based on the shares qualifying for a dividend on the reporting date Sep. 30, 2013: 224,242,425
and Sep. 30, 2012: 200,000,000; 4) Based on the number of shares on the reporting date Sep. 30, 2013: 224,242,425 and Dec. 31, 2012: 200,000,000
© Deutsche Annington Immobilien SE 13-15 January 2014 22Rent increase and vacancy reduction in the residential
portfolio on track
DA Residential Portfolio
Sep. 30, 2013
Units Area Vacancy In-Place Rent Rent l-f-l Vacancy
Portfolio
# % (´000 sqm) % €m €/sqm Y-o-Y in % Y-o-Y in %
Segment
Operate 78,766 44 4,999 3.2 315 5.42 1.8 -0.4
Upgrade 43,530 24 2,746 3.0 169 5.31 1.5 -0.2
Optimise 21,367 12 1,335 2.5 95 6.06 3.4 0.4
RENTAL ONLY 143,663 80 9,080 3.1 579 5.48 2.1 -0.2
Privatise 21,215 12 1,453 5.1 88 5.29 1.0 -0.6
Non-Core 13,687 8 863 11.2 39 4.27 0.4 -2.4
TOTAL 178,565 100 11,396 3.9 705 5.37 2.1 -0.5
© Deutsche Annington Immobilien SE 13-15 January 2014 239M 2013 – Increased Adjusted EBITDA Rental and stable
Adjusted EBITDA Sales
Bridge to Adjusted EBITDA Rental segment
(€m) 9M 2013 9M 2012
(€m) 9M 2013 9M 2012
Average number of units over the period (k) 179.8 185.1
Profit for the period 474 183
Rental income 546 547
Interest expenses / (income) 205 240 Other income from property management 14 14
Income taxes 200 47 Ancillary cost balance (14) (15)
Other property management costs (211) (224)
Depreciation 5 5
Adjusted EBITDA Rental 336 323
Net income from fair value adjustments of
-540 -124
investment properties
EBITDA IFRS 344 351
Sales segment
(€m) 9M 2013 9M 2012
Non-recurring items 19 5
Number of units sold 3,415 3,448
Period adjustments 1 -3 Income from disposal of properties 226 226
Adjusted EBITDA 363 352 Carrying amount of properties sold (207) (200)
Revaluation of assets held for sale 17 18
Adjusted EBITDA Rental 336 323 Profit on disposal of properties 36 44
Adjusted EBITDA Sales 27 30 Operating expenses (10) (11)
Period adjustments 1 (3)
Adjusted EBITDA Sales 27 30
Evolution of Adjusted EBITDA (€m)
Adj. EBITDA Rental Adj. EBITDA Sales Adj. EBITDA Rental / unit5
352 363 Adjusted EBITDA Rental growing with reduced portfolio
+3.0%
30 27 Adjusted EBITDA Rental per unit increased by 7.1% to €1,867 per unit
1,867
1,744 Adjusted EBITDA Sales almost on last year's level
323 336
Adjusted EBITDA also growing
9M 2012 9M 2013
© Deutsche Annington Immobilien SE 13-15 January 2014 249M 2013 – All FFO definitions significantly higher than
previous year
FFO evolution FFO breakdown (€m)
(€m) 9M 2013 9M 2012
363 FFO 1 excl.
Adjusted EBITDA 363 352
maintenance
(-) Interest expense FFO (166) (202)
(-) Current income taxes (6) (5) 259
(=) FFO 2 191 145
(-) Adjusted EBITDA Sales 27 30 191
(166) (6)
163
(=) FFO 1 163 116 148
(27)
(16)
(-) Capitalised maintenance 16 11
(=) AFFO 148 105
(+) Capitalised maintenance 16 11
(+) Expenses for maintenance 96 99
Adjusted Interest Current FFO 2 Adjusted FFO 1 Capitalised AFFO
(=) FFO 1 (excl. maintenance) 259 215 EBITDA expense income EBITDA maintenance
FFO taxes Sales
Comments
All FFOs with significant positive development
Main drivers are a significantly lower interest expense FFO and, furthermore, a positive impact from growth in Adjusted EBITDA
© Deutsche Annington Immobilien SE 13-15 January 2014 259M 2013 – EPRA NAV rising due to external valuation and
shareholder contribution
EPRA NAV – Sep. 30, 2013 (€m)
Main impacts from valuation
of investment properties and
153 4,767
540 increase in capital by old and
625
new shareholders
3,449
1
EPRA NAV Shareholder's Valuation impact Other changes EPRA NAV
Dec. 31, 2012 capital contribution Sept. 30, 2013
1) Excluding deferred tax impact of external valuation
Note: Rounding errors may occur
© Deutsche Annington Immobilien SE 13-15 January 2014 269M 2013 – P&L development
P&L Comments
Change
Stable rental income despite sales-related reduction
(€m) 9M 2013 9M 2012 (€m) % of portfolio size from 183k to 179k
Revenues from property letting 785.2 796.2 -11 -1.4 Offset by higher average residential in-place rent
Rental income 546.1 547.3 -1.2 -0.2 per square metre per month (€ 5.37 vs. € 5.26) and
Ancillary costs 239.1 248.9 -9.8 -3.9 lower vacancy rate (3.9% vs. 4.4%)
Other income from property management 14.3 14.0 0.3 2.1
Income from property management 799.5 810.2 -10.7 -1.3 Lower ancillary costs mainly due to reduced
Income from sale of properties 226.1 226.1 0.0 0 portfolio
Carrying amount of properties sold -207.1 -200.2 -6.9 3.4
Profit on disposal of properties lower due to
Revaluation of assets held for sale 17.2 17.9 -0.7 -3.9
expected lower step-ups in the non-core segment
Profit on disposal of properties 36.2 43.8 -7.6 -17.4 while privatisation step-ups increased.
Net income from fair value adjustments of
investment properties 540.1 123.6 416.5 Net income from fair value adjustments increase
Expenses for ancillary costs -240.2 -261.9 21.7 -8.3 driven by valuation
Expenses for maintenance -72.9 -86.4 13.5 -15.6
Other cost of purchased goods and services -44.0 -50.5 6.5 -12.9
Analogous to ancillary costs, expenses for ancillary
Personnel expenses -105.7 -79.3 -26.4 33.3 costs reflect units development and insourcing
Depreciation and amortisation -4.6 -4.5 -0.1 2.2 effect of our caretaker organisation
Other operating income 33.1 23.6 9.5 40.3
Other operating expenses -63.2 -49.6 -13.6 27.4
Financial income 16.8 8.2 8.6
Financial expenses -221.1 -247.6 26.5 -10.7
Profit before tax 674.0 229.6 444.4
Income tax -199.7 -46.7 -153
Current income tax -6.0 -5.3 -0.7 11.1
Others (incl. deferred tax) -193.7 -41.4 -152.3
Profit for the period 474.3 182.9 291.4
© Deutsche Annington Immobilien SE 13-15 January 2014 279M 2013 – P&L development (cont’d)
P&L Comments
Change
(€m) 9M 2013 9M 2012 (€m) %
Revenues from property letting 785.2 796.2 -11 -1.4
Rental income 546.1 547.3 -1.2 -0.2
Ancillary costs 239.1 248.9 -9.8 -3.9
Other income from property management 14.3 14.0 0.3 2.1
Income from property management 799.5 810.2 -10.7 -1.3
Income from sale of properties 226.1 226.1 0.0 0 Reduction partially stems from caretaker insourcing
initiative, and other effects
Carrying amount of properties sold -207.1 -200.2 -6.9 3.4
Revaluation of assets held for sale 17.2 17.9 -0.7 -3.9
Profit on disposal of properties 36.2 43.8 -7.6 -17.4
Net income from fair value adjustments of Increased personnel expenses primarily due to the
investment properties 540.1 123.6 416.5 insourcing initiative of caretakers (€ -6.7m) and
Expenses for ancillary costs -240.2 -261.9 21.7 -8.3 craftsmen (€ -12.3m), and LTIP (-4.4€m)
Expenses for maintenance -72.9 -86.4 13.5 -15.6
Increase mainly from compensation paid and cost
Other cost of purchased goods and services -44.0 -50.5 6.5 -12.9 reimbursements
Personnel expenses -105.7 -79.3 -26.4 33.3
Depreciation and amortisation -4.6 -4.5 -0.1 2.2 Increase mainly driven by insourcing, higher
Other operating income 33.1 23.6 9.5 40.3 provisions and increased audit, consultancy fees
and legal costs
Other operating expenses -63.2 -49.6 -13.6 27.4
Financial income 16.8 8.2 8.6 Financial expenses decreased substantially due to
Financial expenses -221.1 -247.6 26.5 -10.7 lower interest rates which resulted from
restructuring of our debt positions
Profit before tax 674.0 229.6 444.4
Income tax -199.7 -46.7 -153
Current income tax -6.0 -5.3 -0.7 11.1 Profit for the period mainly driven by valuation
Others (incl. deferred tax) -193.7 -41.4 -152.3 effects
Profit for the period 474.3 182.9 291.4
© Deutsche Annington Immobilien SE 13-15 January 2014 289M 2013 – Overview of DA’s maintenance and capex split
Maintenance and modernisation (€m) Comments
9M 2013 9M 2012 Modernisation and maintenance are always
subject to seasonality effects and impacted by
cut-off dates which makes the analysis of
Sales of own craftmen‘s organisation 86.6 36.8 fractions of a year less meaningful
Bought-in services 60.8 120.2 Revenues of inhouse craftsmen organisation
increased significantly
Total cost of modernisation and
maintenance work 147.4 157.0 Total modernisation and maintenance work
slightly below previous year
Intercompany profits of own craftmen‘s
organisation eliminated in the consolidated
financial statements -9.1 -0.4 Craftsmen organisation generated profit /savings
of € 9.1m
Modernisation and maintenance work
recognised in the consolidated
financial statements 138.3 156.7 Modernisation program had a slow start, but
annual spend expected at previous year level
…thereof maintenance1 96.0 99.1 Driven by weather conditions and delays due to
capital structure reorganisation
…thereof capitalised maintenance 15.7 11.2 Quarterly numbers are always subject to higher
volatility due to completion cut-offs
…thereof modernisation 26.6 46.4
Note: Rounding errors may occur
1) including cost of materials of € 72.9 million as well as personnel expenses of € 23.1 million and other costs.
© Deutsche Annington Immobilien SE 13-15 January 2014 299M 2013 – Balance sheet evolution
Overview Comments
(€m) 9M 2013 YE 2012
Investment properties 10,279 9,844 Increase driven by valuation while number of units
Other non-current assets 82 103 decreased from 182k to 179k
Total non-current assets 10,361 9,947
€240m of cash was applied to the repayment of
Cash and cash equivalents 281 470 GRAND liabilities in January 2013
Other current assets 185 191
Total current assets 466 661
Total assets 10,827 10,608
Total equity attributable to DA shareholders 3,794 2,666
Non-controlling interests 16 11
Total equity 3,810 2,677
Other financial liabilities 5,366 5,767
Deferred tax liabilities 924 724
Provisions for pensions and similar obligations 291 319 Financial liabilities decreased due to the repayment of
GRAND after the successful restructuring in 2012 out
Other non-current liabilities 48 131 of cash on the balance sheet and IPO proceeds
Total non-current liabilities 6,629 6,941
Other financial liabilities 201 684
Other current liabilities 187 306
Total current liabilities 388 990
Total liabilities 7,017 7,931
Total equity and liabilities 10,827 10,608
© Deutsche Annington Immobilien SE 13-15 January 2014 309M 2013 – Balance sheet evolution (cont’d)
Overview Comments
(€m) 9M 2013 YE 2012
Investment properties 10,279 9,844
Other non-current assets 82 103
Total non-current assets 10,361 9,947
Cash and cash equivalents 281 470
Other current assets 185 191
Total current assets 466 661
Increase driven by capital contributions and by profit
Total assets 10,827 10,608 in the period, mainly resulting from valuation of
properties.
Total equity attributable to DA shareholders 3,794 2,666
Non-controlling interests 16 11
Total equity 3,810 2,677
Other financial liabilities 5,366 5,767
Deferred tax liabilities 924 724
Provisions for pensions and similar obligations 291 319 Early repayment of EK02 tax liabilities in September
reduced the other liabilities
Other non-current liabilities 48 131
Total non-current liabilities 6,629 6,941 Total payment amounted to €113m
Early repayment saves 5.5% interest on this liability
Other financial liabilities 201 684 which was due in 4 further annual instalments
Other current liabilities 187 306
Total current liabilities 388 990
Total liabilities 7,017 7,931
Total equity and liabilities 10,827 10,608
© Deutsche Annington Immobilien SE 13-15 January 2014 31Total residential portfolio by federal states
Residential per Sep. 30, 2013
Units Area Vacancy In-Place Rent
(in € per sqm per
(in thousand sqm) (in %) (in € million)
month)
North Rhine-Westphalia 95,181 5,958 4.3% 347.7 5.09
Hesse 21,141 1,338 1.8% 103.2 6.54
Bavaria 14,224 946 2.2% 61.1 5.50
Berlin 12,893 830 1.4% 56.1 5.72
Schleswig-Holstein 11,247 701 4.2% 41.2 5.12
Lower Saxony 5,679 384 8.2% 21.6 5.09
Rhineland-Palatinate 5,126 364 3.2% 21.8 5.17
Baden-Württemberg 4,931 344 2.5% 21.8 5.41
Saxony 3,282 205 10.5% 10.7 4.87
Saxony-Anhalt 1,379 94 20.0% 4.1 4.50
Hamburg 1,122 65 2.0% 5.6 7.36
Thuringia 1,059 68 5.9% 4.0 5.21
Mecklenburg-Western Pomerania 642 49 2.2% 3.3 5.71
Brandenburg 576 42 4.2% 2.8 5.84
Bremen 66 5 6.1% 0.3 5.76
Saarland 17 1 5.9% 0.1 4.75
Total 178,565 11,396 3.9% 705.4 5.37
Note: Residential in-place rent (per month in € per sqm) is defined as the current gross rental income per month for rented residential units as agreed in the corresponding rent
agreements as of March 31, 2013, before deducting non-transferable
© Deutsche Annington Immobilien SE 13-15 January 2014 32Total residential portfolio by 25 largest locations
Residential per Sep. 30, 2013
Units Area Vacancy In-Place Rent(1)
(thousand (€ per sqm per
(%) (€ million)
sqm) month)
Dortmund 17,607 1,074 3.1% 59.5 4.78
Berlin 12,893 830 1.4% 56.1 5.72
Essen 10,070 617 5.8% 36.1 5.19
Frankfurt am Main 9,995 619 0.8% 52.4 7.11
Gelsenkirchen 7,759 476 6.8% 24.5 4.60
Bochum 7,611 439 3.0% 26.1 5.12
Duisburg 4,719 281 4.3% 16.0 4.97
Munich 4,648 310 0.8% 23.1 6.26
Herne 4,575 280 5.1% 15.0 4.71
Bonn 4,244 298 1.7% 21.2 6.05
Cologne 3,984 263 2.1% 19.8 6.40
Gladbeck 3,258 200 3.2% 11.3 4.90
Herten 2,711 174 4.5% 9.1 4.57
Marl 2,508 167 7.9% 9.4 5.09
Düsseldorf 2,471 162 2.6% 13.0 6.90
Aachen 2,187 145 2.4% 9.1 5.36
Wiesbaden 2,062 137 2.2% 11.8 7.33
Bergkamen 2,019 134 8.1% 6.6 4.49
Geesthacht 1,999 114 3.6% 7.3 5.56
Bottrop 1,914 120 3.5% 7.1 5.07
Kassel 1,863 116 3.3% 6.6 4.87
Castrop-Rauxel 1,704 100 4.6% 5.8 5.11
Recklinghausen 1,656 109 3.9% 6.0 4.78
Nuremberg 1,612 111 1.2% 7.6 5.80
Flensburg 1,598 106 5.1% 5.8 4.79
Subtotal 117,667 7,380 3.4% 466.4 5.45
Remaining 60,898 4.016 5.0% 239.1 5.22
Total 178,565 11,396 3.9% 705.4 5.37
in-place rent (per month in € per sqm) is defined as the current gross rental income per month for rented residential units as agreed in the
1) Residential
corresponding rent agreements as of March 31, 2013, before deducting non-transferable
© Deutsche Annington Immobilien SE 13-15 January 2014 33Rating: investment grade rating from S&P
Corporate investment grade rating
Rating agency Rating Outlook Last Update
Standard & Poor’s BBB Stable 23 July 2013
Bond ratings
Amount Issue Price Coupon Maturity Rating
Date
3 years 2.125% € 700m 99.793% 2.125% 25 July 2016 BBB
Euro Bond
6 years 3.125% € 600m 99.935% 3.125% 25 July 2019 BBB
Euro Bond
4 years 3.200% USD 750m 100.000% 3.200% 2 Oct 2017 BBB
Yankee Bond (2.970%)*
10 years 5.000% USD 250m 98.993% 5.000% 2 Oct 2023 BBB
Yankee Bond (4.680%)*
8 years 3.625% €500m 99.843% 3.625% 8 Oct 2021 BBB
EMTN
*EUR-Equivalent re-offer yield
© Deutsche Annington Immobilien SE 13-15 January 2014 34Key bond terms
3 years 2.125% Euro Bond 6 years 3.125% Euro Bond
Issuer: Deutsche Annington Finance B.V.* Deutsche Annington Finance B.V.*
Trade Date: 17 July 2013 17 July 2013
ISIN: DE000A1HNTJ5 DE000A1HNW52
WKN: A1HNTJ A1HNW5
Listing: Unregulated open-market segment (Freiverkehr) of the Unregulated open-market segment (Freiverkehr) of the
Frankfurt Stock Exchange Frankfurt Stock Exchange
Notional Amount: EUR 700,000,000 EUR 600,000,000
Denominations: EUR 100,000 per Note EUR 100,000 per Note
Issue Price: 99.793% 99.935%
Coupon: 2.125% (payable annually) 3.125% (payable annually)
First Coupon payment: 25 July 2014 25 July 2014
Maturity Date: 25 July 2016 25 July 2019
Covenants: Total Debt / Total Assets = 125%
Rating: BBB BBB
*The bonds are guaranteed by Deutsche Annington Immobilien SE.
© Deutsche Annington Immobilien SE 13-15 January 2014 35Key bond terms (cont’d)
2013/17 3.20% USD-Bond 2013/23 5.00% USD-Bond 2013/21 3.625% EUR-MTN
Issuer: Deutsche Annington Finance B.V.* Deutsche Annington Finance B.V.* Deutsche Annington Finance B.V.*
Trade Date: 02 October 2013 02 October 2013 08 October 2013
ISIN: 144A: US25155FAA49 144A: US25155FAB22 DE000A1HRVD5
Reg S: USN8172PAC88 Reg S: USN8172PAD61
WKN/ CUSIP: 144A: 25155FAA4 144A: 25155FAB2 A1HRVD
Reg S: N8172PAC8 Reg S: N8172PAD6
Listing: no Listing no Listing Regulated market of the Luxembourg Stock Exchange
Notional Amount: USD 750,000,000 USD 250,000,000 EUR 500,000,000
Denominations: USD 50,000 per note USD 50,000 per note EUR 1,000 per note
Issue Price: 100.000% 98.993% 99.843%
Coupon: 3.20% (half-annually payment) 5.00% (half-annually payment) 3.625% (annually payment)
EUR-Equivalent re-offer 2.97% (half-annually payment) 4.68% (half-annually payment) -
yield
First Coupon payment: 2 April 2014 2 April 2014 8 October 2014
Maturity Date: 2 October 2017 2 October 2023 8 October 2021
Covenants: Total Debt / Total Assets = 125%
Rating: BBB BBB BBB
* Fully and unconditionally guaranteed by Deutsche Annington Immobilien SE
© Deutsche Annington Immobilien SE 13-15 January 2014 36Disclaimer – Confidentiality Declaration
This presentation has been specifically prepared by Deutsche Annington Immobilien SE and/or its affiliates (together, “DA”) for
internal use. Consequently, it may not be sufficient or appropriate for the purpose for which a third party might use it.
This presentation has been provided for information purposes only and is being circulated on a confidential basis. This
presentation shall be used only in accordance with applicable law, e.g. regarding national and international insider dealing rules,
and must not be distributed, published or reproduced, in whole or in part, nor may its contents be disclosed by the recipient to
any other person. Receipt of this presentation constitutes an express agreement to be bound by such confidentiality and the
other terms set out herein.
This presentation includes statements, estimates, opinions and projections with respect to anticipated future performance of DA
("forward-looking statements") which reflect various assumptions concerning anticipated results taken from DA’s current
business plan or from public sources which have not been independently verified or assessed by DA and which may or may not
prove to be correct. Any forward-looking statements reflect current expectations based on the current business plan and various
other assumptions and involve significant risks and uncertainties and should not be read as guarantees of future performance
or results and will not necessarily be accurate indications of whether or not such results will be achieved. Any forward-looking
statements only speak as at the date the presentation is provided to the recipient. It is up to the recipient of this presentation to
make its own assessment of the validity of any forward-looking statements and assumptions and no liability is accepted by DA
in respect of the achievement of such forward-looking statements and assumptions.
DA accepts no liability whatsoever to the extent permitted by applicable law for any direct, indirect or consequential loss or
penalty arising from any use of this presentation, its contents or preparation or otherwise in connection with it.
No representation or warranty (whether express or implied) is given in respect of any information in this presentation or that this
presentation is suitable for the recipient’s purposes. The delivery of this presentation does not imply that the information herein
is correct as at any time subsequent to the date hereof.
DA has no obligation whatsoever to update or revise any of the information, forward-looking statements or the conclusions
contained herein or to reflect new events or circumstances or to correct any inaccuracies which may become apparent
subsequent to the date hereof.
© Deutsche Annington Immobilien SE 13-15 January 2014 37IR Contact
Thomas Eisenlohr
Head of Investor Relations
Tel. +49 234 314 2384
thomas.eisenlohr@deutsche-annington.com
Deutsche Annington Immobilien SE
Philippstraße 3
44803 Bochum
Germany
http://www.deutsche-annington.com
© Deutsche Annington Immobilien SE 13-15 January 2014 38You can also read