Interim Results 2020 For The 6 Months Ended 30 June 2020 - HY 2020 - Permanent TSB Group
←
→
Page content transcription
If your browser does not render page correctly, please read the page content below

I N T E R I M   F I N A N C I A L   R E S U L T S

                                                                           HY 2020

Interim Results 2020
For The 6 Months Ended 30 June 2020
Forward Looking Statements

This document contains forward-looking statements with respect to certain of the Permanent TSB Group Holdings plc’s (the ‘Bank’) intentions, beliefs, current goals
and expectations concerning, among other things, the Bank’s operational results, financial condition, performance, liquidity, prospects, growth, strategies, the banking
industry and future capital requirements.

The words “expect”, “anticipate”, “intend”, “plan”, “estimate”, “aim”, “forecast”, “project”, “target”, “goal”, “believe”, “may”, “could”, “will”, “seek”, “would”, “should”,
“continue”, “assume” and similar expressions (or their negative) identify certain of these forward-looking statements but their absence does not mean that a
statement is not forward looking. The forward-looking statements in this document are based on numerous assumptions regarding the Bank’s present and future
business strategies and the environment in which the Bank will operate in the future.

Forward-looking statements involve inherent known and unknown risks, uncertainties and contingencies because they relate to events and depend on circumstances
that may or may not occur in the future and may cause the actual results, performance or achievements of the Bank to be materially different from those expressed or
implied by such forward looking statements. Many of these risks and uncertainties relate to factors that are beyond the Bank’s ability to control or estimate precisely,
such as future global, national and regional economic conditions, levels of market interest rates, credit or other risks of lending and investment activities, competition
and the behaviour of other market participants, the actions of regulators and other factors such as changes in the political, social and regulatory framework in which
the Bank operates or in economic or technological trends or conditions.

Past performance should not be taken as an indication or guarantee of future results, and no representation or warranty, express or implied, is made regarding future
performance. Nothing in this document should be considered to be a forecast of future profitability or financial position and none of the information in this document is
intended to be a profit forecast or profit estimate.

The Bank expressly disclaims any obligation or undertaking to release any updates or revisions to these forward-looking statements to reflect any change in the Bank’s
expectations with regard thereto or any change in events, assumptions, conditions or circumstances on which any statement is based after the date of this document
or to update or to keep current any other information contained in this document. Accordingly, undue reliance should not be placed on the forward-looking statements,
which speak only as of the date of this document.

www.permanenttsbgroup.ie/investor-relations
I N T E R I M   F I N A N C I A L   R E S U L T S

                                                           HY 2020

Eamonn Crowley, CEO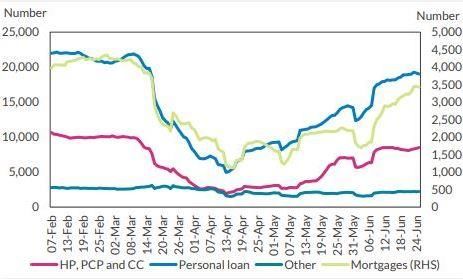
Challenging Business Environment - Impacted By Covid-19
H1 2020 Highlights

                                                         • 10.5k Mortgage Payment Breaks approved (Peak May ‘20) | c.€1.6bn | c.10% of Gross Loans
                                    >10k
     Covid - 19              Payment Breaks              • Average Loan Size €152k, Average Yield 2.80%
                                Approved
                                                         • c.50% Reduction in the number of Payment Breaks

                                                         • Total New Lending of €0.6bn, down 16% YoY
                                   15.2%1
    Commerical                  Mortgage                 • Mortgage Market Share of 15.2%1
                               Market Share
                                                         • Reduced Fixed and Variable Mortgage Pricing For Both New and Existing Customers

                                                         • Operating Profit 2of €23m | Net Interest Margin 1.75%
                                   €57m
     Financial                      Loss                 • Operating Expenses3 of €142m, down 2% YoY | Regulatory Charges of €20m
                                 Before Tax
                                                         • Expected Credit Loss of €75m – Reflecting the Current Macro Economic Environment

                                                         • NPL’s of €1.1bn
    Asset Quality                   6.8%                 • Provision Coverage Ratio Remains Appropriate
                                  NPL Ratio
                                                         • Medium Term Commitment to Mid Single Digit Ratio

                                                         • CET1 Ratio (Fully Loaded) of 13.9% | CET1 Ratio (Transitional) of 16.5%
                                   13.9%
      Capital                     CET1 Fully             • Higher RWAs arising from Payment Breaks (+€0.5bn), a conservative approach to Capital
                                   Loaded                • All Ratios remain above Management and Regulatory minimum

         1.   BPFI data at 30 June 2020.
         2.   Operating Profit is Profit after Operating Expenses and Regulatory Charges before Impairment.
3        3.   Operating Expenses excluding Covid-19 Costs, Bank Levy, Regulatory Charges and Exceptional Items.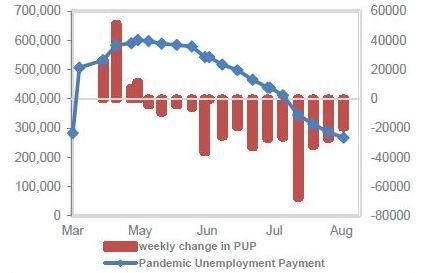
Irish Economy Impacted By Worldwide Pandemic
An Unprecedented Contraction In Economic Activity
Job Losses Came In Waves Labour Market (%)
Employment Rate Labour Force Growth Unemployment
14.5
9.2
7.6 7.3
5.0
2.9 2.7
2.0 1.3 0.6
-2.0
2019 2020E 2021E 2022E
-11.9
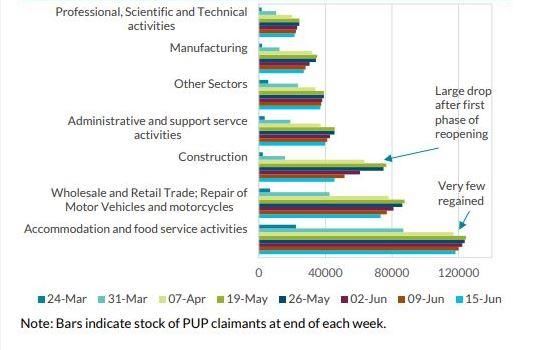
Pandemic Unemployment Payment (PUP)
• Following the sharp increase in job losses since the onset of the Covid-
19 outbreak, the labour market is showing signs of a gradual recovery in
line with the Governments phased reopening of the economy.
• Pandemic Unemployment Payment (PUP) claimants have declined from
a peak of >600k in April to 286k in July.
• However unemployment will remain elevated over the forecast horizon
especially in the Accommodation and Food Service Industry.
4 Source: CBI, Davy, Dept of Social Protection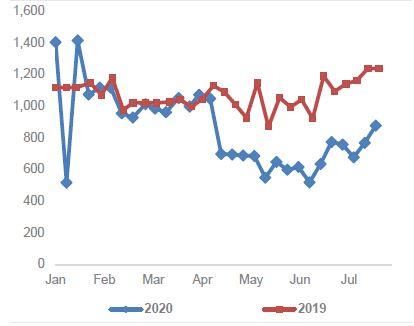
Indicators Support Significant Lows In April And May
    Signs Of Recovery With A Strategy Of Phased Reopening

    House Hold Deposits Increase To Record Highs      New Household Debt, 65% Decline In April 20 -   Transactions Added To The Property Price
    Suggesting Ability To Support Recovery            But Showing Signs of Recovery                   Register

                 Mortgage Market (€bn)                     Housing Completions (000s)                          House Price Growth
           9.5
                                                8.4
                             7.0                          21.8
                                                                                        16.9                                           3.5%
                                                                         13.8                         3.0%

          2019            2020e             2021e        2019          2020e           2021e

         Mortgage enquiries were subdued in quarter 2 and remained at levels far below                                (-9.0%)
         normal for April and May, activity in the Irish housing market is showing positive
         signs of recovery.                                                                           2019            2020e           2021e

5         Source: CBI, Martello Capital, Davy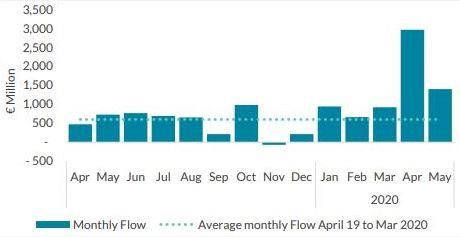
Covid–19 Response
Supporting Our Customers, Colleagues And Communities

                                                                                          Customer Support

             Payment Breaks1 Approved                                             €1m Cashback to Customers                                                        €50 Contactless Payment Limit
             • c.10.5k Mortgage Payment                                                                                                                            • An increase of €20 per transaction
               Breaks, €1.6bn in Value                                           • €5 Back On GoRewards
                                                                                   Programme1                                                                      • 40 million contactless payments
            Online portal
            • Facilitating Payment                                               • Unlimited 10c Cashback on Explore                                               • 92% customers are using contactless
              Breaks and SFS for                                                   Current Account debit card                                                        payments over cash, 60% reduction in
              Customers                                                            transactions (Q2’20)                                                              over the counter cash in Q2’20

                                                                                 • 2% + 2% Cashback on Mortgages

                      Seamless Business Continuity – All Locations Remained Open Throughout the Lockdown

            Branches                                                                   Direct Banking                                                                                Colleagues

• All 76 Branches Remain Open                                     • Contact Centers Remain Fully Operational                                              • 1,200 colleagues working remotely
• Invested In PPE, Social Distancing                              • 4 New Regional Centers                                                                • 800 Additional Remote Working Licenses
  & Hygiene Measures                                                                                                                                        Issued
                                                                  • 72% of Customers are now choosing to Bank
• Prioritised In Branch Banking Hours                               using Online Channels                                                                 • 150 communications since the beginning of
  For Elderly And Vulnerable                                                                                                                                the crisis
  Customers                                                       • 42% Increase in Mobile App Log-Ins
                                                                                                                                                          • Emergency Customer Support Allowance For
                                                                                                                                                            Customer Facing Roles

                                       Relationship NPS2 Increased From +3 to +14, Clear No. 1 In The Market
       1.    Payment Breaks implemented on both Mortgage and Term Loan products, GoRewards Programme ran in April and May 2020 for all Explore Current Account Customers
       2.    Relationship Net Promoter Score (NPS) – an index ranging from -100 to 100 measuring the willingness of customers to recommend a company’s products or services to others based on the Red
6            C research commissioned by the Bank, June 2020
Driving Sustainable Performance
    Strong Ambition, Purpose And Priorities

                          Our Ambition                                      Our Purpose
                          To Be Ireland’s Best Personal                     To Work Hard Every Day to Build
                          And Small Business Bank                           Trust with Our Customers – We
                                                                            are a Community Serving the
                                                                            Community

                                                    Our Priorities

              Customers                                   Transform                        Profitability

      Customers              Digital                Culture           Simplification          Profitability
       Build Trust,       Enhance Digital        Embed an Open         Simplify our         Grow Sustainable
       Advocacy &           Capabilities        and Inclusive Risk      Business                 Profits
         Loyalty                                  Aware Culture

7
Customers
Build Trust And Loyalty With Our Customers
Enhance Leverage Re-Position
Customer Journeys Digital Capabilities Our Brand
Delivering On Our Priorities Medium Term Outcomes
• Mortgage Pricing
• Significant Improvement In Customer Satisfaction,
• Realigned Fixed Rates for New and Existing Mortgage Customers Trust, and Loyalty
• Reduction to Mortgage Variable Rates
• Partnership with Ó Cualann Cohousing – Approved Housing Body
• Clear No.3 Mortgage Provider in Ireland
• €350k Donation Over 3 Year period
• Supporting the Development of 1,800 Affordable Homes Across Ireland
• Further Developing The Customer Digital Journey • Strong Intermediary Relationships
• >47 Million Successful Log-Ins Online, 30% Increase Year On Year
• >650k Active Online Customers, 8% Increase Year On Year • Be the Best Bank for Small Businesses in Ireland
• 94% of Term Loans Applied For Through Direct Channels
• Relationship NPS1 - 1st in the Market
• Simple, Digitally Enabled Customer Journeys
• Increased from +3 to +14 in H1’20. Customer Care and Relevance being
the Positive Drivers
• Trust Score2 – We Continue To Build Trust With Our Customers • Re-Positioned Brand
• NPS score up 10 points since Dec 19
1. Relationship Net Promoter Score (NPS) – an index ranging from -100 to 100 measuring the willingness of customers to recommend a company’s products or services to others based on
the Red C research commissioned by the Bank, June 2020.
8 2. Trust Score H1’20 refers to the proportion of main bank customers who would endorse their bank as being “Trustworthy” – Source Red C research commissioned by the Bank, June 2020.Transform
Build A Sustainable Future For The Bank
Digital Business Model Embed
Development Simplification Our Values
Delivering On Our Priorities Medium Term Outcomes
• Digital Development And Simplification - Better Customer Experience
• Increased Flexibility and Process Improvements • Strengthened Culture
• 72 Hours to Mortgage Decision • A Diverse, Inclusive And Risk Aware Culture
• Term Loans (Instant Approval), Credit Cards (Online)
• A Streamlined Organisation
• Prioritisation of Direct & Digital Mortgage Channel
• 12 Month Mortgage Approval in Principle (H2‘20) • Effective Organisational Design
• Digital Current Account Onboarding (6 Minutes Opening Time) and Overdrafts
Online (H2’20) • Delivering Capability & Efficiency
• Mobile Payment Capability (H2’20) • Reduce Product and Process Complexity
• Supporting Small Businesses Over Time
• Participation in SBCI Government Backed Funding to Small Businesses • Grow Quality Earnings
• Accelerate our Digital Agenda to Support Business Banking Customer
Journeys • Growth in Mortgage, Consumer And SME
Loan Books
• Embedding Our Values
• Launched a New Purpose Centred On Rebuilding Trust • Direct Banking Propositions
• Employee Net Promoter Score of +13
• Positive Customer Focused Culture – 98% of colleagues believe we are doing
the right thing for our customers
9Profitability
Growth, Efficiency And Sustainable Returns
Grow Diversified Efficient Capital And
Income Streams Organisation Resource Allocation
Delivering On Our Priorities Medium Term Outcomes
• Mortgage Market Share 15.2% • Revenue Growth Through Diversified Income
Growth Streams
• Operating Income €23m, NIM 1.75%
• Competitive Commercial Pricing Within The
Banks Risk Appetite
• Net Fee Income c. 9% Of Total Income
Efficiency
• Drive Efficiencies, Transform The Cost Base -
• Total Operating Expenses1 Reduced by €3m or 2% YoY Absolute Cost Base Declining Year On Year
• Impairment Charge of €75m • Strategic Allocation Of Capital
Returns
• CET1% (Fully Loaded) 13.9%
1. Operating Expenses are Total Operating Expenses excluding Bank Levy, Regulatory Charges and Exceptional Items
10I N T E R I M F I N A N C I A L R E S U L T S Financial Performance
Income Statement
 Covid-19 Pandemic Has Material Impact On Profitability

                                                 H1 20 H1 19                         YoY             YoY                                                    H1 20 Vs H1 19
                                                  €m    €m                           €m               %
                                                                                                                     •    6% reduction in NII primarily due to lower income from Treasury Assets
NII                                                      171             181          (10)            -6%                 (€11m) and NPLs (€5m) offset by lower funding costs.

Fees & Commissions                                         16              17          (1)            -6%
                                                                                                                     •    Fees & Commissions lower due to the reduced transactional activity as a
                                                                                                                          result of the impact of Covid-19 on quarter two banking activity.
Net Other Income                                           (2)             12         (14)          -117%

Operating Income                                         185             210          (25)           -12%
                                                                                                                     •    Net Other Income - Prior year €12m, primarily from gains on the disposal of
                                                                                                                          Properties In Possession, no gains from disposals of properties in possession
Operating Expenses1                                     (142)          (145)           3              -2%                 in 2020.

Regulatory Charges                                        (20)           (18)          (2)           -11%
                                                                                                                     •    Operating Expenses are 2% lower as efficiency savings offset Investment
Operating Profit                                           23              47         (24)           -51%                 and Inflationary pressures. The Bank continues to maintain good cost
                                                                                                                          discipline.
Impairment Charge                                         (75)             (5)        (70)              -

Profit / (Loss) Before Exceptional                                                                                   •    A material Impairment Charge of €75m reflecting the revision of the current
                                                         (52)              42         (94)              -
Items & Tax                                                                                                               macroeconomic factors and impact from Covid-19 payment breaks.

Exceptional Items (Net)1                                   (5)           (14)          9             -64%

Profit / (Loss) Before Tax                               (57)              28         (85)              -            •    Exceptional Items primarily relate to costs incurred due to Covid-19 (€4m)
                                                                                                                          and Restructuring and Other Costs (€1m).

        1.   For the purpose of comparing underlying movements, we have included Covid-19 related expenses, for the six months to 30 June 2020, of €4m within Exceptional Items. In the six months to 30
12           June 2019, Exceptional Items (Net) included a €15m provision in relation to legacy Tracker Mortgage related expenses.
Lower Net Interest Income
NIM Declining, 7 Bps Lower Year-On-Year
Net Interest Income (€m) Net Interest Margin (%)
181 -6% 171 1.77 1.82 1.75
17
6 2.36% 2.42% 2.42%
12
7 NIM
Treasury Income
Lending Assets Yield
NPL Income 2.14% 2.05% 1.95%
Perf. Loan Income Asset Yield
Deposit Cost
189 +5%1 191 0.87%
Treasury Assets
Other Funding Costs Yield
0.69%
IFRS Adjustments Cost of Funds 0.37%
0.27% 0.18%
0.22%
-20 -14
-11 H1 '18 H1 '19 H1 '20
-11
-6 -8
H1
H1 19
19 H1
H1 20
20
• Net Lending Income1 of €177m increased by 5% YoY primarily due • Lower YoY Cost of Funds primarily through continued active
to a reduction in the cost of Deposits management of Deposit Costs, partially offset by MTN issuance in
H2 19
• Treasury Income lower by €11m due to continued maturity of
legacy, high-yielding treasury assets. All such assets have now fully • Reduction in Asset Yield due to the continued maturity of high
matured yielding legacy treasury assets, cost of excess liquidity together
with the price reductions to the Bank’s Fixed Rate Mortgage
• NPL income lower by €5m mainly due to deleveraging activity in products
H2 2019
• Lending Assets Yield remains above 2%
• NIM trajectory expected to be low 170 basis points in 2020
13 1. Net Lending Income = Performing Loan Income – Deposit CostTotal New Lending Reduced By 16% YoY
Mortgage Market Share Remained Strong
Mortgage New Lending Volumes And Market Share Personal Term Lending2
61 93 46
1.2 44
15.5% 15.2%
15.1%
14.7%
13.8% 33 34
1.0
12.6%
28 27
0.810.8%
Mortgage Volumes €bn 12
0.6 Drawdowns Mkt Share %
0.9
0.8
0.4 0.6 0.6 H1 18 H1 19 H1 20
0.5 0.5
0.3 Direct Branch
0.2
H1 17 H217 H1 18 H218 H1 19 H219 H1 20
SME Lending
• Market Share of Mortgage Drawdowns remained strong at 15.2% 8 31 25
25
• Taking action on pricing:
20
• Competitive 2 & 5 Year Rates for New Business >€250k
• Fixed rates for existing and new customers aligned
• SVR reducing by 55bps; MVR reducing by 10-35bps (depending on LTV)
4 4 6 5
• Fixed Rate Products Account for c.95% of New Mortgage Business
• c.50% of New Mortgage Business in H1’20 is to First Time Buyers
H1 18 H1 19 H1 20
• Average LTV of New Mortgage Lending in H1’20 was 76%
Secured Unsecured
1. Source: BPFI Data at June 2020
14 2. Direct Channels include Online and VoicePerforming Home Loan Book Broadly In Line
Home Loan Yield 11 Basis Points Lower
Performing Home Loan Book Movement (€bn) Performing Home Loan Yield (%)
11.7 11.6
2.98% 2.97%
2.86%
11.7 -0.6 11.6
2.60% 2.58% 2.59%
Stock Flow
+0.5
FY 19 Inflow Outlow H1 20 H1 19 FY 19 H1 20
Performing Home Loan Book by Product Type (%)
• Home Loan Mortgage Book reduced by 1% since Dec 2019
11.1 11.3 11.7 11.6
54%
• 90% of Inflows to Fixed Rate products, Average Yield 2.88%
50% • 42% of Outflows from Tracker Rate products, Average Yield 1.29%
45% 44%
37% • Competition continues to drive down new mortgage customer rates with
33% 34% average New Business Mortgage Yield of 2.86%
29%
26%
23%
17% • Tracker Mortgages are now 44% of the Total Home Loan Mortgage Book,
9%
down from 54% in 2017
• 3% of the Performing Home Loan Mortgage Book is on Interest Only
FY 17 FY 18 FY 19 H1 20
Tracker Variable Fixed Linear (Tracker) Linear (Fixed)
15Buy to Let Book Continues To Contract
Reducing By 4% From Dec 19
Performing Buy to Let Book Movement (€bn) Performing Buy to Let Yield (%)
3.2 3.1
1% 1%
-4%
9% 9%
1.43% 1.43% 1.42%
90% 90%
Stock
FY 19 H1 20 H1 19 FY 19 H1 20
Tracker Variable Fixed
• During H1 20 the Buy to Let Mortgage Book reduced by 4% (€131m) to €3.1bn
• 90% Tracker | 9% Variable | 1% Fixed
• 84% of Buy to Let Book in Tracker at an average yield of 1.09%
• 60% of the Buy to Let Book is Interest Only
• Average Yield on Total BTL Book at 1.42%
16Operating Expenses1 2% Lower Year On Year
Strong Cost Discipline
Movement In Operating Expenses (€m)
€m H1 20 H1 19 YoY €m YoY %
150
Staff Costs 77 77 - -
148
1 1
146 Non Staff Costs 46 51 -5 -10%
144 -7 2 Addressable Costs2 123 128 -5 -4%
142
Depreciation &
140 19 17 +2 12%
142 Amortisation3
138 145
136 Operating Expenses 142 145 -3 -2%
134 Regulatory Charges 20 18 +2 11%
132
Total Operating
130 162 163 -1 -1%
H1 19 Wage Inflation Investment Cost Savings Depreciation H1 20 Expenses
Cost Income Ratio4 77% 69% -
• Operating Expenses (before Regulatory Charges) of €142m, reduced by Average No. Staff 2,424 2,376 +48 +2%
€3m (2%) YoY, cost management remains a key focus of the Bank.
• The primary movements in Operating Expenses are:
Staff Numbers Increased by 2% YoY, as a result of investment in
• Wage inflation of €1m, investment in business and technology
technology and business divisions, together with additional staff
programmes of €1m, partly offset by lower costs in contractors fees
required in the Banks response to Covid-19.
of €1m together with other cost saving initiatives and lower legal &
professional fees of €6m Addressable Costs are expected to continue to reduce over the
• Depreciation & Amortisation increased by €2m YoY Medium Term as the Cost of Investment is funded from
sustainable operational efficiencies within the Bank’s cost base.
1. For the purpose of this presentation, in order to give a true comparison of the movement in Underlying Operating Expenses, the costs incurred in the Bank’s response to Covid-19 have been included in Exceptional Items
2. Addressable Costs are Operating Costs before Depreciation & Amortisation and Regulatory Charges
3. IFRS 16 restatement of €4m in H1 2019 from Non Staff Costs to Depreciation & Amortisation, with a comparable €4m in H1 2020
17 4. Operating Expenses (excl. Regulatory Costs and Exceptional Items) divided by Total Operating IncomeCovid-19 Mortgage Payment Breaks
Reduced By c.50%1 By End July 2020
10% of Gross Loans 5% of Gross Loans
€bn 1.6 -50%
10.5k
8.1k 0.8
4.8k
1.3k 3.7k
Yield % 2.8% 1.1k 2.7%
PB1 Expired & Option PB1 Expired &
Payment Break Still On Opted Active Payment
Selected Considering Options
Approved Payment Payment Breaks1
(Q2 ‘20) Total 9.4k - Payment Break 1 Expired Break 1 Break 2 (July 20)
• 10.5k Payment Breaks - Classified as Performing Residential Mortgages At End July’20:
• Average Mortgage Size of c.€152k • 9.4k Expired Payment Breaks
• Average Loan To Value (LTV) of 71%
• 40% (3.7k) have availed of Payment Break 2
• Average Yield of 2.80%
• 14% (1.3k) in discussion on Options
• c.50% of Payment Breaks are Tracker Mortgages
• 47% (4.4k) do not require a Payment Break 2
• The Net Impairment Charge at Jun 20 Takes a Prudent Approach to Provisioning
• 4.8k Active Payment Breaks, Average Yield 2.7%
1. Most recent data on Payment Breaks at 30 July 2020. Customers are eligible to apply for a maximum of two Payment Breaks over a 6 month period, each payment break is for a 3 month
18 period. Application for Payment Breaks can be made up until 30 Sept 2020NPL Ratio 6.8%
Stable Since End Of 2019
10% 6.8% NPL Strategy (€1.1bn)
€bn 1.7 -35% 44%
• Operational Cures
(0.5)
(0.1) 1.1 • Other Alternative
56%
Options
Jun 19 Glas II Net Flows Jun 20 Jun-20
Asset Quality / Coverage
Category Balance (€bn) ECL (€bn) Coverage (%)
• Non Performing Loans of €1.1bn, 35% lower YoY
Stage 1 & 2 15.1 0.53 3.5%
• Committed to Mid-Single Digit ratio;
Stage 3 (NPLs) 1.1 0.35 31.9%
Total 16.2 0.88 5.4% • 44% of NPLs are Organic and / or Technical
Cures on a path to cure over the next 12 - 18
months
• Asset Quality Coverage remains appropriate, with Stage 3 Provision Coverage of
c.32% • The balance will be assessed using all
• SREP guidance remains, requirement of coverage levels for secured NPLs (over alternative options while protecting capital
7 years) of 40% from end 2020
19Strong Funding And Liquidity Position
Liquidity Coverage Ratio >200%
Total Funding (€18.8bn) Liquidity And Funding Ratio
18.4 18.2 18.8
0.2 0.4
0.0
0.1 0.7
0.1
0.3
0.6 0.1 0.5 Ratio Dec 19 Jun 20 Movement
LCR 170% 208% +38%
Secured Market Repos
MREL Debt NSFR 138% 142% +4%
17.4 17.2 17.8 AT1
Debt Securities In Issue
LDR 91% 87% -4%
Deposits Encumbrance 6% 5% -1%
Jun-19 Dec-19 Jun-20
• 95% funded by total Customer Deposits, 85% from Retail Deposits including Current Accounts
• The Central Bank of Ireland (CBI) has revised the Bank’s current MREL requirements in order to reflect the reduction in the Counter
Cyclical Buffer (CCyB) from 1% to 0% and has extended the transitional period to comply with this requirement by six months
• Confirmation of revised target with a new MREL decision is expected in early 2021 using the Bank Resolution and Recovery Directive 2
(BRRD2) framework
• At 30 June 2020, the Excess Liquidity held with the CBI was c.€300m at -50bps
20Capital Remains Above Regulatory Requirements
Reduction in Capital Ratios Driven By Prudent Impairment And Higher RWAs
Regulatory Capital Ratios CET 1 Fully Loaded Ratio Movement
Dec-18 Dec-19 (Proforma) Jun-20
RWAs RWAs
€9.7bn €10.0bn
(Proforma)
19.6%
15.5% -0.7%
18.1% 17.9% -0.7%
16.5% 15.0% 16.0% 14.5% -0.1% 0.2% 0.2%
14.7% 13.5% 15.0%
13.9%
12.2% 13.9%
13.95% 12.5%
11.5%
8.94%
10.5%
9.5%
8.5%
-20 7.5%
CET1 Transitional CET1 Fully Loaded Total Capital Transition Dec-19 Payment Half Year Intangibles P&L (excl Other Jun-20
(Proforma) Break RWAs Impairment Impairment)
Call-up
• In response to the Covid-19 pandemic, the CBI have introduced
measures to support the sustainable provision of credit to the
• Reduction in Fully Loaded CET1 ratio primarily due to:
economy; specifically:
• The removal of the Counter Cyclical Buffer (1.0%) • H1 impairment charge of €75m reflecting the revised
macroeconomic outlook as a result of Covid-19
• The early introduction of the CRD V Regulatory
amendment (1.51%)
• Higher Risk Weighted Assets primarily as a result of the risk
• Total CET1 (Transitional) Regulatory Requirement has reduced from captured, which has not yet materialised, in respect of Payment
11.45% to 8.94% Breaks, of c.€0.5bn.
• The Total Capital (Transitional) Regulatory Requirement has reduced from
14.95% to 13.95% • The Bank maintains robust Leverage Ratios with Tier 1 Capital (Fully
Loaded) >7% and Tier 1 capital (Transitional) >8%
• Management CET1 (Fully Loaded) Long Term Target is c.13%
212020 Outlook
Growth Efficiency Returns
• New Lending - c.60% of • Operating Expenses will • 2020 will be loss making as
2019 volumes (€1.7bn) remain stable as we pay for we prudently provide for the
investment and inflationary impact as a result of the
• Net Interest Income will be pressure through sustainable Covid 19 Pandemic
lower as the remaining efficiency savings
higher yielding Treasury • Minimum Management CET1
Assets mature • NPLs - will be managed Ratio on a fully loaded basis
efficiently, while protecting of > 13%
• NIM expected to reduce to capital
Low 170bps in 2020
• Net Impairment Charge –
• Continue to grow Non directly linked to the
Interest Income as emerging macro-economic
transactional activity indicators and impact of
recovers payment breaks c. 70 bps
Annualised in 2020
• Balance Sheet Management
as we wait for revised MREL
Target in 2021
22Summary
• Safe and Secure Balance Sheet with Strong Funding and Capital Positions
• Maintaining Competitive Position in Mortgage Market
• Targeted Growth in SME and Consumer Lending
• Cost Management a Key Focus – Progressing with Business Initiatives to Improve
Efficiency and Drive Digital Transformation
• Well Positioned for Future Challenges and Opportunities
23A N N U A L F I N A N C I A L R E S U L T S
FY 2019
AppendixDomestically Focused Retail And SME Bank
Business Overview Our Physical Landscape
Business
€15bn €5.4bn €10.5bn WEST
12 Branches
Performing Current Account Retail Deposit
Loan Book Balances Balances
NORTH EAST
12 Branches
Market Share
DUBLIN
22 Branches
15.2% 12.2% 11.0%
Residential Current Account Retail Deposit
Mortgage Balances2 Balances2
Balances1
SOUTH EAST
15 Branches
SOUTH
15 Branches
1. % Market Share of Stock of Mortgages as at June 2020. Source: Banking Payments Federation of Ireland.
25 2. Data based on balances as at May 2020. Source: Central Bank Statistics.Historical Financial Information – Income Statement €m FY 2019 FY 2018 FY 2017 FY 2016 FY 2015 Net Interest Income 356 379 407 394 358 Other Income 58 63 38 71 34 ELG Fees - - (2) (4) (14) Total Operating Income 414 442 443 461 378 Total Operating Expenses (Before (330) (331) (329) (341) (317) Exceptional Items Pre-Impairment Profit / (Loss) 84 111 114 120 61 Impairment (Charge) / Write-Back (10) (17) (49) 68 (35) Profit / (Loss) Before Exceptional Items 74 94 65 188 26 Exceptional Items (Net) (32) (91) (13) (414) (460) Profit / (Loss) Before Tax 42 3 52 (226) (434) Key Metrics FY 2019 FY 2018 FY 2017 FY 2016 FY 2015 Net Interest Margin 1.80% 1.78% 1.80% 1.48% 1.12% Headline Cost Income Ratio 1 80% 75% 74% 74% 84% 26 1. Cost Income Ratio is calculated as Operating Expenses (excl. Regulatory Charges and Exceptional Items) divided by Total Operating Income
Historical Financial Information – Balance Sheet

 €bn                                           Dec 2019   Dec 2018   Dec 2017   Dec 2016   Dec 2015

Total Loan Book (net)                             15.6       15.9       18.4       18.9       23.0
Treasury Assets                                    3.6        3.8        3.5        3.9        5.5
Other Assets                                       1.1        2.1        0.9        0.8        0.8
Total Assets                                      20.3       21.8       22.8       23.6       29.3

ROI Retail Deposits (Incl. Current Accounts)      15.0       14.8       14.3       13.6       14.0
Isle of Man Deposits                                 -          -           -       0.4        0.5
Corporate & Institutional                          2.2        2.2        2.7        3.0        4.0
Total Customer Deposits                           17.2       17.0       17.0       17.0       18.5
Wholesale Funding                                  0.9        2.6        3.3        2.8        3.1
ECB Funding                                          -          -        0.2        1.4        4.7
Other Liabilities                                  0.2        0.2        0.2        0.3        0.6
Total Liabilities                                 18.3       19.8       20.7       21.5       26.9
Total Equity (incl. AT1)                           2.0        2.0        2.1        2.1        2.4
Total Equity and Liabilities                      20.3       21.8       22.8       23.6       29.3
Key Metrics:

 NPLs                                           €1.1bn     €1.7bn      €5.3bn     €5.9bn    €6.6bn

 LDR                                              91%        93%        108%       111%      125%

 CET1 Ratio (Fully Loaded Basis)                 14.6%      12.2%      15.0%      14.9%      15.0%

27
Interest Income Analysis

                              Average Balances (€bn)             Yields (%)            Interest Income (€m)

                             H1 2020        H1 2019    H1 2020          H1 2019      H1 2020        H1 2019

 Tracker                       9.4             9.7      1.3%                  1.3%     56               61

Fixed and Variable             6.8             6.7      3.6%                  3.8%     128             126

Consumer Finance               0.3             0.3      9.5%              10.3%        15               17

SME / CRE                      0.1             0.1      3.3%                  3.3%      0               2

Treasury Assets                3.6             4.1       0.1%                 0.7%      4               15

Underlying Interest Income                                                             203             221

 Deferred Acquisition
.Costs and Accounting                                                                  (9)             (16)
.Adjustments

Total Interest Income                                                                  194             205

28
Interest Expense Analysis
Average Balances (€bn) Cost of Funds (%) Interest Expense (€m)
H1 2020 H1 2019 H1 2020 H1 2019 H1 2020 H1 2019
Current Accounts 5.0 4.2 0.0% 0.0% 0 0
Retail Deposits 10.4 10.4 0.2% 0.3% 9 13
Corporate Deposits 2.1 2.5 0.5% 0.5% 5 6
IOM Deposits - - - - - -
Wholesale Funding 0.9 1.8 1.2% 0.3% 6 2
ECB Funding 0.0 0.0 0.0% 0.0% - -
Underlying Interest Expense 20 21
Other 0 3
Total Interest Expense 20 24
29Asset Quality
30-Jun 31-Dec
Loans and Advances to Customers
2020 2019
Measured at Amortised Cost €m €m
Home Loans 12,231 12,260
Buy To Let 3,494 3,598
Total Residential Mortgages 15,725 15,858
SME / CRE 174 165
Consumer Finance 326 366
Total Measured at Amortised Cost 16,225 16,389
Analysed By ECL Staging
Stage 1 9,777 10,999
Stage 2 5,346 4,340
Stage 3 1,100 1,048
POCI 2 2
Neither past due nor Stage 3 15,095 15,295
Past due but not stage 3 28 44
Stage 3 1,102 1,050
Loss Allowance – Statement of Financial Position 16,225 16,389
Stage 1 38 44
Stage 2 488 439
Stage 3 351 335
Total Loss Allowance 877 818
30NPLs and NPAs
Stage 3 Analysis
30-Jun-20 Home Loan Buy-To-Let Commercial Consumer Finance Total
€m €m €m €m €m
NPL is < 90 Days 443 315 25 1 784
NPL is > 90 Days and < 1 year past due 55 22 1 9 87
NPL is 1-2 years past due 28 6 - 1 35
NPL is 2-5 years past due 19 5 2 1 27
NPL is > 5 years past due 102 56 4 5 167
POCI - - - 2 2
Non-performing loans 647 404 32 19 1,102
Foreclosed assets* 8 27 - - 35
Non-performing assets 655 431 32 19 1,137
Gross Loans 12,231 3,494 174 326 16,225
NPLs as % of gross loans 5.3% 11.6% 18.4% 5.8% 6.8%
Stage 3 Analysis
31-Dec-19 Home Loan Buy-To-Let Commercial Consumer Finance Total
€m €m €m €m €m
NPL is < 90 Days 420 294 29 1 744
NPL is > 90 Days and < 1 year past due 46 12 - 7 65
NPL is 1-2 years past due 20 4 - 1 25
NPL is 2-5 years past due 19 8 4 2 33
NPL is > 5 years past due 109 59 8 5 181
POCI - - - 2 2
Non-performing loans 614 377 41 18 1,050
Foreclosed assets* 13 45 - - 58
Non-performing assets 627 422 41 18 1,108
Gross Loans 12,260 3,598 165 366 16,389
NPLs as % of gross loans 5.0% 10.5% 24.8% 4.9% 6.4%
31 * Foreclosed assets are assets held on the balance sheet which are obtained by taking possession of collateral or by calling on similar credit enhancements.Regulatory Capital
30 June 20 31 Dec 19
Transitional Fully Loaded Transitional Fully Loaded
€m €m €m €m
Risk Weighted Assets 9,983 9,970 10,012 9,996
Capital Resources:
Common equity tier 1 1,646 1,385 1,765 1,464
Additional Tier 11 79 96 85 103
Tier 1 Capital 1,725 1,481 1,850 1,567
Tier 2 Capital 66 66 61 61
Total Capital 1,791 1,547 1.911 1,628
Capital Ratios:
Common Equity Tier 1 Capital 16.5% 13.9% 17.6% 14.6%
Tier 1 Capital 17.3% 14.9% 18.5% 15.7%
Total Capital 17.9% 15.5% 19.1% 16.3%
Leverage Ratio2 8.3% 7.2% 9.1% 7.8%
30 June 20 31 Dec 19
Transitional Fully Loaded Transitional Fully Loaded
€m €m €m €m
Total Equity 1,932 1,932 1,997 1,997
Less: AT1 Capital (122) (122) (122) (122)
Adjusted Capital 1,810 1,810 1,875 1,875
Prudential Filters:
Intangible Assets (77) (77) (66) (66)
Deferred Tax (214) (334) (170) (337)
IFRS 9 Transitional Adjustment3 131 - 134 -
Others (4) (4) (8) (8)
Common Equity Tier 1 Capital 1,646 1,385 1,765 1,464
1. The amount of Additional Tier 1 (AT1) Capital and Tier 2 instruments included within the consolidated capital of the holding company is restricted within the limits laid down under the CRR.
Effective 1 January 2018, these restrictions are now fully phased in.
2. The leverage ratio is calculated by dividing Tier 1 Capital by gross balance sheet exposure (total assets and off-balance sheet exposures).
3. The CET1 transitional impact to the Group as a result of EU Regulation 2017/2395 mitigating the impact of the introduction of IRFS IFRS 9 own funds and applies to both the static day 1
32 addback and the dynamic addback for increases in stage 1 & 2 provisions (net of expected loss).You can also read