Wacker Neuson Group - Our way to success
←
→
Page content transcription
If your browser does not render page correctly, please read the page content below
Wacker Neuson Group – Our way to success
Q1/2021
Wacker Neuson in a nutshell

                                 Innovation
                                  leader for       Customer
                                 sustainable       centricity
                                   solutions

                                                            Innovative
                       Resilience to
                                                            products &
                        cyclicality
                                                             services

                              Solid                      Diversified
                            financial                      sales
                              base                       channels

                                           Strong
                                           growth
                                          potential

                                               2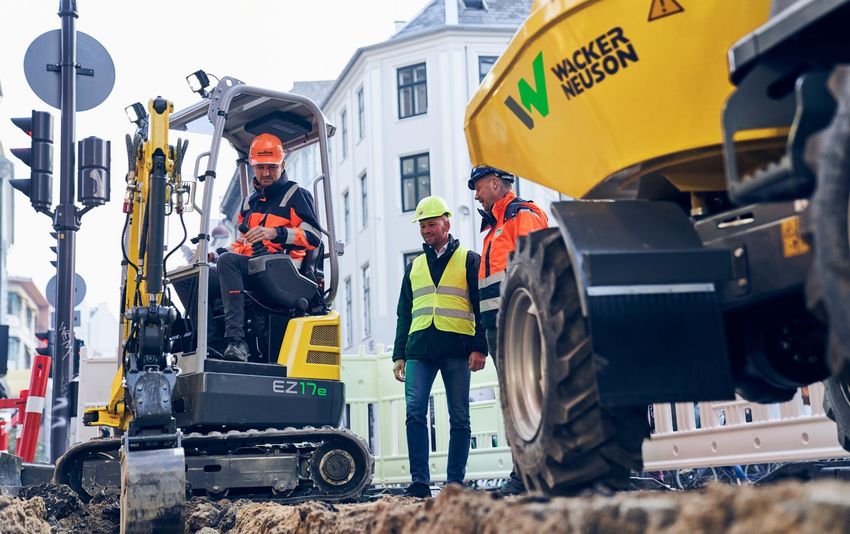
Putting the customer first 01
Who we are 02
Our way to success in different
03
markets
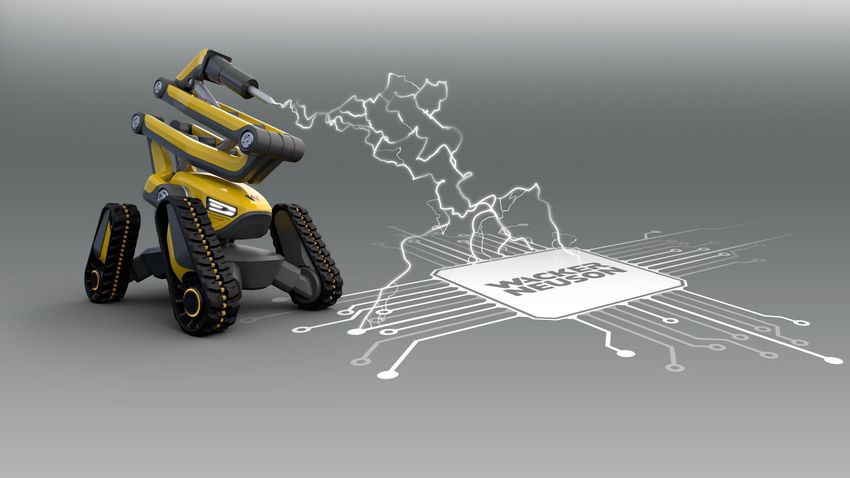
Innovation is part of our DNA 04
Financials Q3/20 05
3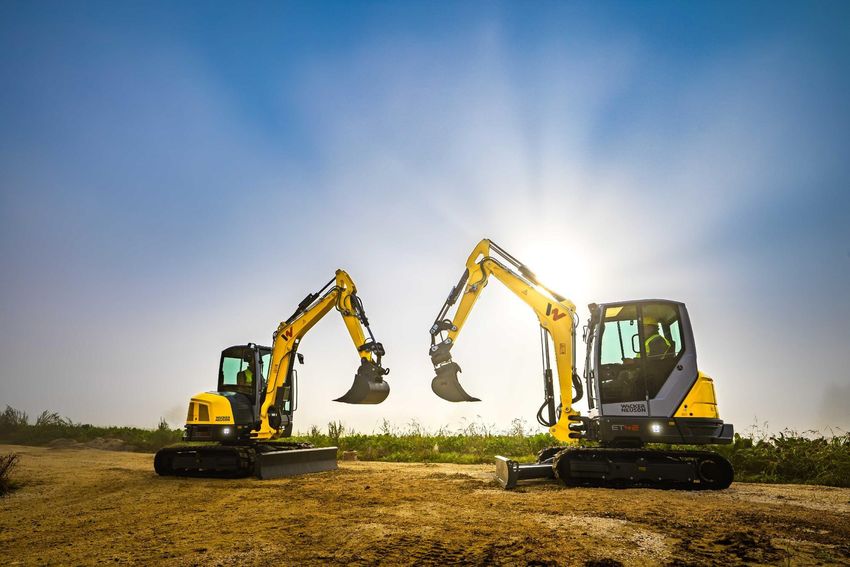
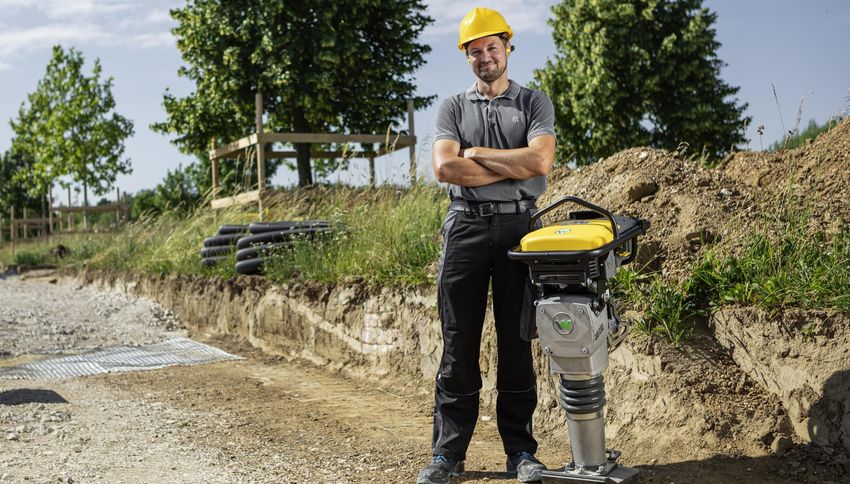
Putting the customer first
Empowering our customers benefits our growth

          Maximum productivity & machine uptime

          Comfortable & intuitive machine handling

         Operator health & safety

        Service, Partnership, Reliability

       Attractive total cost of ownership

                                               5
We drive innovation to improve our customers’ processes

                                                                   Wireless
                   Cockpit                                                                                            Maximizing
                                                                   handling
                  rotatable                                                                                            operator
                                                                    with no
                   by 180°                                                                                             comfort
                                                                  emissions

                                                   Shorter
                                                  process
                                                 times due
                                                  to exact
                                                   vertical
                                                   digging

   Dual View Dumper           Vertical Digging System                     Zero emission             Remote-control steering

                                               Operating
                                              equipment                              Autonomous
                                              without any                             control and
                                                  time                                  digital
                                              restrictions                           performance
                                                                                        record

                                                                                                                     Flexibility
                                                                                                                     with one
                Give your                                                                                             battery
                machines a                                                                                            fitting 7
                  voice!                                                                                             products

  Connected products           Hand-arm vibrations                   Self-driving equipment             Modular design

                                                              6
We see our customers as our partners

                                                Voice
                                             of Customer

                                                                 Strong customer involvement in R&D

           Front Loading
           With our accelerated
             customer-oriented                Technical
           product development              benchmarking
          process, we provide our
          customers with the right
           features and the best                                   Sophisticated value engineering
          quality at the best price.

         Research & Development
                                           Early involvement
                                            of all functions

                                                               Teamwork at every step of the value chain

                                       7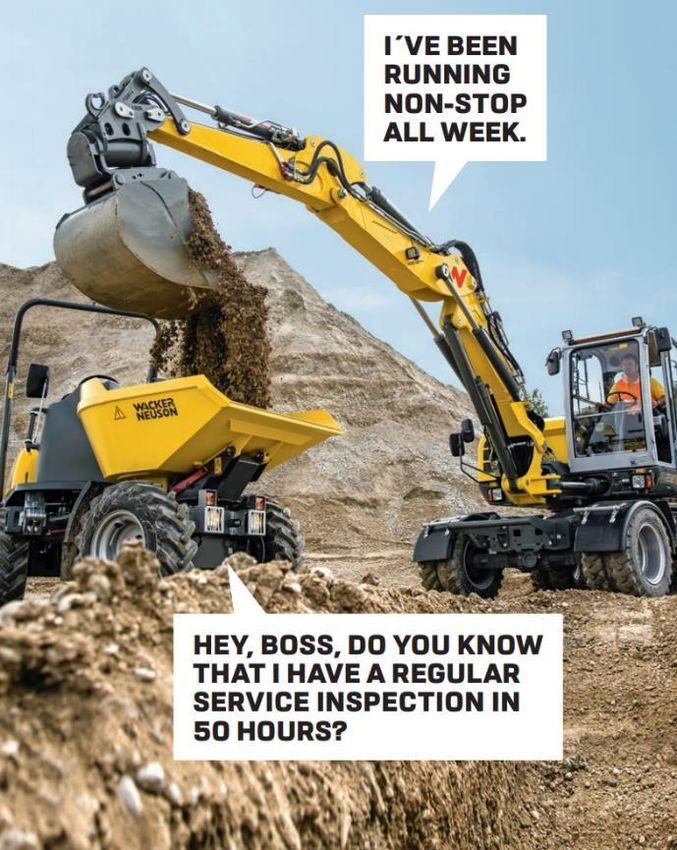
Who we are
We are a one-stop provider with an unrivaled offering

       Light Equipment (LE)                                                                                     Compact Equipment (CE)
                                                              Different product groups

25%
 of Group sales1
                                                                                                                                     55%of Group sales1

                                                                       same customers

                                                                          Services

20%
 of Group   sales1
                      Repair2 &     Rental Service2   Used Machines2    Financial
                                                                        Solutions       E-Store2   Telematics   Concrete    Academy            Genuine Parts
                     Maintenance2                                                                               solutions

                                                                                                                                 1   FY 2019. 2 In selected countries.
                                                                                    9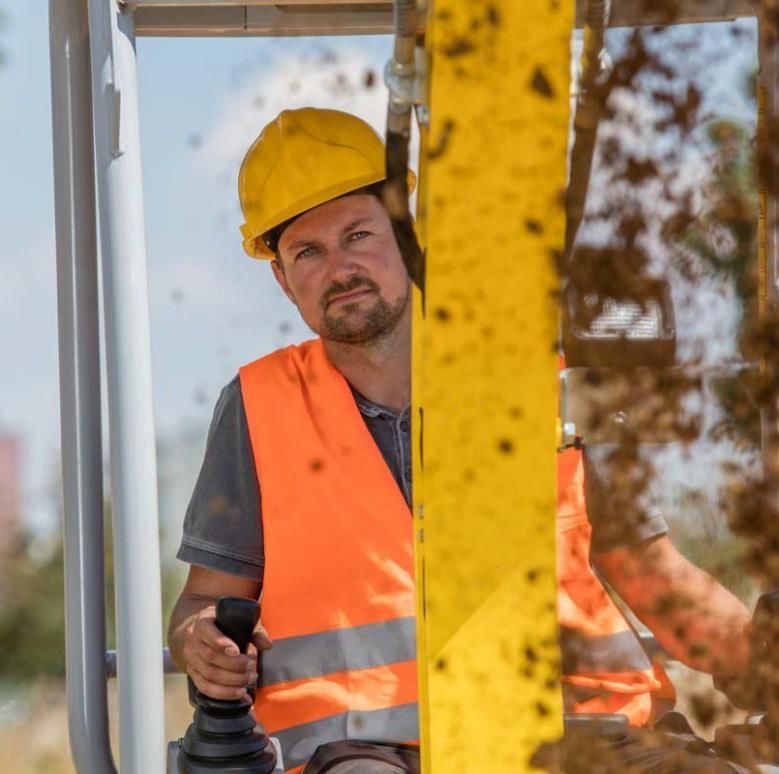
Customers trust in our longstanding expertise in LE
Light Equipment (LE) In 1930, Wacker invented
the electric rammer. The
Concrete technology Compaction term "wacker packer" is still
used on construction sites.
Demolition Power & Lighting Pumps
25%
of Group sales1 Competitors include
Ammann
€ 2,000
Heaters
Bomag
Husqvarna
Average price of an LE product1 Weber MT
1 FY 2019.
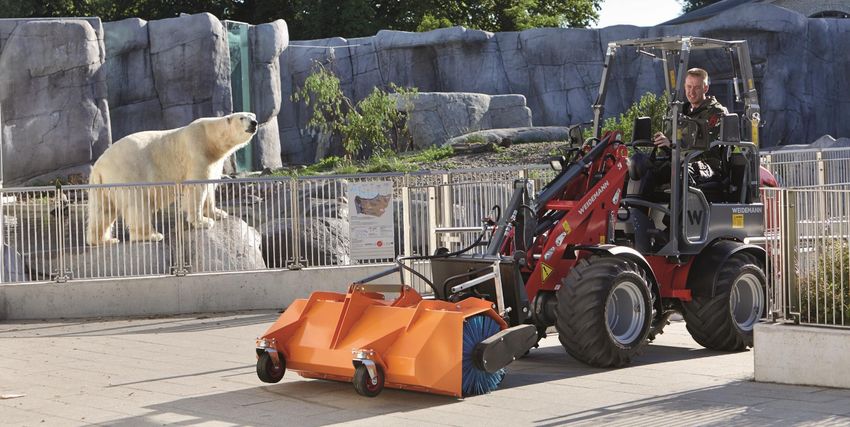
10Customers opt for the advantages of compact equipment
Urbanization, Compact Equipment (CE)
limited space and
mechanization are Excavators
driving demand for
compact equipment
in construction and
agriculture.
EUR 18 Bn
expected value of global compact
construction equipment market Dumpers Backhoe loaders Skid steers / Compact track loaders
accessible to Wacker Neuson in 20251
Competitors include
Kubota
55%
of Group sales2
Telehandlers Wheel loaders
Takeuchi
Yanmar
Manitou
JCB
€ 36,000
Average price of a CE product2
Bobcat (Doosan)
1 own estimates, based on underlying data from CECE and Off-Highway Research 2 FY 2019.
11Service is key to our customers’ success
Customer proximity Comprehensive services Collaborative relationship
Service,
20%
of Group sales1
We are there for our customers, listening,
sharing our expertise and working closely
with them to find the best solutions.
Partnership, Repair2 &
Maintenance2
Rental Service2 Used Machines2
Reliability
Financial Telematics
Solutions E-Store2
>550 Concrete Solutions Academy Genuine Parts
service technicians
in close proximity
to our customers
1 FY 2019. 2 In selected countries.
12We serve our markets with three strong brands
Construction, gardening/landscaping, maintenance/repairs, etc. Agriculture, horse breeders, tree nurseries, etc.
13We strive for long-term stable growth
Revenue development (2010-2019)
[€ m]
CAGR +10.8%
1,901
1,710
1,534
1,375 1,361
1,284
1,160
992 1,092
758
14We attach importance to a solid balance sheet structure
56%Equity ratio1
1.7
Net financial debt/
EBITDA1
Excellent
basis
for further profitable growth
1 As at December 31, 2019.
15Our diversified business dampens cyclical fluctuations
16% of Group sales
from agriculture2
Focus on
maintenance & repair
[units] [€ m] Different cycles in of infrastructure →
agriculture & large infrastructure
2,000 construction projects have no major
-33% impact on our
1,000,000 business
1,600
800,000
Resilience
1,200 to cyclical Rental equipment as
600,000 buffering alternative
Broad customer fluctuations to purchasing new
base, diversified machines
800 target industries → maximum
400,000
+39% flexibility for
customers
200,000 400
0 0
Only small
investment volumes
1
Global equipment sales (units) Revenue WN Group (€ million)
>10
different target
required
industries
1 Source: Off-Highway Research, August 2019. 2 FY 2019
16Clear-cut strategy
Strategy 2022
How we measure success
In light of current developments regarding Covid-19, we
expect the pandemic to continue to have a major impact
into fiscal 2021. Consequently, we expect to achieve our
Strategy 2022 targets one to two years later than
planned.
17Experienced management team
Kurt Helletzgruber, CEO & CFO Felix Bietenbeck, COO Alexander Greschner, CSO
18Our way to success in different markets
19Our diversified sales organization responds to regional needs
Direct sales & Key accounts
Dealers eCommerce1
rent to sell1 & rental firms
Country-specific sales with long-standing customer relationships
1 In selected countries.
20Internationalization – plenty of room to grow
+10%
[€ m]
1,129.8
1,248.9
1,379.0
73%
of Group sales1
3%
24%
of Group sales1
2017 2018
EUROPE
2019 of Group sales1
+15%
+5%
[€ m] 459.5
62.6
59.8
401.3 [€ m]
357.5
46.6
2017 2018 2019
2017 2018 2019
AMERICAS
APAC
1 FY 2019.
21Europe – We are striving to increase market shares
Further Gaining Expansion in
strengthening of
our market
position
significant market
shares in UK &
France (i.a.)
agriculture with
Weidemann and
Kramer
Game
changer
We have redefined
Major market shares in DACH – safety and accelerated our
plenty of room for growth customers’ processes with
Western Europe: in other regions our Dual View dumpers
Relative size of equipment markets1
Others, 6%
Denmark, 2%
Switzerland, 2% Germany, 29%
Spain, 3%
Norway, 3%
Sweden, 3%
Belgium, 3%
Charles Messenger, Galtec Ltd. “It’s a
Netherlands, 4%
lovely bit of kit, […] I’m very
impressed so far. It’s going to be
2019
Italy, 11%
ideal for the winter, no more
sitting out in the open exposed
to the wind and rain, which will
Light Equipment be really nice. Not only that, but
France, 19% they are safe and will save time
United Kingdom, 15% Compact Equipment without a doubt.”2
Services
1 Source: Off-Highway Research, Sept. 2020 2 Charles Messenger, Galtec Ltd.
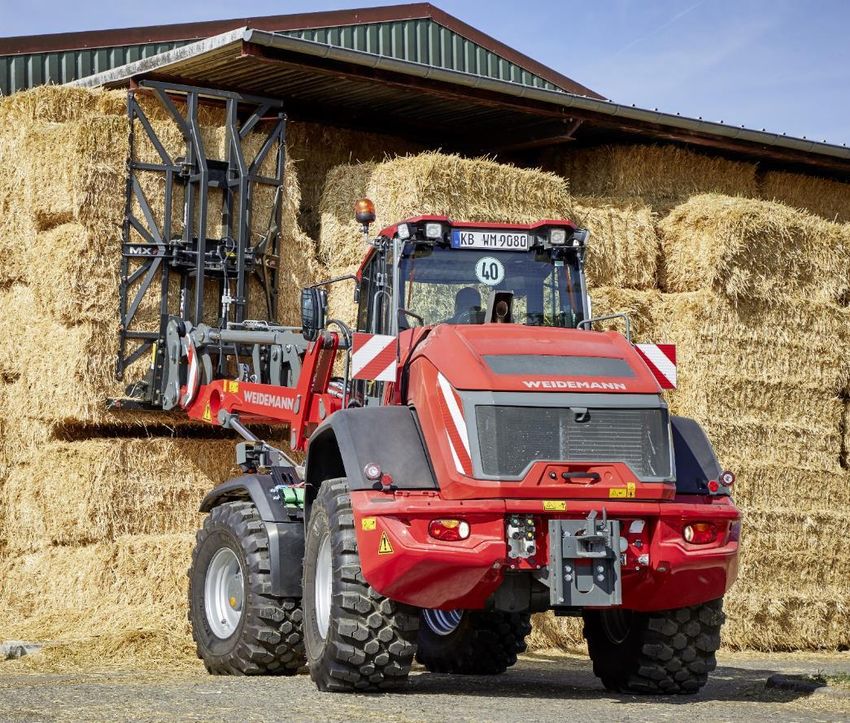
22Europe – We are growing our business in the ag sector
All-wheel steering
16%
of Group sales
Our customers are mainly dairy and
cattle farmers who work in confined
spaces such as stables.
+21%
growth in CE for the
from agriculture1 They require small, highly
maneuverable machines with a
minimal turning radius and
outstanding stability.
agricultural sector1
Articulated steering
Development of revenues in the ag sector1
Revenue in € million
+12.6% CAGR
300
200
100
0
2015 2016 2017 2018 2019
1 FY 2019.
23Americas – A market with huge growth potential
Forecast sales of construction
equipment North America (units)1
60 years
in the US light equipment market with
250,000
200,000
high market shares 150,000
100,000
50,000
0
2019 2019 2020 2021 2022 2023 2024
Light Equipment
Compact Equipment
Services
Financing Extension of Skid steers as Large
programs set dealer door opener potential for
up to enable network for LE for compact further market
future growth & CE equipment share gains
1 Source: Off-Highway Research, September 2020.
24APAC – We benefit from structural market changes in China
Changing market structure in China – compact equipment on the rise1 2019
100%
85,000
80% Light Equipment
60%
40%
28%
of mini excavator
Compact Equipment
Services
20% sales worldwide
0% 2019
Mini excavator market China 2019 (units)1
Crawler Excavators Wheeled Loaders
Mini Excavators Mobile Cranes
Compactors & Pavers Graders & Dozers
Even small
Serving export Introducing new
market shares
markets from excavator models
would leverage
plant in Pinghu, to counteract
our sales
China price pressure
significantly
1 Source: Off-Highway Research, Feb. 2020.
25Innovation is part of our DNA
We drive innovation to improve our customers’ processes

                                                                    Wireless
                   Cockpit                                                                                             Maximizing
                                                                    handling
                  rotatable                                                                                             operator
                                                                     with no
                   by 180°                                                                                              comfort
                                                                   emissions

                                                   Shorter
                                                  process
                                                 times due
                                                  to exact
                                                   vertical
                                                   digging

   Dual View Dumper           Vertical Digging System                      Zero emission             Remote-control steering

                                               Operating
                                              equipment                               Autonomous
                                              without any                              control and
                                                  time                                   digital
                                              restrictions                            performance
                                                                                         record

                                                                                                                      Flexibility
                                                                                                                      with one
                Give your                                                                                              battery
                machines a                                                                                             fitting 7
                  voice!                                                                                              products

  Connected products           Hand-arm vibrations                    Self-driving equipment             Modular design

                                                              27
We drive electrification in our industry
“If we learn early enough that
ambitious climate demands will
be imposed, we can drive
innovation forward by
demanding zero-emission
solutions from machinery
manufacturers, equipment
suppliers and contractors.”1
AS60e
Through a smart and AP1840e AP2560e
innovative procurement
EZ17e AP1850e
strategy, the City of Oslo
reduces climate gas
emissions at
ACBe
construction sites.
Change
We are well prepared for the
DT10e
shift to zero emission
construction sites DW15e
Full portfolio of zero emission products
1 Ole Henrik Ystehede, director of EBA (Contractors Association - Building and Construction) for Oslo/Akershus/Østfold.
28Digitalization creates new opportunities for our business
Give your machines a voice
Connected products –
always a step ahead
Pinpointing location –
connected jobsites
Increasing runtime –
predictive maintenance
Optimizing utilization
Transparency –
Real-time data analysis
Increasing efficiency –
smart products
29Innovation is our answer to a changing world
- Process - Maintenance of - Food
optimization infrastructure
- Mechanization
- Telematics - Limited space
- Infrastructure
- Smart products - Clean air
regulations - Housing
- Building Infor-
mation Modeling - Noise pollution - Energy efficiency
(BIM)
- Growing - Waste
middle class management
30Financial results Q3/20
31Revenue and earnings Q3/20
Q3/20: Drop in revenue related to coronavirus crisis Q3/20: Comments
Revenue -16.5% EBIT Revenue -16.5% yoy (adj. for FX effects: -15.0%)
[€ m] margin
517 ▪ Single-digit revenue decline in Europe; significant double-digit drop in the
469 468 480 20%
500 435 Americas; Asia reports slight growth
416 411
386 391
400 15% ▪ Services segment clearly above prior year; H1 growth continues
10.7%
300
10.1%
8.9% 8.8%
Gross profit -17.6% yoy (gross profit margin -0.3 PP)
7.1% 7.0%
10%
200 5.4% 5.6% 5.8% ▪ Capacity utilization at production plants due to low sales volumes and
5% significant inventory reduction below prior year’s levels
100
▪ Favorable product mix driven by strong services segment, fueled in
0 0% particular by higher sales of rental equipment (rent-to-sell)
Q3/18 Q4/18 Q1/19 Q2/19 Q3/19 Q4/19 Q1/20 Q2/20 Q3/20
EBIT -44.7% yoy (EBIT margin: -3.0PP)
▪ Operating costs significantly below prior year; conversely bad debt
Income statement (excerpt)
allowances amounted to € 7.5 m (attributable to the Americas in particular);
€ million Q3/20 Q3/19 9M/20 9M/19 short-time work models cut back significantly relative to Q2/20
Revenue 390.8 468.2 1,187.5 1,420.8 ▪ Restructuring expenses linked to the cost reduction and efficiency
Gross profit 98.0 118.9 302.9 367.7 enhancement program: € 1.7 m; EBIT before restructuring costs: € 24.5 m
as a % of revenue 25.1% 25.4% 25.5% 25.9% (margin: 6.3%)
Operating costs1 -77.0 -80.6 -227.4 -249.6
as a % of revenue -19.7% -17.2% -19.1% -17.6% Earnings per share -56.8% yoy
EBIT 22.8 41.2 73.2 127.4 ▪ Financial result slightly below prior year; negative FX effects (€ -1.1 m yoy);
as a % of revenue 5.8% 8.8% 6.2% 9.0% in contrast less negative interest income (€ +0.7 m yoy)
Financial result -5.6 -5.2 -19.4 -11.6
▪ Tax rate at 35.5% (Q3/19: 28.6%); mainly due to losses reported by
Taxes on income -6.1 -10.3 -20.0 -35.7
affiliates for which no deferred taxes could be capitalized; existing deferred
Profit for the period 11.1 25.7 33.8 80.1
Earnings per share (€) 0.16 0.37 0.48 1.14
tax assets were partly written down
1 Excl. other income/expenses.
32Revenue and earnings 9M/20
9M/20: Sales decline related to coronavirus crisis 9M/20: Comments
Revenue -16.5% EBIT Revenue -16.4% yoy (adj. for FX effects: -16.0%)
[€ m] margin
517 ▪ Sales decline related to Covid-19, most severe impact in Americas,
469 468 480 20%
500 435
central Europe had a balancing effect, Ag business for the Group -3% yoy
416 411
400
386 391
15%
▪ Services segment shows positive development (+7% yoy)
10.7%
300
10.1%
8.9% 8.8%
Gross profit -17.6% yoy (gross profit margin -0.4 PP)
10%
7.1% 7.0%
5.8%
▪ Lower volumes burden gross profit; measures to soften impact of Covid-19:
200 5.4% 5.6%
cut in production programs, additional company holidays, various models of
5%
100 short-time work
0 0% ▪ Favorable product mix thanks to strong services segment
Q3/18 Q4/18 Q1/19 Q2/19 Q3/19 Q4/19 Q1/20 Q2/20 Q3/20
EBIT -42.5% yoy (EBIT margin: -2.8PP)
▪ Operating costs significantly below prior year
Income statement (excerpt) ▪ Impairment on accounts receivable amounted to € 12.5 m (attributable to
the US in particular)
€ million Q3/20 Q3/19 9M/20 9M/19
▪ Restructuring expenses linked to the cost reduction and efficiency
Revenue 390.8 468.2 1,187.5 1,420.8
enhancement program sum up to € 3.8 m
Gross profit 98.0 118.9 302.9 367.7
as a % of revenue 25.1% 25.4% 25.5% 25.9%
▪ EBIT before impairment on US goodwill (€ -9.3 m) and restructuring costs
Operating costs1 -77.0 -80.6 -227.4 -249.6 from CEP (€ -3.8 m) at € 86.3 m (margin of 7.3%)
as a % of revenue -19.7% -17.2% -19.1% -17.6% Earnings per share -57.9% yoy
EBIT 22.8 41.2 73.2 127.4
▪ Financial result significantly below prior year; negative FX effects (€ -8.5 m
as a % of revenue 5.8% 8.8% 6.2% 9.0%
yoy); less negative interest income (€ +0.7 m yoy)
Financial result -5.6 -5.2 -19.4 -11.6
Taxes on income -6.1 -10.3 -20.0 -35.7 ▪ Tax rate at 37.2% (Q3/19: 30.8%); Aforementioned negative FX effects and
Profit for the period 11.1 25.7 33.8 80.1 impairment loss are not tax deductible; write-offs or non-capitalization
Earnings per share (€) 0.16 0.37 0.48 1.14 of deferred tax assets
1 Excl. other income/expenses.
33Business development by region and business segment
Q3/20: Significant decline in sales in Americas Q3/20: Comments
Revenue [€ m] Revenue Europe -8.2% yoy (adj. for FX effects: -7.7%)
Share yoy EBIT1
▪ Stable development in DACH region (Wacker Neuson brand), fueled in
Europe 310.0 79% -8% 27.1
particular by gains in the services segment
▪ Growth in UK despite weak demand from major rental chains,
Americas 65.9 17% -43% -12.3
continued market share gains with dumpers
▪ Double-digit decline in revenue in Scandinavia, Southern Europe and
Asia-Pacific 14.9 4% +1% -0.9
France
▪ Business with compact equipment for agriculture below prior year
Total Q3/20 390.8 100% -17% 22.8
(revenue -12.2% yoy)
Revenue Americas -43.1% yoy (adj. for FX effects: -38.8%)
Q3/20: Services segment remains on growth path ▪ Willingness to invest remains very low among dealers,
key accounts and rental chains due to market uncertainty
Revenue [€ m]2
Share yoy ▪ Order intake again above prior year; US plant started to gradually ramp
up at the end of Q3/20
Light equipment 87.8 22% -31%
Revenue Asia-Pacific +1.4% yoy (adj. for FX effects: +4.3%)
Compact equipment 199.6 51% -20% ▪ Significant double-digit growth in China, demand for excavators and
light equipment develops positively
Services 106.6 27% +9% ▪ Single-digit growth in Australia/New Zealand despite challenging
market conditions
Total Q3/20 394.0 100% -17% ▪ Revenue in Southeast Asia almost halved due to severe impact of the
coronavirus pandemic
1 EBIT for regions before consolidation.
34 2 Revenue by business segment before cash discounts.Further decrease in net working capital
Inventory Trade receivables
Inventory DIO1 Trade receivables DSO2
[€ m] [days] [€ m] [days]
700 633 645 663 400 500 200
603 623
553 413 400
600 544 371
500 476 400 359 345
500 300 320 150
304 303
300 273
400 179 173
188
171
151 144 155 147 148 200 78 73 78 77 76 100
300 67 68 64
200 59
200 100 50
100
100
0 0 0 0
Q3/18 Q4/18 Q1/19 Q2/19 Q3/19 Q4/19 Q1/20 Q2/20 Q3/20 Q3/18 Q4/18 Q1/19 Q2/19 Q3/19 Q4/19 Q1/20 Q2/20 Q3/20
Trade payables Comments
Trade payables DPO3 ▪ Further reduction of inventory levels; marked cut-back in production
[€ m] [days]
programs in response to the Covid-19 pandemic; further reduction in
250 200
213 208 inventory planned by end of Q4; medium-term target: 25% of sales
199 189
200
167 164 150 ▪ Receivables continue to decrease; high levels in previous year partly
150
150 122 due to strong revenue growth especially during the first half of the year
113 100
100 56 59 57
50 48 43 37 38 35
▪ Trade payables at a low level, impacted by capacity reductions
50
50
→ Reduction of net working capital continues (see next slide)
0 0
Q3/18 Q4/18 Q1/19 Q2/19 Q3/19 Q4/19 Q1/20 Q2/20 Q3/20
1 Days inventory outstanding = (inventory/(cost of sales*4))*365 days; 2 Days sales outstanding =
35 (receivables/(revenue*4))*365 days; 3 Days payables outstanding = (payables/(cost of sales*4))*365 days.Free cash flow in Q3 at € 87 million
Net working capital Cash flow from operating activities
Net working capital Net working capital Cash flow from operating activities
[€ m] [as a % of revenue]1 [€ m]
899
858 100% 150 120 102
797 812 779 107
800 743
100
638 644 636 80%
22
600 50 10
48% 48% 60% 10 3
46% 47%
41% 42% 41% 0
38%
400 34%
Q3/18 Q4/18 Q1/19 Q2/19 Q3/19 Q4/19 Q1/20 Q2/20 Q3/20
40%
-50 -28
200 20% -100
0 0% -150 -115
Q3/18 Q4/18 Q1/19 Q2/19 Q3/19 Q4/19 Q1/20 Q2/20 Q3/20
Free cash flow Comments
Free cash flow ▪ Reduction of net working capital continues (€ -106.7 m vs. Q2/20); at
[€ m]
40.7%, net working capital as a percentage of revenue1 significantly
84 89 87 below the previous year (48.0%) despite reduced business volume
80
▪ By contrast, miscellaneous liabilities (related to deferred VAT liabilities
40 4 and social security contributions from Q2/20) developed less favorably
0
-40
Q3/18 Q4/18 Q1/19 Q2/19 Q3/19 Q4/19 Q1/20 Q2/20 Q3/20 ▪ Cash flow from investment activities amounted to € -20.7 m for Q3/20
-3 -9 -16
-80
-42 and € -52.6 m for 9M/20 (Q3/19: € -18.0 m; 9M/19: € -59.5 m)
-120 ▪ Free cash flow amounted to € 86.5 m for Q3/20 and € 179.4 m for
-160 -142 9M/20 (Q3/19: € -15.5 m; 9M/19: € -200.0 m)
1 Net working capital/annualized revenue for the quarter.
36Reduction in gearing, liquidity secured
Net financial debt and gearing1 Net financial debt/EBITDA2
Net financial debt Net financial debt/
Gearing1
[€ m] EBITDA2 [x]
513 2.0
484 80% 2.0 1.9
500 439 446 1.7
1.6 1.6
1.5
400 358 363 60% 1.5 1.4
41% 42% 276
300 36% 36%
193 205 29% 29% 40% 1.0 0.8 0.7
200 22%
16% 17%
20% 0.5
100
0 0% 0.0
Q3/18 Q4/18 Q1/19 Q2/19 Q3/19 Q4/19 Q1/20 Q2/20 Q3/20 Q3/18 Q4/18 Q1/19 Q2/19 Q3/19 Q4/19 Q1/20 Q2/20 Q3/20
Equity and equity ratio Comments
Equity Equity ratio ▪ Accelerated reduction in net financial debt; gearing close to target of
[€ m]
1,400 100%
below 20%
1,200 1,221 1,242 1,188 1,217 1,225 1,240 1,242 1,245
1,200
80%
▪ Ratio of net financial debt to EBITDA still above planned level due to
1,000 low profitability
800 60%
65% 64%
58% 58%
▪ Reduction in total debt; equity ratio increases to 58 percent
600 52% 54% 56% 54% 55%
40%
400 ▪ Long-term financing: placement of a promissory note
200
20% (Schuldscheindarlehen) in the amount of € 50 m in August 2020; short-
term credit lines replaced
0 0%
Q3/18 Q4/18 Q1/19 Q2/19 Q3/19 Q4/19 Q1/20 Q2/20 Q3/20 ▪ Cash3 at end of Q3/20: € 161.8 m (previous year: € 23.5 m)
1 Net financial debt/equity.
37 2 Net financial debt/annualized EBITDA for the quarter. 3 Incl. cash equivalents.Share development
The share in 20201 Covid-19: Suspension of dividend payment
% +3%
62%
2.80 53% 48% 53%
125 38%
50%
2.30 2.06 0%
100
0%
1.80
75 1.30 1.25 1.26 -50%
1.30 1.10
0.94
50 0.81 0.50
0.80 0.60
-100%
0.50 0.50 0.50
25 0.60 -150%
0.30 0.00
-0.20 2014 2015 2016 2017 2018 2019 -200%
Wacker Neuson SDAX DAX Peer group 2 EPS in € Dividend per share in € Payout ratio
Special dividend in €
Key figures per share Coverage1 Shareholder structure
Bank TP (€) Recom. Date
in € 9M/20 9M/19
Hauck & Aufhäuser 23.50 Buy Nov. 20, 2020
Earnings per share 0.48 1.14 Metzler 22.50 Buy Oct. 14, 2020
Warburg 20.00 Buy Nov. 30, 2020 Family 58%
Book value per share 17.75 17.35 Jefferies 19.50 Buy Nov. 18, 2020
Berenberg 19.00 Buy Nov. 19, 2020
Share price at end of period 17.44 16.00 Free float 42%
Bankhaus Lampe 18.00 Buy Nov. 19, 2020
Commerzbank 15.00 Hold Nov. 05, 2020
Market capitalization (€ m) 1,223.2 1,122.2 Kepler Cheuvreux 11.00 Reduce Nov. 19, 2020 (Total shares: 70,140,000)
1 As at Dec. 31, 2020 2 Peer group: Agco, Ashtead, Atlas, Bauer, Caterpillar, CNH Industrial, Deutz, Doosan
38 Bobcat, Hitachi, Husqvarna, John Deere, Komatsu, Kubota, Manitou, Takeuchi, United Rentals, Volvo.2020 – Outlook
Business index for construction Guidance for fiscal 2020
▪ Mood in the construction sector continues to recover according to
CECE; revenue in Europe declining at a slower rate than in previous
months
▪ Mood in the agricultural sector has continued to increase strongly after
having reached the positive range in October for the first time since mid-
2019.
▪ High degree of uncertainty due to renewed global rise in infection rates
and tighter government restrictions
▪ Due to existing uncertainties it is still not feasible to quantify
revenue and earnings guidance published on August 5
Business Index Current Business Situation Future Expectations
Source: CECE, December 2020. − Revenue and EBIT margin expected considerably lower than the
Business index for agriculture prior-year figures
− Continued reduction of net working capital until end of year, albeit
at a slower pace than in the previous months (previously: net
working capital significantly lower than the prior-year figure)
− Investments of around € 80 m planned
▪ Corona pandemic is expected to continue to have a major impact
6,5 – 8,5%
into fiscal 2021
▪ Group expects to achieve Strategy 2022 goals one to two years
later than planned
− Revenue > EUR 2 bn
− EBIT margin > 11%
2012 2013 2014 2015 2016 2017 2018 2019 2020
Source: CEMA, December 2020. − NWC ratio ≤ 30%
39Financial calendar and contact
March 25, 2021 Publication of the annual report 2020, analysts‘ & investors‘ conference call
May 10, 2021 Publication of Q1 report 2021, analysts‘ & investors‘ conference call
May 26, 2021 Virtual Annual General Meeting, Munich
August 09, 2021 Publication of half-year report 2021, analysts‘ & investors‘ conference call
November 10, 2021 Publication of Q3 report 2021, analysts‘ & investors‘ conference call
Disclaimer Contact
This report contains forward-looking statements which are based on current estimates and assumptions made by corporate management at Wacker Neuson SE. Forward-looking statements are
characterized by the use of words such as expect, intend, plan, predict, assume, believe, estimate, anticipate and similar formulations. Such statements are not to be understood as in any way
guaranteeing that those expectations will turn out to be accurate. Future performance and the results actually achieved by Wacker Neuson SE and its affiliated companies depend on a number of risks
and uncertainties and may therefore differ materially from forward-looking statements. Many of these factors are outside the Company's control and cannot be accurately estimated in advance, such as Wacker Neuson SE
the future economic environment and the actions of competitors and market players. The Company neither plans nor undertakes to update any forward-looking statements.
Contact IR: +49 - (0)89 - 354 02 - 427
All rights reserved. Valid January 2021. Wacker Neuson SE accepts no liability for the accuracy and completeness of information provided in this brochure. Reprint only with the written approval of
Wacker Neuson SE in Munich, Germany. The German version shall govern in all instances. ir@wackerneuson.com
www.wackerneusongroup.com
40You can also read