Enel Américas Investor Day - Strategic Plan 2020-22

Page created by Marcus Guzman
 
CONTINUE READING
Enel Américas Investor Day - Strategic Plan 2020-22
Enel Américas
Investor Day

Strategic Plan 2020-22

December 2, 2019
Enel Américas Investor Day - Strategic Plan 2020-22
Agenda

                                    Our Positioning

         Maurizio Bezzeccheri       Sustainability = Value
          Chief Executive Officer

                                    Our vision for the future

                                    2020-22 Strategic plan

                                    Our vision in numbers

            Aurelio Bustilho        Financial management
          Chief Financial Officer
                                    De-risking our business

                                    Earnings & targets

         Maurizio Bezzeccheri       Closing Remarks

                                                                2
Investor Day
Strategic Plan 2020-22

Maurizio Bezzeccheri
CEO
Our positioning
Enel Américas is Latin America’s largest private power
Our positioning

                   Company….
                  Colombia                                                                                 # End users
                  Generation
                  3,505 MW
                  20% Market Share in Installed capacity                                                  24.7 mn
                  Net Production 14,975 GWh
                  Sales Gx 18,542 GWh
                  Networks
                  3.5 million clients                                                                Total installed capacity
                  Sales Dx 14,228 GWh

                  Peru
                  Generation                                                                          11.3 GW
                  1,993 MW
                  15% Market Share in Installed capacity
                  Net Production 8,129 GWh
                  Sales Gx 12,380 GWh
                  Networks
                                                                                   Brazil
                  1.5 million clients
                                                                                   Generation
                  Sales Dx 8,286 GWh
                                                                                   1,354 MW
                  Argentina                                                        1% Market Share in Installed capacity
                  Generation                                                       Net Production 4,202 GWh
                  4,419 MW                                                         Sales Gx 30,022 GWh
                  12% Market Share in Installed capacity                           Networks
                  Net Production 13,569 GWh                                        17.2 million clients
                  Sales Gx 13,569 GWh                                              Sales Dx 80,995 GWh
                  Networks                                                         Transmission                                 5
                  2.5 million clients                                              2,100 MW transmission lines
                  Sales Dx 16,313 GWh
                                                           Note: Guidance 2019E.
…with a well balanced ownership structure1 and listed
Our positioning

                  on two relevant stock exchanges…
                                                      Other
                                                   shareholders
                                Chilean pension        1.8%
                                     funds
                                                                                     Enel Américas’ shares are traded on:

                        Local                12.4%
                     shareholders
                                     6.8%

                     Foreign        15.19%
                                                                  57.3%
                                               6.54%
                                                                          Enel SPA
                   shareholders     15.2%                                                 Market Cap today2: US$ 14.61 bn

                                            6.5%                                                              ~60%
                            ADR holders

                                                                                           Market Cap 20163: US$ 9.29 bn

                                                                                                                            6
1. As of September 30, 2019.
2. As of November 29, 2019 (Source: Bloomberg).
3. End of December 2016, (Source: Bloomberg)
…with a sustainable and diversified business model
 Our positioning

                   built to generate shareholder return…
                                EBITDA 2019E by business                                     Shareholder return 2016-20191

                                                                                                       +45 p.p.
                                                  1%
                                                                                             +3 p.p.
                                             7%
                                                            25%
                                                                                32%
                                                                                 59%                      56%

                                         US$ 4.1 bn
                                                                                                         21%
                                                                  11%

                                       56%
                                                                                                                             14%
                                                                                                                             3%
                                                                             Enel Américas              DJI Index      SPCLXIPSA
                    Large hydro gen.      Thermal gen.            Networks

                    Retail                Enel X                                   Américas
                                                                                                                                   7

1. From April 21, 2016 to November 29, 2019. Source: Bloomberg.
Sustainability = Value
Sustainability=Value

                       Sustainability and ESG approach is also a commitment
                       of the Enel Américas’ Board of Directors
                          Policies formally approved by the Board of Directors   ESG recognitions

                                                                                                          Chile Index
                        Biodiversity                                                                     MILA Index
                        Environmental                                                                    Emerging markets Index

                        Human Rights
                        Non discrimination & diversity
                        Community Involvement

                                                                                 Emerging markets Index        MSCI EM SRI Index
                                  Governance and Board of Directors               Latin America Index

                        Independent Board Members: 43% (3 of 7)

                        Non executive Board Members: 100%

                                                                                                                                   9
Sustainability=Value

                         Choosing a sustainable business model improved
                         visibility of targets and economic results…
                                               EBITDA 2016 vs 2019E                            Group net income (US$ bn)

                                                   +71%                                                +197%

                          ~80% activities                       ~90% activities zero direct
                       zero direct emissions                          emissions
                                                                          1%                                           1.7
                                                                         7%
                                                                                 25%
                                             33%

                        49%   US$ 2.4 bn                              US$ 4.1 bn
                                                                                     11%
                                                                                              0.6
                                                                   56%
                                      18%

                                2016                                     2019E                2016                    2019E

                                    Large hydro gen.   Thermal gen.       Networks
                                                                                                                              10
                                    Retail             Enel X
…and entailed a repositioning of our capital allocation
Sustainability=Value

                       on zero direct emission activities…
                                       Total CAPEX: 2016 vs 2019                                             Non-organic growth in assets from zero direct emission activities

                                                                                                                                     Enel Dx Goiás (Ex Celg)
                                                                      2% 4%                                                               consolidation
                                                                            5%                                                  1. Purchase price: US$ 720 million             1Q
                                  9%                                             10%                                            2. Clients: 2.9 million
                                                                                                                                3. Location: State of Goiás                    17
                                        15%

                           US$ 1.2 bn                                 US$ 1.7 bn

                                                                                                                                       4Q                  Volta Grande consolidation
                                                                                                                                                       1. Purchase price: US$ 445 million
                          76%
                                                                      78%                                                              17              2. Installed capacity: 380 MW
                                                                                                                                                       3. Location: State of Minas Gerais

                                2016                                   2019E
                                                                                                                                        Enel Dx São Paulo (Ex
                                                                                                                                       Eletropaulo) acquisition                 2Q
                            Networks                         Large hydro gen.           Thermal gen.                               1. Purchase price: US$2,3781 million
                                                                                                                                   2. Clients: 7.2 million                      18
                            Thermal gen.                     Retail                     Enel X                                     3. Location: Sao Paulo

                            Large hydro gen.                 Networks
                                                                                                                                                                                                 11
                                                                                                                 Total investments of US$ 3.5 bn in acquisitions
1. It considers 156 m shares acquired during the tender offer of Enel Dx Sao Paulo and more than 33 m shares issued during the Enel Dx Sao Paulo’s capital increase. Share Price of R$45.22 and BRL/USD FX
   Rate as of 3.60.
…also supported by hydro generation that represents a
Sustainability=Value

                       relevant EBITDA with a light CAPEX plan…
                                                                                                    4               65 hydro
                                                                                                 countries           plants

                       Large hydro installed capacity (GW)   Large hydro net production (TWh)   Large hydro EBITDA (US$ bn)

                                       +8%                               +10%                                +23%

                                                                                                                        1.0
                                                  6.2
                              5.8                                                    24.9
                                                                 22.6                              0.8

                             2016                2019E           2016               2019E         2016                 2019E

                                                                                                                               12
…and mainly driven by our strategy of grid expansion and
Sustainability=Value

                       digitalization to create value and enable efficiencies…
                                                                                                                                2016              2019E
                              Colombia                                                                                           End Users          End users
                                                         Bogotá                                              Brazil
                          Enel Codensa                                                    Ceará
                                                                                                                               14 mn             25 mn
                                                                                                         Enel Dx Río
                                                                                                         Enel Dx Ceará
                                                                                                                                    RAB                RAB
                                                                                 Goiás
                                                                                                         Enel Dx Goiás

                                                  Lima                                                   Enel Dx São Paulo
                                                                                                                              US$ 7.1 bn        US$ 12.2 bn
                                          Peru                                                                                 OPEX/End user      OPEX/End user
                                                                                   Rio de Janeiro
                                                                                                                              64 US$/cl          59 US$/cl
                                  Enel Dx Perú                                       Sao Paulo

                                                                                                                                  Networks           Networks

                                                                                                                              305 th km          609 th km
                                                                                            Argentina
                                                                  Buenos Aires

                                                                                                                               CAPEX per year     CAPEX per year
                                       7                                             Edesur
                                      Grids                                                                                   US$ 0.9 bn        US$ 1.3 bn

                                                                                                                                                                   13
…and a successful story of integration and turnaround of
Sustainability=Value

                       our acquisitions. Enel Dx Sao Paulo, a good example…
                        256 initiatives on going with an impact of                                             EBITDA1 (US$ mn)            SAIDI2 (h)
                        US$ 52 mn EBITDA in 2019

                                                                                                                    +64%                      -3%
                        5 Working groups and +200 people involved
                                                                                                                                    7.2                  7.0
                                                                                                                             615
                        148 new ideas sent through a collaborative                                           376
                        platform
                                                                                                                                    2018                2019E
                                                                                                             2018           2019E

                                 Energy distributed (TWh)                                                       OPEX1 (US$ mn)             SAIFI3 (n)

                                                  +1%                                                               -19%                      -11%
                                   42.8                          43.3
                                                                                                             513                    4.4                    3.9
                                                                                                                             415
                                   20181                        2019E
Energy
                                  9.54%                        9.45%
losses
                                                                                                             2018           2019E   2018                 2019E
1.                     Proforma values.
2.                     System Average Interruption Duration Index (Hours of interruption per year/client).                                                       14
3.                     System Average Interruption Frequency Index (Times per year/client).
…while we also focus on a customers-base model to
Sustainability=Value

                            seize opportunities during an energy transition
                            scenario…
                                            Customers – Retail market                       Customers - New solutions

                            Energy sold (TWh)1
                                                                                                       2016          2019E
                                                          +64%

                                                                                                         0              170
                                                                        18.9      Charging points

                                             11.5
                                                                                                       0 MW          25 MW
                                                                                   Demand Response
                                            2016                        2019E
                                                                                                       0 MW           2 MW
                       Customer (k)1         0.8                         1.6          Storage

      EBITDA (US$ mn)1                       35                          45     Established a leading position in new services and
                                                                                                  infrastructures

1.                     Free market.                                                                                                  15
…and all of this supported by innovation and the digitalization
 Sustainability=Value

                           of our processes that have transformed our organization

                                          2017-2019E                        Digitalization process
                                          Total CAPEX
                                                             < 2016                2019                    > 2021
                                                           Pre-Digital                               Platform operating
                                                                             Cloud migration
                                               0.3          strategy                                        model
                                              US$ bn

                                      2017-2019E
                                    Cumulative benefit1

                                                           Fragmented IT    >30% platforms             New business
                                               ~0.1          platforms        reduction2                 models
                                              US$ bn
                                                          No economies of   Efficiencies and           Digitalization of
                                                               scale            synergies            existing businesses
                                                                                                                          16
1.                      EBITDA and NWC.
2.                      Referred to “Market” platforms.
Our sustainable model makes possible to improve our 2019
Sustainability=Value

                       results vs the estimates announced in the 2017-19 Strategic
                       Plan for this year…
                                 Industrial growth                             Efficiencies                Shareholder return

                                  EBITDA (US$ bn)                        Cost savings (US$ mn)            Group net income (US$ bn)

                                                                                                                    +29%
                                                                                       +9%                                       1.7
                                        +12%
                                                                                               254          1.3
                                                      4.1                234
                                 3.7

                                  1
                          2019 (SP 2017-19)          2019E         2019 (SP12017-19)          2019E   2019 (SP12017-19)
                                                                                                                1               2019E

Large hydro                                                  Opex I&N                          59.2
                                5.8                   6.2                67.7
 capacity                                                    (US$/end
   (GW)                                                        user)
End users
                               15.1                   24.7
  (mn)

                                                                                                                                        17
1. Strategic Plan.
… and therefore to increase shareholder return since
     Sustainability=Value

                            2016 through sustainable value creation
                                                          EPS1 (US$/ADR)                                                             DPS2 (US$/ADR)

                                                                   +124%                                                                    +124%

                                                                                                                                                              0.55
                                                                                                1.10                                                0.42
                                                                              1.05
                                                                                                                                   0.31
                                                                                                                           0.25
                                                           0.62
                                         0.49
                                         2016              2017              2018             2019E                        2016    2017         2018          2019E
                                                                                                                Dividend
                                                                                                                 policy    50%     50%          40%           50%

                                                           Dividend yield3                                                          Dividends4 (US$ bn)

                                                                                              5.7%                                          +197%
                                                                           4.3%                                                                                       0.84
                                                         3.2%
                                      2.5%                                                                                                             0.48
                                                                                                                            0.28     0.35

                                      2016               2017              2018              2019E                         2016      2017             2018           2019E
1.                   Earning per ADR. Calculated as Group Net Income / Total ADRs (1 ADR = 50 common shares).
2.                   Dividend per ADR.
3.                   ADR as of November 29, 2019: US$ 9.67. Dividend yield = DPS/ Share price.                                                                               18
4.                   Accrued dividends.
Our vision for the future

                            Our integrated business model is well positioned to
                            support the energy transition and macro trends…

                                  Enabling Infrastructure

                                                                           Electrification
                                                                           Free and regulated market
                                                            Networks

                                                                       Ecosystems & Platforms
                                                                                    Enel X

                                                                                                       20
Enabling Infrastructure

                                  …where networks are the backbone of a sustainable
 Our vision for the future

                                  electric system…
                                                                                                800

                                                         Energy system evolution                Global average yearly investments in networks (US$ bn)1
                                                                                                700

                             Traditional system                   New system
                                                                                                600

                                                                                                500

                                                                                                400
                                                                                                                            +85%          500
                                                                                                300

                                                                                                200

                                                                                                                  270
                                    TSO
                                                                                   Aggregator
                                                                                                100

                                                                                                  0

                                                                          DSO
                                                                                                                2010-18
                                                                                                                2010-2018              2019-40
                                                                                                                                      2019-2040
                                    DSO                        TSO

                                                                                                           Global average yearly investments in smart meters
                                                                                                      80
                                                                                                                         and grids (US$ bn)2
                                                             Microgrids                               70

                                                                                                                             ~2x
                                                                                                      60

                                                                                                                                          60
                                                                                                      50

                                                                                                      40

                                     DSO role stands out as pivotal in the transition:                30

                                                                                                                    33
                                  a key enabler for a unique value creation opportunity
                                                                                                      20

                                                                                                      10

                                                                                                       0

                                                                                                                    2018                 2040
Note: TSO:Transmission System Operator ; DSO: Distribution System Operator
1. Source: World Energy Investment and WEO.                                                                                                                    21
2. Internal elaborations on WEO data.
Enabling Infrastructure
 Our vision for the future

                             …centered on resiliency, quality and efficiency…

                                             Digitalization                       SAIFI (times)                 SAIDI (hours)

                             Remote control points (#) yearly

                                                   +15%1                              -11%                           -23%

                                                              3,328
                                                                1,323      6.2
                                                              1,323                               5.5    13.7

                                    2,209                                                                                       10.5

                                 113

                                    2019E                     2022        2019E                   2022   2019E                  2022

1. CAGR.
2. System Average Interruption Frequency Index (Times per year/client).                                                                22
Decarbonizzazione
                            Enabling Infrastructure

                            …and capturing an important level of investment to
Our vision for the future

                            increase quality and to support the energy transition…

                              Networks CAPEX by country                             Networks CAPEX by category   Networks CAPEX growth old plan vs
                                      2020-2022                                         2020-2022 (US$ bn)               new plan (US$ bn)

                                                                                                                                 +2%

                                              6% 8%                             Asset management1         1.8

                                    14%                                                                                                  4.4
                                                                                Customers2                1.4           4.3
                                         US$ 4.4 bn
                                                                                Asset development3        1.2

                                                      71%
                                                                                Total CAPEX               4.4
                                                                                                                     2019-2021         2020-2022

1. CAPEX related to investments for recurring asset maintenance.
                                                                                                                                                   23
2. CAPEX related to customers (Retail, Enel X (e-Home, e-Industries), Network connections).
3. Growth investments in generation and networks (quality programs & smart metering).
Electrification

                            …while generation business, driven by large hydro,
Our vision for the future

                            offers stability to the system with attractive profitability
                            to our shareholders…
                               Installed capacity (GW)          Production (TWh)            EBITDA (US$ bn)

                                                  -                   -1%                       +8%

                              11.3                    11.3   40.9              40.4                       1.6
                                                                                      1.5

                              2019E                   2022   2019E             2022   2019E              2022

                                                                                                                24
Electrification
                                                                                                                                                                 Electrificación

                            …and opportunities for growth in free market business
Our vision for the future

                            in all countries…
                                                                                                 Energy sales free market
                                                   Argentina                                             (TWh)                                  Colombia

                               Volume (TWh)                           Customers (th)
                                                                                                                              Volume (TWh)                 Customers (th)
                                                                                                             +34%
                                             0.8                              0.2
                                                                                                                                          6.6                              0.8

                                                                                                                    25
                                                                 -                                                                                        0.7
                             0.1                                                                                             5.9

                            2019E           2022               2019E         2022                     19
                                                                                                                            2019E        2022            2019E           2022

                                                     Brazil                                                                                       Peru

                                   Volume (TWh)                 Customers (th)                                                     Volume (TWh)                 Customers (th)

                                                                                                     2019E          2022                                   0.5
                                                                                                                              7.3
                                                                              0.6                                                           6.1
                                              11.8
                                                                                                                                                                            0.4
                                                               0.4
                                                                                       Market
                              5.6                                                      Share
                                                                                                     9%              9%

                                                                                       # Customers
                             2019E           2022             2019E          2022      (th)
                                                                                                     1.6             2.1     2019E         2022           2019E            2022
                                                                                                                                                                            25
Electrification

                               …in the meantime, energy transition offers new
 Our vision for the future

                               opportunities and challenges for the Company…
                                                                         Urbanization as a key element
                                                            1950                     2010                       2017                        2030

                             Latin America is the most urbanized
                                                                         Emerging     markets     have             New “Smart Business” opportunities
                                     region in the world ¹
                                                                         increased   energy    demand
                                                        Latam & Caribe   compared to mature markets.
                                                                                                                Cities                    Windows
                                                                         Smart cities put together              Technology                Cloud computing
                                                             Asia        infrastructure and technology in       Infrastructure            Materials
                                                             Africa      order to improve people’s
                                                                         quality of life.
                                                                                                                Energy                    Factories
                                                                                                                Mobility                  Meters
                                                                                                                Buildings

                                             year

                                                                                                                                                        26
1. Source: CAF - Banco de desarrollo de América Latina.
Ecosystems & Platforms
                                                                                                                                                           Electrificación

                            …where Enel X will play a key role by accelerating the transition
Our vision for the future

                            through ecosystems creation: more efficient and innovative use of
                            energy…
                            Product lines                                                              Vision

                                    e-City            Supports electrification of cities and energy efficiency through digitalization and innovative services.

                                   e-Industries      Allows commercial and industrial clients to reduce costs through sustainable and innovative solutions.

                                   e-Mobility                 Promotes the transition to electric mobility in both public and private transportation.

                                    e-Home              Facilitates home services management, building a sustainable ecosystem available to anyone.

                                    Financial
                                                       Provides digital instant payment services with social impact to residential and commercial clients.
                                    Services
                                                                                                                                                                      27
Ecosystems & Platforms

                                  …enabling a decarbonized electrification of
Our vision for the future

                                  consumption
                                                 Decarbonization through new services                          Enabling electrification

                                     Demand response (MW)                  Storage (MW)1       Charging points2 (n)              Public lighting (points k#)

                                                 6.4x                           3.0x                   15x                                 1.8x

                            180                                     7
                                                                                                                           800

                                                                                                               2,571
                            160

                                                                                                                           700
                                                                    6

                            140

                            120
                                                           159      5

                                                                                         6                                 600
                                                                                                                                                    732
                                                                                                                           500

                                                                    4
                            100

                                                                                                                           400

                             80
                                                                    3

                             60

                                                                    2
                                                                                                                           300

                                                                                                                                   412
                                                                                                                           200
                             40

                             20

                                         25
                                                                    1

                                                                          2                     170                        100

                              -                                     -
                                                                                                                             -

                                      2019E                2022         2019E           2022   2019E           2022               2019E             2022

                                                                                                                                                               28
1. Including BESS.
2. Public and private charging points.
Our vision for the future

                            Our vision is captured by a fully sustainable CAPEX
                            plan with a direct impact on SDGs…
                               Total gross CAPEX by business 2020-22                               Total gross CAPEX by category 2020-22

                                                   3% 4% 4%

                                                                  8%
                                                                                                            30%

                                                                                                                                   43%
                                                   US$ 5.3 bn                                                       US$ 5.3 bn

                                                      82%                                                           27%

                                Large hydro gen.   Thermal gen.    Networks   Retail   Enel X    Asset Management     Asset Development   Customers

                                                                                                ~ 92% of CAPEX SDGs related
                                                                                                                                                      29
…and a sustainable shareholder return strategy
Our vision for the future

                                                                     EPS1                                                                Shareholder return – DPS2 (US$)

                                                                    +24%                                                                                +24%

                                                                                                                    CAGR                                               0.65
                                                                                      1.37                         2019-22                                     0.56        0.68
                                                                                                                                               0.50
                                                                                                                                                                0.60
                                                    1.10                                                               + 7.0%     0.55
                                                                                                                                                 0.54

                                                  2019E                               2022                                        2019E         2020            2021       2022
                                                                                                                       Dividend
                                                                                                                                  50%           50%             50%        50%
                                                                                                                        policy

                                                                                                                                                                                  30
1.                          Earning per ADR. Calculated as Group Net Income / Total ADRs (1 ADR = 50 common shares).
2.                          Dividend per ADR.
Investor Day
Strategic Plan 2020-22

Aurelio Bustilho
CFO
2020-2022
Strategic Plan
5.3
2020-22 Strategic Plan

                         Strategic plan at a glance

                                          EBITDA (US$ bn)                     Net income (US$ bn)

                                                +32%                                  +24%

                                                                                             2.1
                                                         5.5
                                                                               1.7
                                        4.1                            +1.4                          +0.4

                                      2019E             2022                  2019E          2022

                         Cumulative organic CAPEX vs previous plan (US$ bn)    Net debt (US$ bn)

                                                                                       -8%
                                                -%
                                                                                4.3            4.0
                                       5.3               5.3

                                                                                                     -0.3

                                      2019-21          2020-22
                                                                              2019E           2022          33
2020-22 Strategic Plan

                             Focus on profitability, value creation and financial
                             capacity

                                   Group net income/EBITDA            Return on invested capital (ROIC)                  FFO/Net debt

                                                                                                                            +41 p.p.
                                             -3 p.p.                                 +4 p.p.
                                                                                                                                                  +20 p.p.

                                                              38%                                 14.3%                         +21 p.p.
                                              36%                                                  14%                                                       94%
                          41%35%                                                       11.2%                   +1 p.p.
                                                                                                             141%
                                                               38%                      11%                                                75%
                                                       36%             10%
                                       35%                                                10.8%
                                                                                                          53%             54%                           93%

                                                                       3.4%                                                       53%

                              1
                          2019E       2020             2021    2022    2016            2019E      2022    2019E          2020              2021              2022
                                                                              ROIC         WACC

                                                                                                                                                              34

1. 2019E includes one off by US$ 0.5 bn
2020-2022
Our vision in numbers

                         Sound EBITDA despite Fx impact with Networks
                         leading growth
                          Cumulative EBITDA (US$ bn)                            EBITDA evolution 2019-22 (US$ bn)

                                                                                                +32%
                                     -
                                                                                                               0.2     0.1
                                                                          1.0             0.1
                                                                                                                                      5.5
                         15.2                 15.2

                                                           4.1

                                                       EBITDA 2019E     Networks       Generation          Retail     Enel X1      EBITDA 2022
                         2019-21             2020-22
                                                                         Enabling            Electrification         Ecosystem &
                                                                      infrastructure                                  Platforms

                                                                                                                                            36

1. Lower cost at Holding level.
Our vision in numbers

                          Organic CAPEX up by 9% to pursue strategic vision
                          with Brazil leading the way
                                                  Organic CAPEX by business (US$ bn)                                     Cumulative organic CAPEX by country 2020-22

                                                                           +9%

                                    1.68                  1.79 3%                  1.74 3%             1.82 2%
                                          2%                          4%                   3%                 4%
                                          4%               12%                      11%                13%                                 8%    11%
                                      15%

                                                                                                                                  18%
                                      10%                                           83%
                                      78%                  81%                                         81%
                                                                                                                                         US$ 5.3 bn

                                      78%                  81%                       83%                 81%
                                     2019E                2020                     2021                2022
                                                     Networks     Generation      Enel X      Retail                                             62%
                        Enabling infrastructure                             Electrification

                        Networks                                4.4            Generation                          0.6
                        Ecosystems & Platforms

                        Enel X                                  0.2              Retail                            0.1
                                                                                                                          Argentina     Brazil   Colombia    Peru
                                                                                                                                                                    37
                                     Total CAPEX 2020-22 (US$ bn)                   5.3
Our vision in numbers

                          Further efforts will reduce OPEX by approximately US$
                          0.3 bn along the period with Networks capturing ~70% of
                          the total
                                                 OPEX evolution (US$ bn)

                                                            +5%

                                               0.4                         (0.3)

                              1.8                                                   1.9

                                                        1
                             2019E           Fx & CPI                Efficiencies   2022

                                                                                           38

1. Currency and OPEX inflation.
Our vision in numbers

                         Generation: Long-term PPAs will continue to ensure
                         profitability

                                       EBITDA evolution (US$ bn)                                   Contracted energy (TWh)
                                                                                        Brazil                                              Colombia
                                                                                                                             65%
                                               8%                           15.6
                                                                          85%
                                                                              >                                              15.2
                                                                                                 12.1          11.2                        13.7
                                                                            100%    10.4                                                          11.9        10.8
                                                                                                                             97%           88%
                                                                                     93%         94%           67%                                76%
                                                           0.26                                                                                               71%
                                  (0.10)                           1.6
                                              (0.04)
                                                                           2019     2020         2021          2022          2019          2020   2021        2022
                         1.5                                               PPA1 average duration: 15-30 years2               PPA1 average duration: 1-3 years

                                                                                                               Peru
                                                                                       10.4             10.0          9.3
                                                                                                                                    8.4
                                                                                        86%
                                                                                                        84%           76%
                                                                                                                                    69%

                         2019E   Fx & CPI 3   OPEX        Volume   2022

                                                                                       2019             2020          2021          2022
                                                                                                                                                         39
1. Power Purchase Agreement.                                                               PPA1 average duration: 5-7 years
2. Volta Grande’s PPA duration: 30 years.
3. Currency and OPEX inflation.
Our vision in numbers

                               Networks: limited risk due to the completion of most
                               tariff reviews in our distribution companies

                                          EBITDA evolution (US$ bn)                                            RAB2 (US$ bn)                                       Tariff reviews3

                                                       42%                                                            17%
                                                                0.3      (0.1)                                                     14.3
                                                       0.9                                             12.2                          2.0
                                                                                   3.4
                                                                                                         1.8                                                             Argentina
                                  (0.4)                                                                                              3.4
                                              0.3
                         2.4                                                                             3.2
                                                                                                                                     2.7                                                    Brazil
                                                                                                         2.3
                                                                                                                                     1.8
                                                                                                         1.6                         1.2                                    Peru
                                                                                                         0.8                         1.4
                                                                                                         1.1
                                                                                                         1.3                         1.8              2020       2021       2022      2023
                         2019E   Fx & CPI
                                          1
                                              OPEX   Tariff/RAB Demand   Others   2022                 2019E                        2022
                                                                                                  Edesur                       Enel Dx Ceará          Limited tariff reviews during the period
                                                                                                  Enel Dx Goiás                Enel Dx Río
                                                                                                  Enel Dx São Paulo            Enel Codensa
                                                                                                  Enel Dx Perú
                                                                                                                                                                                       40
1. Currency and OPEX inflation.                                               Avg. WACC                12.6%                        12.1%
2. Regulatory Asset Base according to each country’s reegulation.
3. In Colombia tariff review completed but it is expected to take in place on 1Q 2020. In addition, the tariff review is retroactive to April 2019.
Our vision in numbers

                            Significant growth in Retail business,
                            Expansion in Enel X business with a light CAPEX plan

                                               EBITDA evolution (US$ mn)                                        EBITDA evolution (US$ mn)

                                                                   142%                                                         147%

                                                                           214      458                                                              6
                                                                                    58                                                    18
                                                                                                                                  37                       95
                                            323         (79)
                                            45
                                                                                                                  (6)       2
                                                                                   400
                            Free Market     278                                                           38
                            Reg. Market
                                                                                                                        1
                                            2019E     Fx & CPI 1          Growth   2022                  2019E Fx & CPI Argentina Brazil Colombia   Peru   2022

                         Customers Free                                                   CAPEX           61
                                             1.6                                   2.1    (US$ mn)
                                                                                                                                                           65
                         market (k)
                         Delivery points
                         (k)
                                             2.9                                   3.4    EBITDA-CAPEX
                                                                                                          -23                                              +30
                                                                                          (US$ mn)
                         Customers
                         Reg. market (mn)
                                             24.7                                  26.0                                                                    41

1. Currency and OPEX inflation
2020-2022
Financial Management
5.0
Financial management

                         Debt evolution reflecting capital allocation dynamics

                               Net debt evolution (US$ bn)                Source of funds allocations 2020-22 (US$ bn)                                    Leverage capacity (US$ bn)

                                            -8%                                                                                                    1.0x         1.1x            0.9x              0.7x

                                            -11%
                                                                                10.0             (5.3)                                                                                        5.5
                                                                                                                                                                    5.2        5.0
                                                          -14%                10.0             (1.2)
                                                                                                                                                              4.7                    4.6
                                                                                                                (5.3)                                   4.3
                                     5.2                                                                                                          4.1
                                                                                                                                                                                                    4.0
                       4.3                         4.6
                                                                 4.0                                                     2
                                                                                                                  (3.5)

                                                                                                                   2.5             (3.5)

                                                                                                                   1.0                1.2

                       2019E         2020          2021          2022           FFO1        Gross
                                                                                             GrossCAPEX
                                                                                                   capex        Dividends             FCF 3       2019E        2020             2021              2022
                                                                                                                                                    EBITDA          Net debt         Net debt/EBITDAx
                                                                                                                                                                                             43
1. Funds From Operations.
2. Including US$2.5 bn paid to shareholders of Enel Américas and US$1.0 bn dividends distributed from subsidiaries to minorities
3. Free Cash Flow.
Financial management

                               Financial targets and credit profile
                               Net debt evolution 2019-22

                                  Net debt breakdown (US$ bn)              Net financial expenses on debt (US$ bn)                                   Credit profile

                                                                                                                                                            Rating    Outlook
                                             - 8%                    0.6                                                          8.0%
                                                                              6.9%                                   6.8%
                                                                                                        6.4%                      7.0%
                                                                     0.5                  5.8%                                             Moody’s         Baa3       Stable
                                      5.2                                     0.5                                                 6.0%

                         4.3           0.9
                                                     4.6             0.4
                                                                                                                                  5.0%
                         0.2                          1.0
                                                              4.0
                                                                                          0.3          0.3
                                                              1.0    0.3                                              0.3         4.0%       S&P            BBB       Stable
                                                                                                                                  3.0%
                                                                     0.2
                         4.1           4.3
                                                     3.6                                                                          2.0%
                                                              3.0    0.1
                                                                                                                                  1.0%   Fitch Ratings       A-       Stable

                                                                     0.0                                                          0.0%

                        2019E         2020          2021      2022          2019E        2020          2021         2022
                                     Countries      Holding                   Net financial expenses         Cost of gross debt          Feller Rate1      Baa3       Stable

                                                                                                                                                                      44

1. National rating.
De-risking our business

                          2020-22 EBITDA centers on sustainable businesses
                          and benefitting from an improved risk profile

                           2020-22 Cumulative EBITDA               2020-22 Cumulative net income (US$ bn)                 Limited risk profile

                                                                                                            Sustainable strategy

                                12% 10%                                       13%     17%
                                                                                                            No tariff revision processes in Dx business
                                                                                                            until 2022
                                                                        18%
                           28% US$ 15.2 bn                                    US$ 4.9 bn                    Long-term PPAs in Gx business with a light
                                                                                                            CAPEX plan
                                             49%
                                                                                    53%                     Solid and flexible financial situation, with
                                                                                                            ample room to increase leverage

                                                                                                            Low cost of debt
                                                       Argentina     Brazil
                                                       Colombia      Peru                                   Efficiencies for US$ 0.3 bn

                                                                                                                                                      46
De-risking our business

                              Solid stock price performance since 2016                                                                                                                                                                                                                                                                                                                                                                                   7) ESM1 approves
                                                                                                                                                                                                                                                                                                                                                                                                                                                        capital increase (US$
                                                                                                                                                                                                                                                                                                                                                                                                                                                                  3.0)
                                                                                                                                       3) Enel Dx Goiás
                          70.0%                                                                                                           acquisition
                                                                                                                                                                                                                         4) Volta Grande                                                                                                                                                                                              6) Capital increase                                                                  8) Capital
                          60.0%                                                                                                                                                                                                                                                                                                                      5) Enel Dx Sao
                                                                                                                                                                                                                            acquisition                                                                                                                  Paulo
                                                                                                                                                                                                                                                                                                                                                                                                                                        announcement                                                                       increase                                                    58.8%
                                                                                                                                                                                                                                                                                                                                                                                                                                          US$ 3.5 bn                                                                      completion
                          50.0%                                                                              2) Enel Dx Goiás                                                                                                                                                                                                                          acquisition
                                           1) Enel Américas
                                           initiates as single                                              offer announcement
                          40.0%
                                                  entity                                                                                                                                                                                                                                                                                                                                                                                                                                                                                                                                  +45 p.p.
                          30.0%

                          20.0%

                          10.0%
                                                                                                                                                                                                                                                                                                                                                                                                                                                                                                                                                                                       13.9%
                                                                                                                                                                                                                                                                                                                                                                                                                                                                                                                                  9) Social riots in Chile
                           0.0%
                                                                        21-Jul-16

                                                                                                                                                                                                                          21-Jul-17

                                                                                                                                                                                                                                                                                                                                                                          21-Jul-18

                                                                                                                                                                                                                                                                                                                                                                                                                                                                                                                           21-Jul-19
                                               21-May-16

                                                                                                                                                                                                 21-May-17

                                                                                                                                                                                                                                                                                                                                                  21-May-18

                                                                                                                                                                                                                                                                                                                                                                                                                                                                                                  21-May-19
                                                                                                                                                             21-Feb-17
                                                                                                                                                                         21-Mar-17

                                                                                                                                                                                                                                                                                                                          21-Mar-18

                                                                                                                                                                                                                                                                                                                                                                                                                                                              21-Feb-19
                                                                                                                                                                                                                                                                                                                                                                                                                                                                          21-Mar-19
                                   21-Apr-16

                                                                                                                                                                                     21-Apr-17

                                                                                                                                                                                                                                                                                                              21-Feb-18

                                                                                                                                                                                                                                                                                                                                      21-Apr-18

                                                                                                                                                                                                                                                                                                                                                                                                                                                                                      21-Apr-19
                                                                                                             21-Oct-16

                                                                                                                                                                                                                                                              21-Oct-17

                                                                                                                                                                                                                                                                                                                                                                                                              21-Oct-18

                                                                                                                                                                                                                                                                                                                                                                                                                                                                                                                                                               21-Oct-19
                                                                                                                         21-Nov-16

                                                                                                                                                                                                                                                                          21-Nov-17
                                                                                                                                                                                                                                                                                      21-Dec-17

                                                                                                                                                                                                                                                                                                                                                                                                                          21-Nov-18

                                                                                                                                                                                                                                                                                                                                                                                                                                                                                                                                                                           21-Nov-19
                                                           21-Jun-16

                                                                                    21-Aug-16
                                                                                                21-Sep-16

                                                                                                                                     21-Dec-16
                                                                                                                                                 21-Jan-17

                                                                                                                                                                                                             21-Jun-17

                                                                                                                                                                                                                                      21-Aug-17

                                                                                                                                                                                                                                                                                                                                                                                                  21-Sep-18

                                                                                                                                                                                                                                                                                                                                                                                                                                      21-Dec-18
                                                                                                                                                                                                                                                  21-Sep-17

                                                                                                                                                                                                                                                                                                  21-Jan-18

                                                                                                                                                                                                                                                                                                                                                              21-Jun-18

                                                                                                                                                                                                                                                                                                                                                                                      21-Aug-18

                                                                                                                                                                                                                                                                                                                                                                                                                                                  21-Jan-19

                                                                                                                                                                                                                                                                                                                                                                                                                                                                                                              21-Jun-19

                                                                                                                                                                                                                                                                                                                                                                                                                                                                                                                                       21-Aug-19
                                                                                                                                                                                                                                                                                                                                                                                                                                                                                                                                                   21-Sep-19
                          -10.0%

                                                                                                                                                                                                                                                          Enel Américas                                                       SP IPSA

                                   Daily average traded

                                                                                                                                                                                         Santiago Stock Exchange                                                                                                                                  New York Stock Exchange

                                                                   2019                                                                                                                                      US$ 17.8 mn                                                                                                                                       US$ 11.4 mn

                                                                                                                                                                                                                                                              +247%                                                                                                                                           +67%
                                                                       2016
                                                                                                                                                                                                              US$ 5.1 mn                                                                                                                                          US$ 6.9 mn                                                                                                                                                                                                              47
Since April 21, 2016 to November 29, 2019.
Source: Bloomberg.
2020-2022
Earnings & Targets
Earnings and targets

                               Strategy driving 24% increase in earnings

                                 Group net income (US$ bn)                    2019E-22 Group net income evolution (US$ bn)

                                           +24%                                                  +24%

                                                                                                   0.3        (0.9)
                                                                              1.3       (0.2)
                                                             2.1

                                                   1.8
                                     1.6                                                                                 (0.1)
                         1.7
                                                                                                                                  2.1

                                                                     1.7

                        2019E       2020          2021       2022   2019E   EBITDA     D&A1     Financial    Taxes     Minority   2022
                                                                                                charges                interest

                                                                                                                                         49

1. Depreciation & Amortization.
Earnings and targets

                       Visible value creation for our shareholders

                                                                                  CAGR
                           Earnings growth          2019E   2020   2021   2022
                                                                                 2019E-22

                            EBITDA (US$ bn)          4.1    4.7    5.0    5.5     +9.7%

                        Total net income (US$ bn)    2.3    2.2    2.4    2.7     +6.5%

                       Group net income (US$ bn)     1.7    1.6    1.8    2.1     +7.3%

                             Value creation

                              Pay-out ratio         50%     50%    50%    50%       -

                          Dividends1 (US$ bn)       0.84    0.82   0.91   1.04    +7.3%

                            DPS2 (US$/ADR)          0.55    0.54   0.60   0.68    +7.3%
1. Accrued dividend.                                                                        50
2. Dividend per ADR (1 ADR = 50 common shares).
Closing remarks
Closing remarks

                  Closing remarks

                      1   Sustainable and diversified business model to generate shareholder return

                      2         Networks as enabler of our strategic pillars through digitalization

                      3    Well positioned to lead energy transition and to capture new opportunities

                      4   Solid balance sheet with limited risks and ample financial capacity for growth

                      5               Sustainable value creation for all our stakeholders

                                                                                                           52
Annexes
Annexes

           Macro scenario

              GDP, CPI, Fx

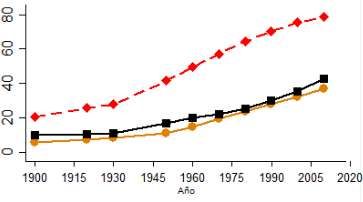
                                                         GDP1 (%)                                    CPI2 (%)                  Fx vs USD3

                                          2020              2021             2022             2020    2021      2022   2020        2021     2022

           Argentina                      (1.3)              1.4              1.8             48.6    34.8      22.9   65.0        78.0     93.3

           Brazil                          2.6               2.6              2.5             4.1      3.9      3.7     3.6         3.7      3.7

           Colombia                        3.2               3.2              3.3             3.0      3.0      3.0    3,140       3,155    3,187

           Peru                            3.8               3.9              3.9             2.3      2.5      2.5     3.3         3.2      3.2

1. Gross Domestic Product.                                                                                                                          54
2. Consumer Price Index.
3. Average Fx, except Argentina, due to hyperinflation we use the closing Fx of the period.
Annexes

              EBITDA by business

            Generation & Distribution

           Retail, Enel X & Total

                                        55
1: Total EBITDA includes Holding
Annexes

          Generation KPIs
          Net installed capacity

                       45%
                              11.3 GW                11.3 GW
                                        55%   45%              55%

                                                                     Large Hydro
                              2019E
                                                      2022           Thermal
          Net production

                        39%                    38%
                              41 TWh                  40 TWh
                                        61%                    62%

                                                                               56

                              2019E                   2022
Annexes

            Distribution KPIs

                  Electricity distributed, End users, Network km

                                         Electricity distributed (TWh)                   End users (mn)                      Network km (Th)
                                 2019E        2020         2021          2022    2019E    2020       2021    2022   2019E   2020       2021    2022
          Edesur                  16.3         16.5        17.4          17.8     2.5      2.5        2.5    2.6    27.4    27.5       27.6    27.8
          Enel Dx Río             11.3         11.7        12.0          12.4     2.9      2.9        2.9    2.9    60.7    61.5       62.3    63.2
          Enel Dx Ceará           12.2         12.6        13.0          13.4     3.9      3.9        4.0    4.0    152.0   154.0     155.8    157.6
          Enel Dx Goiás           14.1         14.6        15.1          15.6     3.1      3.1        3.2    3.2    222.4   224.7     228.3    231.4
          Enel Dx Sao Paulo       43.3         44.4        45.1          46.1     7.3      7.4        7.6    7.8    45.7    45.9       46.2    46.4
          Enel Codensa            14.2         14.5        14.7          14.9     3.5      3.7        3.8    3.9    71.6    71.7       71.9    72.0
          Enel Dx Perú            8.3          8.5          8.7           9.0     1.5      1.5        1.5    1.5    29.7    30.1       30.5    30.9
          Total                  119.8        122.7       126.0          129.2   24.7     25.0        25.5   26.0   609.4   615.4     622.6    629.4

                                                                                                                                                   57
Annexes

              Regulatory tariff review of our Distribution
              Companies
                                                                                                                                              Enel Codensa
                                                                                                                                              Clients: 3.5 mn

             Company                    WACC                   Regulatory cycle                 Next tariff review
                                                                                                                                                                 Enel Dx Ceará
                                                                                                                                                                 Clients: 3.9 mn

              Edesur                    12.5%                         5 years                           2022

           Enel Dx Ceará                12.3%                         4 years                           2023

           Enel Dx Goiás                12.3%                         5 years                           2023                                                                 Enel Dx Goiás
                                                                                                                                                                             Clients: 3.1 mn

            Enel Dx Rio                 12.3%                         5 years                           2023
                                                                                                                                                                              Enel Dx Rio
                                                                                                                                   Enel Dx Perú                              Clients: 2.9 mn
           Enel Dx São                                                                                                             Clients: 1.5 mn
                                        12.3%                       4 - 5 years                         2023
              Paulo

                                                                                                                                                                Enel Dx Sao Paulo
           Enel Codensa                13.7%1                         5 years                          20192                                                     Clients: 7.3 mm

           Enel Dx Perú                 12.0%                         4 years                           2022                                                        Edesur
                                                                                                                                                                Clients: 2.5 mn

                                                                                                                                                                                   58
1. On the next tariff revision the WACC will be 11.8%.
2. Tariff revision completed but expected to take place in 1Q 2020. In addition, the tariff review is retroactive to April 2019.
Perimeter of Enel Américas’ Corporate Shareholdings
 Annexes

                                                              Enel Américas S.A.

                    Argentina                             Brazil                          Colombia                           Peru

           Generation         Distribution   Generation            Distribution   Generation     Distribution   Generation          Distribution
                 75.62% 72.09%                                                         48.48%        48.30%          83.60%         83.15%
                                                  99.75%      99.93%
            Enel Gx                          Cachoeira            Enel Dx           Enel              Enel       Enel Gx              Enel Dx
                            Edesur
           Costanera                          Dourada              Goiás           Emgesa            Codensa      Perú                 Perú
                65.69%                              100%      99.73%                                                  96.50%
            Enel Gx                           Enel Gx             Enel Dx                                        Enel Gx
           El Chocon                         Fortaleza              Río                                           Piura
                40.25%                              100%      74.05%
            Enel Gx                            Volta              Enel Dx
           El Chocon                          Grande               Ceará
                                                               100%1
                                                                  Enel Dx                                                                       59
                                                                Sao Paulo
1. Once completed the squeeze out process
Annexes

             Concessions
                                                                                                       Year concession      Concession   Period remaining
                        Company                     Country                  Business
                                                                                                            started            term        to expiration
                 Edesur                              Argentina                Distribution                        1992        95 years        69 years

                 Enel Gx El Chocón                   Argentina                Generation                          1993        30 years        5 years

                 Enel Dx Goiás                         Brazil                 Distribution                        2015        30 years        26 years

                 Enel Dx Río                           Brazil                 Distribution                        1996        30 years        8 years

                 Enel Dx Ceará                         Brazil                 Distribution                        1997        30 years        9 years

                 Enel Dx São Paulo                     Brazil                 Distribution                        1998        30 years        10 years

                 Enel Gx Fortaleza                     Brazil                 Generation                          2001        30 years        13 years

                 Cachoeira Dourada                     Brazil                 Generation                          1997        30 years        9 years

                 Volta Grande                          Brazil                 Generation                          2017        30 years        28 years

                 Enel Cien Line I                      Brazil                Transmission                         2000        20 years         1 year

                 Enel Cien Line II                     Brazil                Transmission                         2002        20 years        3 years

                                                                                                                                                            60

      Note: Companies that have not been mentioned here have indefinite concessions or do not correspond to a concession.
Annexes

             Engaging local Communities

                   Plan actions                                    2019E                           Plan actions                  2019E3

                                                                     100% of people involved       High-quality, inclusive and   0.5 mn
                   Performance appraisal1
                                                                     91% of people appraised
                                                                                                   fair education                beneficiaries

                                                                     100% of people involved                                     3.9 mn
                   Climate    survey1                                                              Access to affordable and
                                                                                                   clean energy                  beneficiaries
                                                                     92% of people participating

                                                                                                    Employment and
                   Gender - % of women in                           41% women involved in                                        0.5 mn
                                                                                                    sustainable and inclusive
                   selection processes2                             recruiting processes                                         beneficiaries
                                                                                                    economic growth

                   Promotion of digital skills’
                                                                    42% of people involved in
                   dissemination among all                          digital skills training
                   employees

                                                                                                                                                 61
1. Eligible and reachable people having worked in the Group for at least 3 months
2. It excludes the seclection processes involving the blue collars
3. Cumulated figures since 2015.
Annexes

          Board composition

                                  Board of Directors                                                         Board of Directors’ diversity

           Francisco de Borja Acha Besga               Attorney at Law
           Chairman                                    Universidad Complutense
                                                       de Madrid

                                                       Industrial civil engineer   Dependence                       43%        Non executive
           Domingo Cruzat Amunátegui
           Independent director                        Universidad de Chile                      57%                           Board members

                                                                                                                                                       100%
           Hernán Somerville Senn                      Lawyer
           Independent director                        Universidad de Chile
                                                                                                 Independent       Dependent                     Non executive director

           Patricio Gómez Sabaini                      Business Administration
           Independent director                        Degree George Mason
                                                       University, Virginia                                                                       14%
                                                                                                   29%             29%
           José Antonio Vargas Lleras                  Attorney at Law
                                                                                                                                               14%
           Director                                    Universidad Colegio
                                                                                   Nationality                                    Seniority
                                                       Mayor del Rosario
                                                                                                   14%             14%                                        71%
           Enrico Viale                                Engineer Degree                                       14%
           Director                                    Universidad Politécnica
                                                       de Turín                                                                                Less than 4 years
                                                                                                   Italian           Chilean
            Livio Gallo                                Electronic Engineer                                                                     Between 4 an 7 years
                                                                                                   Spanish           Argentine
            Director                                   Universidad Politécnica
                                                                                                                                               More than 12 years
                                                                                                                                                               62
                                                       de Milán                                    Colombian
Disclaimer
This presentation does not constitute an offer to sell any securities and is not soliciting an offer to buy any securities in any jurisdiction.

This presentation contains certain “forward-looking statements” regarding anticipated financial and operating results and statistics and other future events relating to Enel Américas S.A.
These statements are not guarantees of future performance and are subject to material risks, uncertainties, changes and other factors which may be beyond Enel Américas’ control or may
be difficult to predict. These statements may constitute forward-looking statements within the meaning of the United States Private Securities Litigation Reform Act of 1995. The inclusion
of these forward-looking statements should not be regarded as an indication that Enel Américas or any other person considers such projections to be material or to be a reliable prediction
of actual future results. These forward-looking statements are subjective in many respects and there can be no assurance that they will be realized or that actual results will not be
significantly higher or lower than described. As a result, the inclusion of any forward-looking statements in this presentation should not be relied on as necessarily predictive of actual future
events. The projections and other forward-looking statements were based on numerous variables and assumptions that are inherently uncertain. Actual results may differ materially from
those projected as a result of such risks and uncertainties. In addition, the financial projections do not necessarily reflect revised prospects, changes in general business or economic
conditions, or any other transaction or event that has occurred or that may occur and that was not anticipated at the time the projections were prepared.

Forward looking statements include, but are not limited to, information regarding: Enel Américas' business plans, Enel Américas' cost reduction plans, trends affecting Enel Américas'
financial condition or results of operations including market trends in the electricity sector in Chile or elsewhere, supervision and regulation of the electricity sector in Chile or elsewhere,
and the future effect of any changes in the laws and regulations applicable to Enel Américas' or its affiliates. The principal assumptions underlying these forecasts and targets relate to:
Economic and Industry Conditions, Commercial Factors, Political/Governmental Factors, Operating Factors, and Competitive Factors.

The following important factors, in addition to those discussed elsewhere in this presentation, could cause actual financial and operating results and statistics to differ materially from those
expressed in our forward-looking statements, including but not limited to: changes or developments regarding the applicable regulations (which may affect the investment plan of Enel
Américas regarding the regulated activities), legal restrictions applicable to the implementation of the dividends policy, environmental regulations and other legal issues; price of electricity;
price and supply of raw materials; interest rates or exchange rates; availability of fuel; ability to maintain relationship with suppliers, customers and consumer and user protection groups;
changes in climate conditions; widespread adoption energy efficiency measures; inherent risks in the construction of new power generation and distribution facilities; changes in general
economic, political, administrative and business conditions; operating hazards and risks; tax risks; loss of senior management and key personnel; insufficiency of insurance coverage or
increase of insurance costs; failure of systems and information technology and processing; inability to access the capital markets to refinance its debt and finance its capital expenditures;
and other factors that could adversely affect the business and financial results of the Company.

No assurance can be given that the forward-looking statements in this document will be realized. Readers are cautioned not to place undue reliance on those forward-looking statements,
which speak only as of the date of this presentation. Our independent registered public accounting firm has not audited, examined or compiled the forward-looking statements and,
accordingly, does not provide any assurance with respect to such statements. Neither Enel Américas nor any of its affiliates intends, nor undertakes any obligation, to update or revise the
forward-looking statements, whether as a result of new information, future events or otherwise, except as required by law.                                                      63
Strategic Plan 2020-22
Contact us
                                                                 Rafael De La Haza
                                                                 Head of Investor Relations Enel Américas

                                                                 Jorge Velis
                                                                 Investor Relations Manager Enel Américas

  Email                                                          Itziar Letzkus
  ir.enelamericas@enel.com                                       Investor Relations Enel Américas

                                                                 Javiera Rubio
  Channels                                                       Investor Relations Enel Américas
       Website                         Mobile App
       www.enelamericas.com            Enel Américas Investors   Gonzalo Juárez
                                                                 Investor Relations New York Office

                                                                 María Luz Muñoz
                                                                 Executive Assistant

              Enel Américas’ Investor Day event
                                                                                Thank you.
You can also read