H1 2020 -January-June Results presentation - 30th July 2020 - Acciona

Page created by Ruby Lowe
 
CONTINUE READING
H1 2020 -January-June Results presentation - 30th July 2020 - Acciona
H1 2020 – January-June
Results presentation

                         30 th July 2020
ACCIONA H1 2020 Results

2        Disclaimer

    This document has been prepared by ACCIONA, S.A. (“ACCIONA” or the “Company”) exclusively for use during the presentation of financial results. Therefore it cannot be disclosed or
    made public by any person or entity with an aim other than the one expressed above, without the prior written consent of the Company.
    The Company does not assume any liability for the content of this document if used for different purposes thereof.
    The information and any opinions or statements made in this document have not been verified by independent third parties, nor audited; therefore no express or implied warranty is
    made as to the impartiality, accuracy, completeness or correctness of the information or the opinions or statements expressed herein.
    Neither the Company, its subsidiaries or any entity within ACCIONA Group or subsidiaries, any of its advisors or representatives assume liability of any kind, whether for negligence or
    any other reason, for any damage or loss arising from any use of this document or its contents.
    The information contained in this document on the price at which securities issued by ACCIONA have been bought or sold, or on the performance of those securities, cannot be used to
    predict the future performance of securities issued by ACCIONA.
    Neither this document nor any part of it constitutes a contract, nor may it be used for incorporation into or construction of any contract or agreement.
    IMPORTANT INFORMATION
    This document does not constitute an offer or invitation to purchase or subscribe shares, in accordance with the provisions of the Spanish Securities Market Law (Law 24/1988, of July
    28, as amended and restated from time to time), Royal Decree-Law 5/2005, of March 11, and/or Royal Decree 1310/2005, of November 4, and its implementing regulations.
    In addition, this document does not constitute an offer of purchase, sale or exchange, nor a request for an offer of purchase, sale or exchange of securities, nor a request for any vote or
    approval in any other jurisdiction.
    Particularly, this document does not constitute an offer to purchase, sell or exchange or the solicitation of an offer to purchase, sell or exchange any securities.
    FORWARD-LOOKING STATEMENTS
    This document contains forward-looking information and statements about ACCIONA, including financial projections and estimates and their underlying assumptions, statements
    regarding plans, objectives and expectations with respect to future operations, capital expenditures, synergies, products and services, and statements regarding future performance.
    Forward-looking statements are statements that are not historical facts and are generally identified by the words “expects”, “anticipates”, “believes”, “intends”, “estimates” and similar
    expressions.
    Although ACCIONA believes that the expectations reflected in such forward-looking statements are reasonable, investors and holders of ACCIONA shares are cautioned that forward-
    looking information and statements are subject to various risks and uncertainties, many of which are difficult to predict and generally beyond the control of ACCIONA, that could cause
    actual results and developments to differ materially from those expressed in, or implied or projected by, the forward-looking information and statements. These risks and uncertainties
    include those discussed or identified in the documents sent by ACCIONA to the Comisión Nacional del Mercado de Valores, which are accessible to the public.
    Forward-looking statements are not guarantees of future performance. They have not been reviewed by the auditors of ACCIONA. You are cautioned not to place undue reliance on the
    forward-looking statements, which speak only as of the date they were made. All subsequent oral or written forward-looking statements attributable to ACCIONA or any of its members,
    directors, officers, employees or any persons acting on its behalf are expressly qualified in their entirety by the cautionary statement above. All forward-looking statements included
    herein are based on information available to ACCIONA, on the date hereof. Except as required by applicable law, ACCIONA does not undertake any obligation to publicly update or
    revise any forward-looking statements, whether as a result of new information, future events or otherwise.
    Results Report includes the list and definition of the Alternative Performance Measures (APMs) used both in this presentation and the Results Report, according to the guidelines
    published by the European Securities and Markets Authority (ESMA).
ACCIONA H1 2020 Results

3       H 1 2 0 2 0 ke y h i g h l i g h t s

    Full impact of COVID during second quarter of 2020
        H1 revenues and EBITDA down 15% and 29% respectively, relative to last year
         –   COVID impact estimated at €468m in revenues, and €144m at EBITDA level (of which €32m in Energy and
             €90m in Infra)

        Energy: resilient despite challenging environment
         –   New assets, hedging and regulatory protection partially offset...
         –   ...weak COVID-driven Spanish prices and lower regulatory income

        Infrastructure: major temporary impact in Construction - Industrial in particular - and non-essential Services
         –   In addition, H1 19 benefited significantly from SLR settlement
         –   Water performs strongly on the back of Middle East desalination market with limited COVID disruption

        Working capital marginally improves relative to Q1

        Net Debt expected to fall in H2 – EBITDA normalisation, marginal capex and disposal proceeds
ACCIONA H1 2020 Results

 4       Modest recovery from April lows

     Signs of a gradually normalizing environment
      Monthly operating results during Q2 hint at a gradual improvement in operating environment
      April saw a steep drop in activity as expected, with some improvement in May and June
        –     Expect normalization trend to continue during H2 – extent of recovery subject to uncertainties
      Electricity prices in Spain have somewhat recovered as we approach the summer and so have the forwards
      Delivery of infrastructure projects as of June had resumed to almost 100%
        –     Only two projects are currently suspended (Panama & Philippines) relative to 60% at the end of March
        –     Reaching a number of agreements with clients to adjust schedules and costs to share COVID burden

     Status of Infrastructure Projects(1) (€m)
                                                                              Projects with some form of on-going impact
                                                                               Minor disruption          80%
                                                                               Substantial disruption 3%

                                                                              Projects with no incidence
                                                                              Works temporarily suspended

(1) ~310 construction projects within the Construction and Water businesses
ACCIONA H1 2020 Results

5   Pandemic Protection Plan 2020 – significant progress

                                 Protecting
        Protecting our financial position andour business
                                              thus,       plan to deliver our business plan
                                                    our ability

      Liquidity &        Liquidity at peak levels - pre-emptive boosting of banking liquidity - €850m
        Funding
       Flexibility
                      
                      
                          Issuance of ~€575m in different capital market formats since the start of the pandemic
                          Business-as-usual refinancing of bilateral banking loans and credit lines
                                                                                                                            P
                       Dividend halved relative to initial proposal – social responsibility and financial prudence
    Dividend 2019
                       €1.925 DPS paid on 2 July 2020 - confidence on controlled leverage and liquidity position           P
     Reduction in      Cost efficiencies underway with ~€25m already achieved during Q2                                     In
    operating costs    Part of these efficiencies will have a permanent impact                                           progress

                       Actively pursuing asset rotation alternatives worth €1.2bn in aggregate to meet and
                        optimise €500m target                                                                                In
    Asset disposals
                       Concession assets, property developments, potentially energy minority stakes/partnerships         progress
                       Good visibility on valuation and execution – proceeds back-end loaded

                       Capex outflow deferral targets secured during Q2 – Energy investments carried out as
    Reduction in        planned but c.€500m of cash outflows pushed back to 2021 (including AEI-AXA deal)
     Investment
    Cash Outflow
                       Property Development investments mostly rescheduled until visibility increases (€250m)
                       Marginal investment cash outflows in H2 - Net investment cashflow (net of disposals) for
                                                                                                                            P
                        FY 2020 expected at c. €200-250m
ACCIONA H1 2020 Results

    6       Business Plan advancing despite COVID -19

        Energy long-term growth plans remain solid – further progress made during Q2
         Approved Energy projects currently at 1.3GW – 780MW under construction not materially affected by COVID
              –     Capacity additions during 2020 ~700MW
         Good progress with critical opportunities – expecting to sign shortly a PPA representing >50% of Tenaska (US
            PV) targeted volumes; 400MW PPA already signed for MacIntyre (Australian Wind), a key milestone
              –     Tenaska + MacIntyre + 1.3GW approved/under construction represent 80% of 5GW target
         Spanish regulatory/policy outlook much improved with recent Decree Law and draft auction framework
         First Spanish 10-year PPA signed with Telefónica – a growing market. Additional PPAs under negotiation
         Mexican wind projects under construction unaffected by regulatory changes – Santa Cruz & San Carlos

                                                USA
                                                                               Spain
                                             Chalupa      198MW
                                             Tenaska (1) 1,600MW             Celada III                    48MW
                                                                             Extremadura                  125MW
                                                      Mexico                 Ayora                         82MW
                                                                             Additional development 1,656MW
                                                   Santa Cruz 138MW          portfolio with connection rights
                                                   San Carlos 198MW                                                Australia
                                                                                                                  Mortlake    158MW
                                                               Chile
                                                                                                                  MacIntyre 1,026MW
                                                           Usya       64MW
                                                           Tolpan     84MW
                                                           Malgarida 238MW

(1) MWs with higher visibility out of the total pipeline
ACCIONA H1 2020 Results

7      Business Plan advancing despite COVID -19

    Infrastructure project backlog growing – potential for infrastructure-driven economic recovery
     Despite disruption in tender processes, some public clients are accelerating awards to help the recovery
        –   Private clients in certain sectors are speeding up planned investments
     New contract awards during H1 amount to €2,4bn, with additional projects worth €1.7bn in July
     The start of execution of newly awarded projects may however encounter obstacles (e.g. travel bans)
     Linha 6 metro negotiations and structuring entering final phase
     Completion of LendLease Engineering in coming months
     New contracts and tenders incorporating COVID-specific clauses to deal with potential future situations

Infrastructure projects Backlog evolution (€m)
ACCIONA H1 2020 Results

8     Green Deal & Next Generation EU opportunities

    The European Green Deal as the EU’s recovery strategy  new €1.8tn EU budget 2021-27 to power the Green Deal
                    “Repair short term damage in a way that also invests in our long-term future”

                                                             EUROPE
                                                                                   EU Multiannual Financial
                     EU Next Generation Fund
                                                                                         Framework
                        €750bn (2021-23)
                                                                                     €1,074bn (2021-27)

                               At least 30% of expenditure contributing to Climate objectives
                         EU expenditure should be consistent with "do no harm" Green Deal principle

                                                       GREEN PRIORITIES
               €25-38bn                           €44bn                             €91-350bn                                €40-60bn
       Renewable                               Infrastructure
       energy and          Battery            renovation and              Building                  Energy                  Clean
       renewable           storage               low carbon              renovation                efficiency           transportation
        hydrogen                                  transition

              Energy Business                         Construction Business                               Services Business

                           Figures may change until the European Parliament and the Council have reached a final agreement
ACCIONA H1 2020 Results

  9       Key figures H1 2020

                                                                                                       H1 2020          % Chg.
                                                                                                          (€m)      vs H1 2019
                         Revenues                                                                       3,042           -14.8%
                         EBITDA                                                                           499          -29.1%
                         EBT                                                                               42          -83.8%
                            of which Nordex contribution                                                   -72          +114.5%

                         Attributable net profit                                                           22          -85.7%

                                                                                                       H1 2020        H1 2019
                                                                                                          (€m)           (€m)
                         Total Investment                                                                504             701
                         Net Financial Debt                                                             5,281 (1)       4,738
                         Net Financial Debt incl. IFRS16 (2)                                            5,719           5,157

       Depreciation of wind and PV over 30 years – lower depreciation charges and one-off partial reversal of 2013 impairment
       EBITDA figures presented including equity-accounted investments when underlying activity is analogous to the group’s
(1) Including the reduction for the Net Debt of Spanish concessions classified held for sale (€127m)
(2) IFRS 16 adjustment €438m as of H1 2020 and €419m as of H1 2019 (restated to include land leases)
ACCIONA H1 2020 Results

10 E S G h i g h l i g h t s H 1 2 0 2 0

 Key ESG indicators                                                                                  ESG highlights
                                                                                                     ACCIONA has protected the health and safety of its
  Environmental Performance                               Jan-Jun 20    Jan-Jun 19       Chg. (%)
                                                                                                      employees during the COVID crisis, while ensuring
  Renewable installed power (MW)                              10,407         9,851            6%
                                                                                                      the continuity of its businesses
  Energy production (GWh)                                     12,104        11,245            8%

  Avoided emissions (CO₂ million ton)                             6.9           6.3          10%
                                                                                                     Creation of an internal Decarbonisation Fund to
                                                                                                      incentivize each business unit to fulfil the 1.5oC
  Generated emissions (CO₂ million ton)                        0.070         0.082          -15%
                                                                                                      science-based emissions reductions target
  CO₂ intensity (tCO₂/ revenue million €)                         23             23           0%

  Treated water (hm³)                                            459           508          -10%     ACCIONA was the first company to publish and
  Water consumed by ACCIONA (hm³)                                 0.9           1.1         -18%      audit its degree of alignment with the taxonomy
  Waste generation (million ton)                                  1.7           1.6           6%     Progress in H1 2020 with respect to the majority of
  Recovered waste (%)                                             56             80         -30%      ESG indicators aligned with our targets
   ACCIONA has been carbon neutral since 2016 and has approved science-based emission reduction
   targets (1.5º)

  Social Performance                                      Jan-Jun 20    Jan-Jun 19       Chg. (%)      ESG progress relative to targets
  Executive and manager women (%)                               20.9           20.4           2%

  Accident severity index (1)                                   71.3           78.6          -9%

  Accident frequency index (1)                                    1.8           2.6         -31%

  Social Impact Management projects (no.)                        114           124           -8%
  (1) Employees & contractors
ACCIONA H1 2020 Results

11 G r o u p : I n v e s t m e n t b y d i v i s i o n

Total Investment breakdown                               Key highlights
(Million Euro)            Jan-Jun 20   Jan-Jun 19         Energy growth represents the majority of
                                                            investment during H1:
Energy                          415          196

Infrastructure                   73          350
                                                              - Construction   of new windfarms mainly in
                                                                Mexico (Santa Cruz, San Carlos), USA (La
  Construction                   23           26                Chalupa, Palmas Altas), Australia (Mortlake)
  Concessions                     9          288                and Chile (Tolpán)

  Water                           8            6              - New PV capacity in Chile (Usya)
  Service                        33           30          The investment in the Infrastructure division
                                                            during the period mainly in equipment
Other Activities                  -4           -6
                                                          Other Activities includes the sale of Interfrisa
Net Ordinary Capex              484          540

Property Development             20          161
                                                          Steep decline in investment in property
                                                            development. H1 2019 included the Mesena
Total Investment                504          701            development project acquisition
ACCIONA H1 2020 Results

    12 G r o u p : N e t d e b t e v o l u t i o n

     Net debt reconciliation H1 2020 (€m)

                                                Operating                                                                                     Financing/
                                                                                                     Net Investment
                                                CF: 26€m                                                                                      Others CF:
                                                                                                      CF: -504€m
                                                                                                                                                111€m

                                                                                                                                                                                 438

                                                                                                                                                                     866
         902
                                                                                                                                                                     99
         126                                                                                                                                                        4.317
        3.887

                                                         (2)
                (1)
                                                                                                                                                (2)

                                               Debt associated to work in progress                           Derivatives                      IFRS16 adjustment

                                             H1 cashflow driven by COVID and front-end loaded capex
                                                       Expect significant improvement in H2
(1) IFRS16 adjustment as of December 2019 not included (€402m)
(2) IFRS16 lease payments: €59m, of which €12m is reflected in Financial results (interests) and €47m in Derivatives, FX & IFRS16 principal
ACCIONA H1 2020 Results

13 G r o u p : N e t f i n a n c i a l d e b t

Net financial debt breakdown by nature (€m)               Net debt & cash interest evolution (€m)

                                                                          Av. maturity undrawn
              Average cost of debt      Average debt maturity (years)
                                                                           Credit Lines (years)

                   Project debt

                    Corporate
                      debt
ACCIONA H1 2020 Results

 14 C u r r e n t l i q u i d i t y p o s i t i o n

  Successful actions to boost liquidity – comfortable position to address any market volatility
          Incremental liquidity actions COVID-19:
           - ~€850m in bilateral COVID-related committed facilities arranged from our relationship banks
           - ~€575m additional new issuance in ECP, EMTN, SSD and NSV formats
           - Ordinary course of business renewal of bilateral credit lines and loans
          Extension of syndicated credit line of €1.44bn, and €1.3bn syndicated term loan from 2024 to 2025
          DBRS investment grade rating BBB, R-2 (middle) – eligibility for ECB debt purchase programmes

  Liquidity evolution and Jul-Dec 2020 debt maturities
                                                           Total liquidity (€m)                                                                       Jul-Dec 20 debt maturities (€m)

                                                                                                                                                                                  ECP

                                                                                                                                                                                  EMTN
                                                                                                                                                                                  Term Loans
                                                                                                                                                                                  Credit lines
                                                                                                                  (1)                                                             Project Debt

(1) Adjusted for Nordex tender offer cash deposit. Deposit cancelled and facility repaid on 10 of Jan 2020. FY 2019 available facilities figure included €455m undrawn amounts from €675m
    ESG-linked syndicated term loan
ACCIONA H1 2020 Results

15 E n e r g y

 Key figures                                                                               EBITDA evolution (€m)
  (Million Euro)                  Jan-Jun 20      Jan-Jun 19            Chg.    Chg. (%)       Output    +3             Output    -9
                                                                                               Price    -78             Price     +3
   Generation Spain                       326              410           -83     -20.4%        Other    +33             Other     -2
   Generation International               337              330             7       2.2%
   Other & Adjustments                    182              296          -113     -38.3%
  Revenues                                846          1,035            -189     -18.3%
   Generation Spain                       185              228           -43     -18.7%
   Generation International               236              221           15        6.8%                         -3.7%
   Other & Adjustments                    -19              -31           12       38.7%
  EBITDA                                  403              418           -16      -3.7%
     Generation Margin (%)              63.6%         60.7%

Consolidated capacity variation (MW)                                                       Consolidated production (GWh)
                                                                 +126     +42      8,344
                                                   +183
                                          +88
                               +122
  7,787

             (2)         (3)
                                        +556 MW                                                                +5.4%

 H1 2019     Wind      Hydro   Wind       Wind     Wind     PV Chile PV Ukraine H1 2020
             Spain     Spain   Mexico     USA      Chile
ACCIONA H1 2020 Results

16 E n e r g y B u s i n e s s P l a n

  Short term growth                                                   Other singular developments in progress

                                                                              Australia – MacIntyre Complex
                                                                                      1,026MW Gross

                                                                                USA – Tenaska PV Portfolio
                                                                              Targeting 1,600MW by 2024 (1)

                                                                              Spain – Development Portfolio
                                                                       Additional 1,656MW with connection rights (2)

                                             c. 80% of 5GW target with high visibility
(1) Total Tenaska US PV portfolio of 3.0GW
(2) Total Spanish pipeline of 3.3GW
ACCIONA H1 2020 Results

17 I n f r a s t r u c t u r e

Key figures                                                              EBITDA evolution (€m)
 (Million Euro)              Jan-Jun 20   Jan-Jun 19   Chg.   Chg. (%)
 Construction
                                                                                                   -76.2%
  Revenues                        1,283        1,759   -476    -27.0%
  EBITDA                             2          198    -196    -98.9%
    Margin (%)                    0.2%        11.3%

 Concessions
  Revenues                          37           40      -3     -7.7%
  EBITDA                            22           28      -7    -23.9%
    Margin (%)                   58.4%        70.8%

 Water
  Revenues                         487          289    198      68.5%
  EBITDA                            41           25     16      65.4%    Total Backlog (€m)
    Margin (%)                    8.4%         8.6%

 Services
  Revenues                         354          390     -35     -9.1%                                                    North America
                                                                                  Water O&M                              Australia & SE Asia
  EBITDA                             -1          15     -16   -108.4%
                                                                                    Services
    Margin (%)                   -0.4%         3.9%                                                                      EMEA(1)
 Consolidation Adjustments          -42          -13    -30   -237.8%
                                                                                 Project Backlog
                                                                                                                         Latam (2)
 Total Infrastructure                                                             (Construction
                                                                                    & Water)
  Revenues                        2,119        2,465   -346    -14.0%                                                    Spain
  EBITDA                            63          267    -203    -76.2%

                                                                                                                   (1) Spain not included
                                                                                                                   (2) Mexico included in Latam
ACCIONA H1 2020 Results

18 O t h e r A c t i v i t i e s

Property Development - Key figures                                        Bestinver - Key figures

  (Million Euro)             Jan-Jun 20   Jan-Jun 19   Chg.   Chg. (%)   (Million Euro)   Jan-Jun 20   Jan-Jun 19   Chg.   Chg. (%)
  Revenues                          85           56     29      52.7%    Revenues                48           48       0      0.7%
  EBITDA                            10            -9    19     210.4%    EBITDA                  26           31      -5    -15.1%
     Margin (%)                  11.6%       -16.0%                         Margin (%)        54.2%        64.2%

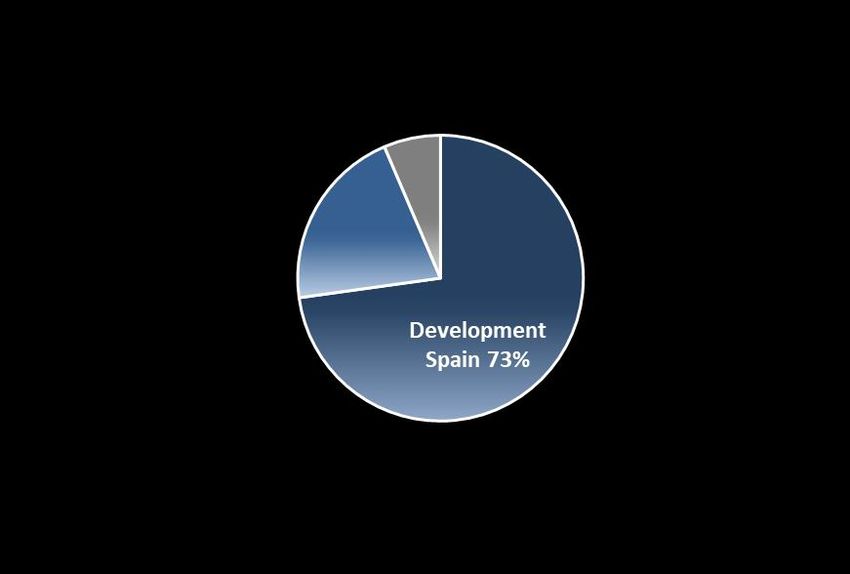
GAV breakdown                                                             Assets under management (€m)

                   €1,060m
ACCIONA H1 2020 Results

19 C o n c l u d i n g r e m a r k s

     COVID pandemic takes its toll on financial results primarily in Q2 due to disruption in infra projects and
      lower Spanish power prices

     Monthly results evolution suggests gradual recovery – expect significant improvement in H2…
      – …albeit subject to obvious uncertainties on general state of the global economy and the evolution of
         the pandemic in the Autumn

     ACCIONA’s Pandemic Protection Plan 2020 is well underway – committed to protecting balance sheet
      and therefore, our ability to deliver our long-term growth and shareholder remuneration objectives

     Marginal capex outflows, adding to disposal proceeds and normalising EBITDA to drive debt reduction in
      second half of the year

     Improved growth visibility in Energy and Infra achieved in recent months
      – demand for sustainable energy & infrastructures is strong and could grow in COVID aftermath

     Post-COVID financial outlook 2020 remains valid despite downside business environment risks
      – ACCIONA ready to step-up actions - if needed - to contain temporary increase in 2020 gearing ratio
Appendix
ACCIONA H1 2020 Results

  21 A C C I O N A : E B I T D A b y t y p e o f a c t i v i t y

                                                                                   Jan-Jun     Jan-Jun
      (Million Euro)                                                                                                                         LT CONTRACTED
                                                                                     2020        2019
                                                                                                                                                  ASSETS
                                                                                                                                 74%                &                62%
      Renewable Generation                                                             422         449                                    INFRA MANAGEMENT
      Infrastructure Concessions - Trans., Social & Water                               31          48                                        CONTRACTS (2)
      Long-term Asset Business                                                         453         497
                                                                                                                Non LT
      Infrastructure Services                                                           16          28        Contracted (16%)
                                                                                                              Generation
      Financial Services                                                                26          31
      Services Business                                                                 42          59                                                 (10%)

      Greenfield Infrastructure - Infra projects                                        20         197
      Renewable Energy Development                                                      -8         -11
      Property Development                                                              10          -9
      Greenfield Development Business                                                   21         177

      Corporate & other                                                                -17          -28
                                                                                                                                            EBITDA (€m)
      Total ACCIONA                                                                    499         704

      LT asset business as % of total EBITDA (1)                                      88%          68%
                                                                       (1)(2)
      LT contracted assets & infra.mngt.contracts as % of total EBITDA                74%          62%

                                 Long-term Asset Business                                                                        Greenfield Development Business
                                                                                             Services Business
                                 Renewable Generation                                                                            Greenfield Infrastructure – Infra projects
                                                                                             Infrastructure Services
                                 Infrastructure Concessions - Trans., Social &                                                   Renewable Energy Development
                                                                                             Financial Services
                                 Water                                                                                           Property Development

(1) Percentages are calculated on EBITDA before consolidation adjustments, corporate costs & others
(2) Renewable Generation excluding Non LT Contracted + Infrastructure Concessions + Infrastructure Services
ACCIONA H1 2020 Results

 22 G r o u p : D e b t m a t u r i t y & b r e a kd o w n

  Gross Debt maturity (€m)                                                                                                       1,441
                                                   1,281
                                                                                                                      (1)
                                                                                                              1,060
                                                                          911
                              765
                                                                                                                                             700

                                                                                          410

  Debt breakdown by nature

      Gross financial debt - Level                      Gross financial debt - Currency         Gross financial debt - Interest rate     Corporate debt

(1) Extension of €1.3bn syndicated term loan from 2024 to 2025 signed in April
ACCIONA H1 2020 Results

 23 I n c o m e f r o m a s s o c i a t e s 2 0 1 9 & 2 0 2 0 b r e a kd o w n

                                                                                                                  Income from Associates

          •                            •                                   H1 2020           Q1 2020             Q1 2019        H1 2019    9M 2019        FY 2019

         Energy                                                               37                28                  17            30         39             46

            Generation Spain                                                  26                25                  11            15         19             26

            Generation International                                          10                 4                  5             13         17             17

            Other                                                              1                 0                  1             2          2              3

         Infrastructure                                                        1                 7                  17            16         25             35

            Construction                                                      -15               -1                  9             -3         -5             -5

            Water                                                             10                 4                  5             11         18             23

            Services                                                           0                 0                  0             0          0              0

            Concessions                                                        6                 3                  3             7          12             17

         Other Activities                                                      0                 0                  0             0          0              0

         Operating income from associated companies                           38                35                  34            46         64             81

         Non-operating income from associated companies (Nordex)              -72               -22                -10            -33        -34            -20

         Income from associated companies (1)                                 -34               12                  24            12         30             61

(1) The 2019 figures has been restated with contribution from associates with negative BV included in “other gains or losses”
ACCIONA H1 2020 Results

24 E n e r g y b u s i n e s s – g r o w t h v i s i b i l i t y

 Energy long-term growth plans remain solid – further progress made during Q2
                                                                                     MW          MW
                                                 % ANA   Total   Consol.   Net                          MW start Expected
     Technology Country         Asset name                                          added       const.                                                           Details
                                                 stake   MW       MW       MW                          const. 2021 COD
                                                                                     YTD      Jun 2020
        PV        Chile            Usya          100%     64       64       64          64        -             -       Q3 2020                               Private PPA

       Wind       Chile           Tolpán         100%     84       84       84          78        -             -       Q3 2020                   PPA with Discoms + Private PPA

       Wind      Mexico         Santa Cruz       100%    138       138     138          122      16             -       Q4 2020                               Private PPA

       Wind      Mexico         San Carlos       100%    198       198     198           -      198             -       Q3 2021                               Private PPA

       Wind     Australia        Mortlake        100%    158       158     158           -      158             -       Q2 2021                        PPA with State of Victoria

       Wind       USA            Chalupa         100%    198       198     198          28      170             -       Q4 2020                 Financial hedge + PTC + Merchant

       Wind       Spain          Celada III      100%     48       48       48           -        -            48       Q4 2021                       Private PPA / Supply business

        PV        Chile         Malgarida        100%    238       238     238           -      238             -       Q3 2021                               Private PPA

        PV        Spain        Extremadura       100%    125       125     125           -        -           125       Q1 2022                               Private PPA

        PV        Spain           Ayora          100%     82       82       82           -        -            82       Q1 2022                               Private PPA

       Total                                             1,334    1,334    1,334        293     780           255

 Other singular developments
                                                 Total    Construction
    Technology Country         Asset name                                  Expected COD                                                     Details
                                                 MW         Period

                                                                                               Private PPA signed with CleanCo (Queensland State-owned supplier) for 40% of the production.
       Wind     Australia   MacIntyre Complex    1,026    2021-2023              2023         103MWs to be adquired by CleanCo. In advanced negotiations with offtaker-investment partners
                                                                                                                              and working on additional PPAs

        PV        USA            Tenaska         1,600    2021-2024         2022-2024           Private PPA. First contracts to cover more than 50% of the portfolio target expected shortly

     Wind/PV/
                 Spain       Spanish Portfolio   1,656    2021-2024         2022-2024                 MWs already with interconnection rights. Awaiting full regulatory framework clarity
     Biomass
       Total                                     4,282
ACCIONA H1 2020 Results

25 E n e r g y b u s i n e s s – I n s t a l l e d c a p a c i t y

                                                              Installed MW

                 30-Jun-20
                  •                            Total     Consolidated   Eq accounted   Net

                 Spain                         5,676        4,451            593       5,013

                   Wind                        4,738        3,514            593       4,078

                   Hydro                        873          873              0        873

                   Solar PV                      3            3               0         3

                   Biomass                      61           61               0         59

                 International                 4,731        3,893            358       3,340

                   Wind                        3,465        3,263            48        2,501

                   CSP                          64           64               0         43

                   Solar PV                    1,203         566             310       796

                 Total                        10,407        8,344            952       8,353
ACCIONA H1 2020 Results

 26 E n e r g y b u s i n e s s – E q u i t y - a c c o u n t e d c a p a c i t y

                                                           H1 2020 (proportional figures)
                                                                                                          (1)
              30-Jun-20                MW          GWh              EBITDA         NFD      Average COD

              Wind Spain               593         607                9            101          2005

              Wind International       48           50                1             -1          2005

                Australia              32           30                0             -1          2005

                Hungary                12           13                0             0           2006

                USA                     4           7                 0             0           2003

              Solar PV                 310         365                6             63          2017

              Total equity accounted   952         1,022              16           162

(1) Average COD weighted per MW
ACCIONA H1 2020 Results

 27 E n e r g y b u s i n e s s – W i n d d r i v e r s b y c o u n t r y

  Wind prices (€/MWh) (1) and Load factors (%)

                                                                       H1 2020                           H1 2019                   Chg. (%)

                                                      Av. price (€/MWh)          LF (%)   Av. price (€/MWh)        LF (%)      Av. price (€/MWh)

                            Spain Average                    64.5                22.5%          74.7               26.3%            -13.7%
                             Spain - Regulated               79.3                               86.0
                             Spain - Not regulated           37.6                               52.2
                            Canada                           56.2                33.2%          57.8               31.4%            -2.6%
                            USA(2)                           23.5                32.5%          27.3               34.6%            -14.0%
                            India                            51.5                21.9%          52.9               21.9%            -2.7%
                            Mexico                           65.5                36.0%          63.3               37.6%             3.6%
                            Costa Rica                       105.4               62.7%          99.7               66.8%             5.8%
                            Australia                        59.1                31.4%          68.9               30.5%            -14.2%
                            Poland                           72.3                31.1%          87.0               31.1%            -16.9%
                            Croatia                          108.3               29.9%         109.0               35.8%            -0.6%
                            Portugal                         102.8               24.1%         109.4               28.3%            -6.1%
                            Italy                            116.3               18.6%         130.5               20.8%            -10.9%
                            Chile                            59.0                33.7%         103.2               23.0%            -42.8%
                            South Africa                     73.6                28.7%          79.7               28.8%            -7.6%

(1) Prices for consolidated MWs
(2) 238MW located in the US additionally receive a “normalized” PTC of $25/MWh
ACCIONA H1 2020 Results

28 E n e r g y b u s i n e s s – O t h e r t e c h n o l o g i e s d r i v e r s b y c o u n t r y

Other technologies (€/MWh) and Load factors (%)

                                              H1 2020                           H1 2019                      Chg. (%)

                               Av. price (€/MWh)        LF (%)   Av. price (€/MWh)        LF (%)         Av. price (€/MWh)

        Hydro

        Spain                        39.5               38.3%          57.7               23.8%               -31.5%

        Biomass

        Spain                       122.7               86.9%         149.4               81.0%               -17.9%

        Solar Thermoelectric

        USA                         182.4               19.6%         176.2               20.2%                3.5%

        Solar PV

        South Africa                147.6               22.9%         159.1               25.2%               -7.2%
        Chile                        72.2               21.5%          67.0               19.6%                7.7%
        Ukraine                     145.8               13.9%         149.2               23.6%               -2.2%
ACCIONA H1 2020 Results

 29 I n f r a s t r u c t u r e b u s i n e s s – C o n c e s s i o n s

                                                          Road            Rail          Canal           Port          Hospital        Water              TOTAL

           # of concessions                                6               2              1               1              5              53                68

           Proportional EBITDA H1 2020 (€m)                21              3              1               0             16              25                60

           Consolidated EBITDA H1 2020 (€m)                18              0              -1             0              10              21                42

           Average life (yrs)                              30             26              30             30             28              26                27

           Average consumed life (yrs)                     13              8              14             15             10              13                11

           Invested capital¹ (€m)                         330             370             75             17             335            262               1,400

                           By region                                                  By status
                                                                                                                                                                       Equity          Net debt
                                                                                                                                                                                                (2)
                                                                                                                                                 Infrastruc.             463              675
     Invested                                                                                                                                                                                   (3)
                                                                                                                                                 Water                   134              128
      capital
    (€1,400m)                                                                                                                                    Total                   597              803

 Note: For construction concessions EBITDA and invested capital include -€5m and €10m from holdings respectively. Lives are weighted by BV excluding holdings
(1) Invested capital: Capital contributed by banks, shareholders and others finance providers
(2) Debt figure includes (i) net debt from concessions accounted by the equity method (€165m), (ii) net debt from the Spanish concessions portfolio held for sale accounted by the equity method
    (€309m) and (iii) net debt from the Spanish concessions portfolio held for sale fully consolidated (€123m)
(3) Debt figure includes net debt from water concessions accounted by the equity method (€87m)
H1 2020 – January-June
Results presentation

                         30 th July 2020
You can also read