Tesla First Quarter 2018 Update
←
→
Page content transcription
If your browser does not render page correctly, please read the page content below

Tesla First Quarter 2018 Update
Model 3 production hit 2,270/week in April for the 3rd straight week over 2,000
Q1 Auto GAAP gross margin up sequentially by 80 bp and non-GAAP by 500 bp
Cash balance of $2.7 billion at the end of Q1
2018 Capex projection reduced from >$3.4 billion to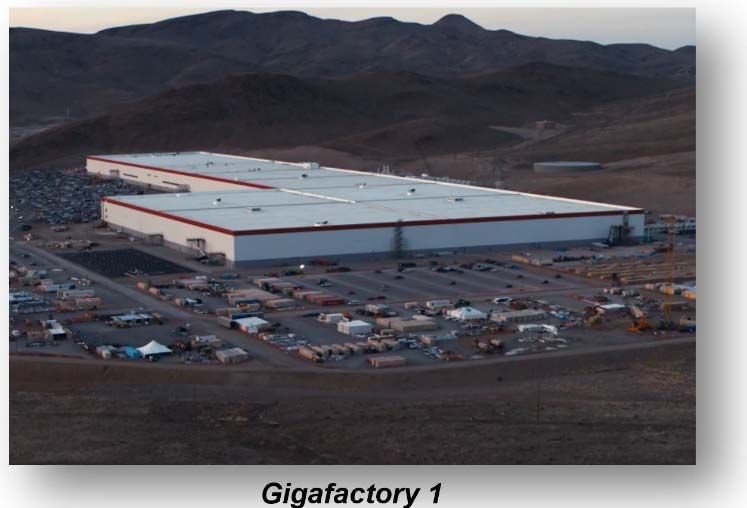
We are already seeing many benefits from heavily increasing
                                                                  automation as part of the Model 3 production process. Through the
                                                                  vast majority of Model 3 production, including in body welding, general
                                                                  assembly, inverter and drive unit production, our automation effort has
                                                                  been very successful. Based on every measurable metric, Model 3 is
                                                                  already the highest quality vehicle we have ever produced, and this is
                                                                  unquestionably due in large part to automation. Additionally, we’ve
                                                                  been able to create significant safety benefits in the factory. For
                                                                  example, many steps in the assembly process, including “marriage” of
                                                                  the battery pack and drive unit with the body, and installation of the
                                                                  instrument panel, seats, and wheels, are ergonomically challenging for
                                                                  our employees, but by automating these processes, we have been
                                                                  able to solve this and significantly improve safety for our team.

                                                               That said, a step change in manufacturing doesn’t come without its
                                                               challenges, particularly early in the process, and we made a mistake
                                                               by adding too much automation too quickly. In those select areas
                                                               where we have had challenges ramping fully automated processes,
                                                               such as portions of the battery module line, part of the material flow
system, and two steps of general assembly, we have temporarily dialed back automation and introduced certain semi-automated or
manual processes while we work to eventually have full automation take back over. This flexibility has enabled us to continue to ramp
Model 3 to new levels.

Automation is only half the story. Higher levels of automation have been enabled by a dramatic simplification of product design. Our
Model 3 general assembly line consists of fewer than 50 steps, which is about 70% less than conventional assembly lines. All Model 3
vehicles use only one standard body frame, down from more than 80 for Model S, a wiring harness that has 50% less mass than
average vehicles, and a fraction of the number of controllers, connectors and CPUs. All these elements are rooted in design and
critical not only to our ability to reach higher levels of output in a smaller amount of factory space but also to achieve lower levels of
cost.

The Model 3 battery has sophisticated power electronics, cooling systems and structure that enables high level of safety, sports-car like
acceleration, Supercharging, a 120,000 mile warranty and low cost. Cells used in Model 3 are the highest energy density cells used in
any electric vehicle. We have achieved this by significantly reducing cobalt content per battery pack while increasing nickel content and
still maintaining superior thermal stability. The cobalt content of our Nickel-Cobalt-Aluminum cathode chemistry is already lower than
next-generation cathodes that will be made by other cell producers with a Nickel-Manganese-Cobalt ratio of 8:1:1. As a result, even
with its battery, the gross weight of Model 3 is on par with its gasoline-powered counterparts.

Demand for our flagship Model S and Model X vehicles remains very strong. After all-time record orders in Q3 and Q4 2017, we had
our highest ever Q1 for orders. With demand exceeding supply, we are making considerable progress with margin improvement. In
Q1, we produced 24,728 Model S and X and 9,766 Model 3 vehicles, and delivered 21,815 Model S and Model X vehicles and 8,182
Model 3 vehicles, totaling 29,997 deliveries. Short-term operational and logistical issues led to an increase in the number of Model S
and Model X vehicles in transit to customers at the end of Q1. Model 3 net reservations, including configured orders that had not yet
been delivered, continued to exceed 450,000 at the end of Q1 even though fewer than 20 stores worldwide had Model 3 on display.
We are planning to deploy significantly more Model 3 vehicles in our stores in Q2 this
year.

On March 15, we released a significant Autopilot update, which has been well
received by our customers. Also, our mapping architecture has been upgraded
and establishes a key platform to enable safer driving and the transition
towards full autonomy. The latest mapping software in our cars is dramatically
simpler and faster, providing a better user experience and superior
performance.

During Q1, we opened nine new store and service locations, resulting in 339
locations worldwide at the end of the quarter. We continue to expand our
service capacity mainly through growth of our electrified Mobile Service fleet.
Such service capacity is quicker to deploy, incurs lower upfront and operating
costs and has continued to generate significantly higher customer satisfaction
rate at an average of 98%. There are about 300 mobile service vehicles in
operation today, which is an equivalent of approximately 60 service locations.
At the end of Q1, 25% of all service carried out in North America was done
without customers having to visit a physical service center.

Last quarter, we opened 77 new Supercharger locations for a total of 1,205 Supercharger stations and more than 9,300 stalls
worldwide. Most of the growth is currently focused on North America to support the initial Model 3 rollout. Nevertheless, in Europe, we
already operate about 400 Supercharger stations. We continue to build Supercharger stations in locations with the highest demand
and the most reservation holders. As a result, we are able to open new stations in specific locations even before fleet expansion takes
place.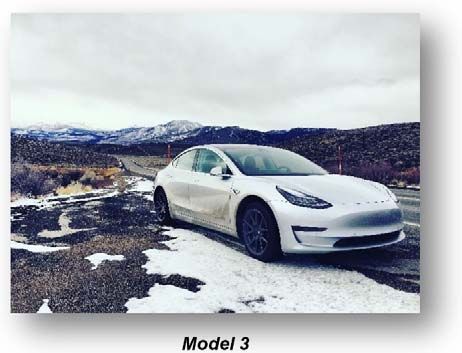
ADVANCING SUSTAINABLE ENERGY
While Model 3 is clearly in the spotlight both externally and internally, 2018 should be a very important year for our energy storage
business. We continue to aim for a three-fold increase in MWh deployed for our energy storage products this year.
In Q1, energy storage deployments grew 161% from Q4 2017 to 373 MWh, which includes the 129 MWh South Australia project that
was installed last year with final commercial transfer occurring in Q1. Electric utilities and power producers around the globe are
increasingly appreciating the value proposition of our Powerpack storage systems based not only on economic benefits but also on the
operational benefits of faster response time and greater reliability of the electric grid. In addition, we deployed a record number of
residential Powerwall systems in Q1. In spite of the significant growth of Powerwall deliveries, our backlog in Q1 continued to grow.
We also deployed 76 MW of solar energy generation systems in Q1. Cash
and loan system sales made up 66% of residential deployments in the
quarter, up from 31% in Q1 2017 and 9% in Q1 2016. Due to higher upfront
cash sales, lower emphasis on less profitable commercial projects and
consolidation of our sales channels, our solar business had slightly positive
cash flow throughout 2017. We are expecting cash flow from our solar
business to remain at this level in the first half of 2018 and then improve
significantly thereafter.
Solar deployments have declined over the last few quarters due in large
part to our strategic decision to shutter certain sales channels and market
segments. These decisions had a negative impact on our deployments but
created a positive impact on our cash generation. Furthermore, a
significant part of our customer base is waiting for a Powerwall before
getting their solar panels installed. We continue to prioritize Powerwall
deliveries when they are sold together with our retrofit solar panels, and this
should have a positive impact on our solar deployments in upcoming quarters.
Our Solar Roof facility in Buffalo continued to ramp in Q1. We are working to enhance the product design and manufacturing process
in order to improve the customer experience while reducing manufacturing cost and achieving high levels of quality. Production of
Solar Roofs should accelerate significantly in the second half of this year.
Over the past couple of quarters, we have increased efforts to sell energy generation and storage systems in Tesla stores. We are
seeing clear signs of a pickup in order rates for retrofit solar installations through Tesla stores. These are now being offered in over 90
Tesla stores in the US, and we continue to expand the offering to the rest of our stores across the US.
Q1 2018 RESULTS
Revenue & Gross Margin
Three Months Ended Change
March 31, December 31, March 31,
2018 2017 2017 QoQ YoY
Automotive revenue ($000) $ 2,735,317 $ 2,702,195 $ 2,289,600 1% 19 %
Automotive gross margin – GAAP 19.7 % 18.9 % 27.4 % 81 bp -766 bp
Automotive gross margin excluding SBC
and ZEV credit – non-GAAP 18.8 % 13.8 % 27.8 % 498 bp -904 bp
Automotive revenue in Q1 2018 increased by 19% over Q1 2017, mainly due to Model 3 deliveries and adoption of the new
accounting standard described below. ZEV credit sales in Q1 2018 were $50 million as compared to zero in Q1 2017.
With the adoption of the new revenue recognition standard starting January 1, 2018, lease accounting generally applies only to
vehicles directly leased by us without using bank partners. As a result of this change, only 8% of our deliveries in Q1 were subject
to lease accounting. We are not expecting to offer a leasing option on Model 3 this year as we continue to focus on cash sales.
Non-GAAP Automotive gross margin improved significantly to 18.8% in Q1 as compared to the prior quarter. Gross margins of
Model S and Model X have increased to slightly above 25% due to better cost reductions, mix management, FX gains and pricing
actions compared to Q4. GAAP Automotive gross margin improved to 19.7%.
Model 3 gross margin remained negative in Q1 due to temporary underutilization of our manufacturing capacity, which was in line
with our expectations.
The recent voluntary recall of 125,000 Model S vehicles related to steering bolt corrosion was not material to our warranty reserves
and is expected to be covered by the indemnification obligations of the supplier.
Three Months Ended Change
March 31, December 31, March 31,
2018 2017 2017 QoQ YoY
Energy generation and storage revenue ($000) $ 410,022 $ 298,037 $ 213,944 38 % 92 %
Energy generation and storage gross margin 8.5 % 5.5 % 29.1 % 298 bp -2,061 bp
Energy generation and storage revenue in Q1 2018 increased by 92% over Q1 2017 and by 38% compared to Q4 2017. This was
mainly driven by substantial growth of our energy storage deployments and recognition of our large project in South Australia.
GAAP energy generation and storage gross margin in Q1 2018 improved compared to Q4 2017 mainly due to an improvement of
energy storage margin and fewer one-time items. We expect this improvement trend to continue in subsequent quarters.
Other Highlights
Service and Other revenue in Q1 2018 increased by 37% compared to Q1 2017 primarily due to higher used car sales, but
decreased by 9% sequentially as used car sales were lower in Q1 2018 compared to Q4 2017 due to a lower inventory of used
cars available for sale during the quarter.
Service and Other gross loss in Q1 2018 increased to $118 million as a result of the continued growth and maturation in our
service infrastructure. Our used car sales had slightly positive gross margin.
We expect Service and Other losses to reduce substantially in the coming quarters as our service infrastructure becomes
significantly more utilized with the ramp of our Model 3 fleet size. There are also substantial revenue generating opportunities as
we open our own body shops in 2018 to improve costs of out-of-warranty repairs and as we increase our offering of accessories
and merchandise.
Operating expenses in Q1 2018 increased by 14% compared to Q1 2017, and by less than 2% compared to Q4 2017 to a total of
$1.05 billion in spite of significant revenue growth. Excluding stock based compensation, our operating expenses reached $930
million in Q1.
Basic shares outstanding at the end of Q1 2018 were approximately 170 million.
Cash Flow and Liquidity
Cash outflow from operating activities in Q1 2018 was $398 million primarily due to an increase in inventory and accounts
receivable balances as a result of the timing of deliveries. Higher number of Model S and Model X vehicles in transit at the end of
Q1 2018 compared to Q4 2017 had a negative impact of about $120 million on our working capital. Additionally, due to a
substantial increase in our deliveries in the last few days of the quarter, our accounts receivables negatively impacted our
operating cash flow by $169 million in Q1. Both of these factors provided cash inflows during April.
We received $112 million in net funding from our vehicle lease warehouse lines, automotive asset-backed notes, auto tax equity
fund and collateralized lease borrowings. When combined with free cash flow, this is a better indicator of the cash consumed in
the quarter.
More than half of our capex in Q1 was related to completion of work for Model 3 production capacity at Fremont and Gigafactory 1
plus payments to suppliers for tooling.
OUTLOOK
During Q2, we expect to shut down production for about 10 days, which includes the shutdown we took in April, to address bottlenecks
across the lines and increase production to new levels. Our goal is to produce approximately 5,000 Model 3 vehicles per week in about
two months.
We are in the process of changing the quarterly production pattern of Model S and X vehicles for the various worldwide regions to
ensure a more linear flow of deliveries through the quarter. We believe this will provide a better customer experience and reduce the
stress on our delivery system. Consequently, Model S and X deliveries in Q2 will likely be similar to Q1 but should pick up considerably
in Q3 to achieve our goal of 100,000 deliveries for the full year.
Our long-term gross margin target of 25% for Model 3 has not changed. In the medium term, we expect to achieve slightly lower
margin due to higher labor content in certain areas of manufacturing where we have temporarily dialed back automation, as well as
higher material costs from recently imposed tariffs, commodity price increases and a weaker US dollar. On the other hand, our average
selling price is significantly higher than prior projections, so we expect to achieve higher gross profit per vehicle than we previously
estimated.
With increasing capacity for Powerwall and Powerpack products at Gigafactory 1, energy generation and storage revenues should
continue to grow significantly throughout the year. Energy storage gross margins should therefore become positive in the second half
of 2018. Our solar business is likely to experience mild growth for another quarter or two before our revised sales strategy starts to
show its full impact in final deployments.Quarterly non-GAAP operating expenses should grow sequentially at approximately the same rate as in the past four quarters, with our
gross profit expected to grow much faster than our operating expenses. Thus, provided that we hit the 5,000 unit milestone in our
projected timeframe and execute to the rest of our plan, we will at least be profitable in Q3 and Q4 excluding non-cash stock based
compensation and we expect to achieve full GAAP profitability in each of those quarters as well. Also, considering our capex targets,
we expect to generate positive cash in Q3 and Q4, including the inflow of cash that we receive in the normal course of our business
from financing activities on leased vehicle and solar products.
We have significantly cut back our capex projections by focusing on the critical near-term needs that benefit us primarily in the next
couple of years. At this stage, we are expecting total 2018 capex to be slightly below $3 billion, which is below the total 2017 level of
$3.4 billion. Ultimately, our capex guidance will develop in line with Model 3 production and profitability. We will be able to adjust our
capital expenditures significantly depending on our operating cash generation.
Interest expenses in Q2 should amount to roughly $160 million and losses attributable to non-controlling interest should remain in line
with the last quarter.
We have good visibility of our path to fully ramp and stabilize Model 3 production this year. Model 3 is already the best-selling electric
vehicle and, more importantly, on the cusp of becoming the best-selling premium sedan in the US. The path to an electrified revolution
is not easy, but what we’re trying to achieve is worth fighting for. Thanks for your continued support.
Elon Musk, Chairman & CEO Deepak Ahuja, Chief Financial OfficerWEBCAST INFORMATION
Tesla will provide a live webcast of its first quarter 2018 financial results conference call beginning at 2:30 p.m. PT on May 2, 2018, at
ir.tesla.com. This webcast will also be available for replay for approximately one year thereafter.
NON-GAAP FINANCIAL INFORMATION
Consolidated financial information has been presented in accordance with GAAP as well as on a non-GAAP basis to supplement our
consolidated financial results. Our non-GAAP financial measures include non-GAAP gross margin, non-GAAP net income (loss)
attributable to common stockholders, non-GAAP net income (loss) attributable to common stockholders on a per share basis, and
operating cash flows plus change in collateralized lease borrowing. Management believes that it is useful to supplement its GAAP
financial statements with this non-GAAP information because management uses such information internally for its operating, budgeting
and financial planning purposes. These non-GAAP financial measures also facilitate management’s internal comparisons to Tesla’s
historical performance as well as comparisons to the operating results of other companies. Management also believes that presentation
of the non-GAAP financial measures provides useful information to our investors regarding our financial condition and results of
operations because it allows investors greater transparency to the information used by Tesla management in its financial and
operational decision-making so that investors can see through the eyes of Tesla management regarding important financial metrics that
Tesla management uses to run the business as well as allows investors to better understand Tesla’s performance. Non-GAAP
information is not prepared under a comprehensive set of accounting rules and therefore, should only be read in conjunction with
financial information reported under U.S. GAAP when understanding Tesla’s operating performance. A reconciliation between GAAP
and non-GAAP financial information is provided below.
FORWARD-LOOKING STATEMENTS
Certain statements in this shareholder letter, including statements in the “Outlook” section; statements relating to the progress Tesla is
making with respect to product and software development, such as Model 3 and its variants, Solar Roof and Autopilot; statements
regarding growth in the number of Tesla stores, Supercharger stations and in our service and repair capabilities; statements relating to
the production process, including our automated production capabilities, production rate and delivery timing of products such as
Model 3, Solar Roof and our other energy generation and storage products; statements regarding growth of our energy business and
means to achieve such growth; growth in demand and orders for Tesla products and the catalysts for that growth; the ability to achieve
product demand, volume, market share, production, delivery, inventory, deployment, revenue, cash generation, cash flow, leasing,
gross margin, expense, capital expenditure and profitability targets; productivity improvements and capacity expansion plans, such as
for the Tesla Factory and Gigafactory 1; and statements regarding Gigafactory 1 and Gigafactory 2 timing, plans and output
expectations, including those related to battery cells and modules, Solar Roof tiles and other production, are “forward-looking
statements” that are subject to risks and uncertainties. These forward-looking statements are based on management’s current
expectations, and as a result of certain risks and uncertainties, actual results may differ materially from those projected. The following
important factors, without limitation, could cause actual results to differ materially from those in the forward-looking statements: the risk
of delays in the manufacture, production, delivery and/or completion of our vehicles and energy products, particularly Model 3; the
ability to design and achieve and grow simultaneous and separate market acceptance of Model S, Model X and their variants, as well
as new vehicle models, specifically Model 3; the ability of suppliers to meet quality and part delivery expectations at increasing
volumes, especially with respect to Model 3 parts; adverse foreign exchange movements; any failures by Tesla products to perform as
expected or if product recalls occur; Tesla’s ability to continue to reduce or control manufacturing and other costs; consumers’
willingness to adopt electric vehicles; competition in the automotive and energy product markets generally and the alternative fuel
vehicle market and the premium sedan, premium SUV and small to medium-sized sedan markets in particular; Tesla’s ability to
establish, maintain and strengthen the Tesla brand; Tesla’s ability to manage future growth effectively as we rapidly grow, especially
internationally; the unavailability, reduction or elimination of government and economic incentives for electric vehicles and energy
products or the increase or imposition of import tariffs or duties on such products; Tesla’s ability to establish, maintain and strengthen
its relationships with strategic partners such as Panasonic; maintaining Gigafactory 1 and Gigafactory 2 implementation schedules,
output and cost estimates; and Tesla’s ability to execute on its strategy for new store, delivery hub, service centers, mobile service and
body shops, Supercharger and other locations and capabilities. More information on potential factors that could affect our financial
results is included from time to time in our Securities and Exchange Commission filings and reports, including the risks identified under
the section captioned “Risk Factors” in our annual report on Form 10-K filed with the SEC on February 23, 2018. Tesla disclaims any
obligation to update information contained in these forward-looking statements whether as a result of new information, future events, or
otherwise.
Investor Relations Contact: Press Contact:
Martin Viecha Dave Arnold
Investor Relations Communications
ir@tesla.com press@tesla.comTesla, Inc.
Condensed Consolidated Statements of Operations
(Unaudited)
(In thousands, except per share data)
Three Months Ended
March 31, December 31, March 31,
2018 2017 2017
Revenues
Automotive sales $ 2,561,881 $ 2,409,109 $ 2,035,060
Automotive leasing 173,436 293,086 254,540
Total automotive revenue 2,735,317 2,702,195 2,289,600
Energy generation and storage 410,022 298,037 213,944
Services and other 263,412 288,017 192,726
Total revenues 3,408,751 3,288,249 2,696,270
Cost of revenues
Automotive sales 2,091,397 1,999,631 1,496,649
Automotive leasing 104,496 191,541 166,026
Total automotive cost of revenues 2,195,893 2,191,172 1,662,675
Energy generation and storage 375,363 281,715 151,773
Services and other 380,969 376,576 213,876
Total cost of revenues 2,952,225 2,849,463 2,028,324
Gross profit 456,526 438,786 667,946
Operating expenses
Research and development 367,096 354,637 322,040
Selling, general and administrative 686,404 682,290 603,455
Total operating expenses 1,053,500 1,036,927 925,495
Loss from operations (596,974 ) (598,141 ) (257,549 )
Interest income 5,214 6,280 3,090
Interest expense (149,546 ) (146,363 ) (99,346 )
Other (expense) income, net (37,716 ) (41,677 ) (18,098 )
Loss before income taxes (779,022 ) (779,901 ) (371,903 )
(Benefit) provision for income taxes 5,605 (9,094 ) 25,278
Net loss (784,627 ) (770,807 ) (397,181 )
Net loss attributable to noncontrolling interests
and redeemable noncontrolling interests (75,076 ) (95,457 ) (66,904 )
Net loss attributable to common
stockholders $ (709,551 ) $ (675,350 ) $ (330,277 )
Net loss per share of common stock
attributable to common stockholders –
basic and diluted $ (4.19 ) $ (4.01 ) $ (2.04 )
Weighted average shares used in computing
net loss per share of common stock –
basic and diluted 169,146 168,314 162,129Tesla, Inc.
Condensed Consolidated Balance Sheets
(Unaudited)
(In thousands)
March 31, December 31,
2018 2017
Assets
Current assets
Cash and cash equivalents $ 2,665,673 $ 3,367,914
Restricted cash 120,194 155,323
Accounts receivable, net 652,848 515,381
Inventory 2,565,826 2,263,537
Prepaid expenses and other current assets 379,379 268,365
Total current assets 6,383,920 6,570,520
Operating lease vehicles, net 2,315,124 4,116,604
Solar energy systems, leased and to be leased, net 6,346,374 6,347,490
Property, plant and equipment, net 10,519,226 10,027,522
Goodwill and intangible assets, net 407,712 421,739
MyPower customer notes receivable, net of current portion 449,754 456,652
Restricted cash, net of current portion 433,841 441,722
Other assets 415,478 273,123
Total assets $ 27,271,429 $ 28,655,372
Liabilities and Equity
Current liabilities
Accounts payable $ 2,603,498 $ 2,390,250
Accrued liabilities and other 1,898,431 1,731,366
Deferred revenue 536,465 1,015,253
Resale value guarantees 629,112 787,333
Customer deposits 984,823 853,919
Current portion of long-term debt and capital leases (1) 1,998,030 896,549
Total current liabilities 8,650,359 7,674,670
Long-term debt and capital leases, net of current portion (1) 8,763,726 9,418,319
Deferred revenue, net of current portion 818,250 1,177,799
Resale value guarantees, net of current portion 756,800 2,309,222
Other long-term liabilities 2,561,886 2,442,970
Total liabilities 21,551,021 23,022,980
Redeemable noncontrolling interests in subsidiaries 405,835 397,734
Convertible senior notes (1)(2) 2 70
Total stockholders' equity 4,450,695 4,237,242
Noncontrolling interests in subsidiaries 863,876 997,346
Total liabilities and equity $ 27,271,429 $ 28,655,372
(1) Breakdown of our debt is as follows:
Recourse debt $ 6,947,764 $ 6,755,376
Non-recourse debt $ 3,027,447 $ 2,873,458
(2) As of March 31, 2018, our common stock price exceeded the conversion threshold price of our convertible senior notes due in
2018 (2018 Notes) issued in May 2013; therefore, the 2018 Notes were convertible at the holder’s option. As such, the carrying
value of the 2018 Notes was classified as a current liability and the difference between the principal amount and the carrying value
of the 2018 Notes was reflected as convertible debt in mezzanine equity, on our condensed consolidated balance sheet as of
March 31, 2018.Tesla, Inc.
Condensed Consolidated Statement of Cash Flows
(Unaudited)
(In thousands)
Supplemental Consolidated Financial Information
Three Months Ended
March 31, December 31, March 31,
2018 2017 2017
Cash Flows from Operating Activities
Net loss $ (784,627 ) $ (770,807 ) $ (397,181 )
Adjustments to reconcile net loss to net
cash provided by (used in) operating activities:
Depreciation and amortization 416,233 469,606 376,602
Stock-based compensation 141,639 134,348 103,717
Losses related to the SolarCity
acquisition — 27,950 11,571
Other 153,805 151,756 98,260
Changes in operating assets and liabilities,
net of effect of business combinations (325,426 ) 497,038 (262,780 )
Net cash (used in) provided by
operating activities (398,376 ) 509,891 (69,811 )
Cash Flows from Investing Activities
Capital expenditures (655,662 ) (786,688 ) (552,624 )
Payments for the cost of solar energy systems,
leased and to be leased (72,975 ) (119,455 ) (219,948 )
Business combinations, net of cash acquired — (5,376 ) (109,147 )
Net cash used in investing activities (728,637 ) (911,519 ) (881,719 )
Cash Flows from Financing Activities
Net cash flows from debt activities 172,865 28,056 803,838
Collateralized lease (repayments) borrowings (87,092 ) 94,894 186,355
Net borrowings under Warehouse
Agreements and automotive asset-backed notes 174,028 116,820 54,709
Net cash flows from noncontrolling interests - Auto 24,599 31,763 —
Net cash flows from noncontrolling interests - Solar (6,758 ) (5,479 ) 78,307
Proceeds from issuances of common stock
in public offerings — — 400,175
Other 94,018 19,788 75,365
Net cash provided by
financing activities 371,660 285,842 1,598,749
Effect of exchange rate changes on
cash and cash equivalents and
restricted cash 10,102 3,990 11,643
Net (decrease) increase in cash and
cash equivalents and restricted cash (745,251 ) (111,796 ) 658,862
Cash and cash equivalents and restricted cash
at beginning of period 3,964,959 4,076,755 3,766,900
Cash and cash equivalents and restricted cash
at end of period $ 3,219,708 $ 3,964,959 $ 4,425,762Tesla, Inc.
Reconciliation of GAAP to Non-GAAP Financial Information
(Unaudited)
(In thousands, except per share data)
Three Months Ended
March 31, December 31, March 31,
2018 2017 2017
Automotive gross profit – GAAP $ 539,424 $ 511,023 $ 626,925
Stock-based compensation expense
in automotive cost of revenue 15,078 16,182 10,031
ZEV credit revenue recognized (50,314 ) (179,142 ) —
Automotive gross profit excluding SBC and
ZEV credit – non-GAAP $ 504,188 $ 348,063 $ 636,956
Automotive gross margin – GAAP 19.7 % 18.9 % 27.4 %
Stock-based compensation expense 0.6 % 0.6 % 0.4 %
ZEV credit revenue recognized -1.5 % -5.7 % 0.0 %
Automotive gross margin excluding SBC
and ZEV credit – non-GAAP 18.8 % 13.8 % 27.8 %
Net loss attributable to common
stockholders – GAAP $ (709,551 ) $ (675,350 ) $ (330,277 )
Stock-based compensation expense 141,639 134,348 103,717
Losses related to the SolarCity
acquisition — 27,950 11,571
Net loss attributable to common
stockholders – non-GAAP $ (567,912 ) $ (513,052 ) $ (214,989 )
Net loss per share attributable to
common stockholders, basic and
diluted – GAAP $ (4.19 ) $ (4.01 ) $ (2.04 )
Stock-based compensation expense 0.84 0.80 0.64
Losses related to the SolarCity
acquisition — 0.17 0.07
Net loss income per share attributable to
common stockholders, basic and
diluted – non-GAAP $ (3.35 ) $ (3.04 ) $ (1.33 )
Shares used in per share calculation,
basic and diluted – GAAP and non-GAAP 169,146 168,314 162,129You can also read