Spatiotemporal Distribution of Hand, Foot, and Mouth Disease in Guangdong Province, China and Potential Predictors, 2009-2012 - MDPI
←
→
Page content transcription
If your browser does not render page correctly, please read the page content below
International Journal of
           Environmental Research
           and Public Health

Article
Spatiotemporal Distribution of Hand, Foot, and
Mouth Disease in Guangdong Province, China and
Potential Predictors, 2009–2012
Yijing Wang 1 , Yingsi Lai 1,2 , Zhicheng Du 1,3 , Wangjian Zhang 4 , Chenyang Feng 1 , Ruixue Li 1
and Yuantao Hao 1,2,3, *
 1    Department of Medical Statistic and Epidemiology, School of Public Health, Sun Yat-sen University,
      74 Zhong Shan 2nd Road, Guangzhou 510080, China; wangyj77@mail2.sysu.edu.cn (Y.W.);
      laiys3@mail.sysu.edu.cn (Y.L.); duzhch3@mail2.sysu.edu.cn (Z.D.); fengchy3@mail2.sysu.edu.cn (C.F.);
      lirx6@mail2.sysu.edu.cn (R.L.)
 2    Sun Yat-sen Global Health Institute, Sun Yat-sen University, 135 Xin Gang Xi Road, Guangzhou 510275,
      China
 3    Key Laboratory of Tropical Diseases and Control of the Ministry of Education, Guangzhou 510080, China
 4    Department of Environmental Health Sciences, School of Public Health, University at Albany,
      State University of New York, Rensselaer, NY 12144, USA; wzhang27@albany.edu
 *    Correspondence: haoyt@mail.sysu.edu.cn; Tel.: +86-020-8733-1587

 Received: 15 January 2019; Accepted: 26 March 2019; Published: 3 April 2019

 Abstract: Background: Hand, foot, and mouth disease (HFMD) is a common infectious disease among
 children. Guangdong Province is one of the most severely affected provinces in south China. This
 study aims to identify the spatiotemporal distribution characteristics and potential predictors of
 HFMD in Guangdong Province and provide a theoretical basis for the disease control and prevention.
 Methods: Case-based HFMD surveillance data from 2009 to 2012 was obtained from the China
 Center for Disease Control and Prevention (China CDC). The Bayesian spatiotemporal model was
 used to evaluate the spatiotemporal variations of HFMD and identify the potential association with
 meteorological and socioeconomic factors. Results: Spatially, areas with higher relative risk (RR) of
 HFMD tended to be clustered around the Pearl River Delta region (the mid-east of the province).
 Temporally, we observed that the risk of HFMD peaked from April to July and October to December
 each year and detected an upward trend between 2009 and 2012. There was positive nonlinear
 enhancement between spatial and temporal effects, and the distribution of relative risk in space
 was not fixed, which had an irregular fluctuating trend in each month. The risk of HFMD was
 significantly associated with monthly average relative humidity (RR: 1.015, 95% CI: 1.006–1.024),
 monthly average temperature (RR: 1.045, 95% CI: 1.021–1.069), and monthly average rainfall (RR:
 1.004, 95% CI: 1.001–1.008), but not significantly associated with average GDP. Conclusions: The risk
 of HFMD in Guangdong showed significant spatiotemporal heterogeneity. There was spatiotemporal
 interaction in the relative risk of HFMD. Adding a spatiotemporal interaction term could well explain
 the change of spatial effect with time, thus increasing the goodness of fit of the model. Meteorological
 factors, such as monthly average relative humidity, monthly average temperature, and monthly
 average rainfall, might be the driving factors of HFMD.

 Keywords: hand, foot, and mouth disease; Bayesian spatiotemporal models; spatiotemporal analysis;
 spatiotemporal interaction; potential predictors

Int. J. Environ. Res. Public Health 2019, 16, 1191; doi:10.3390/ijerph16071191   www.mdpi.com/journal/ijerph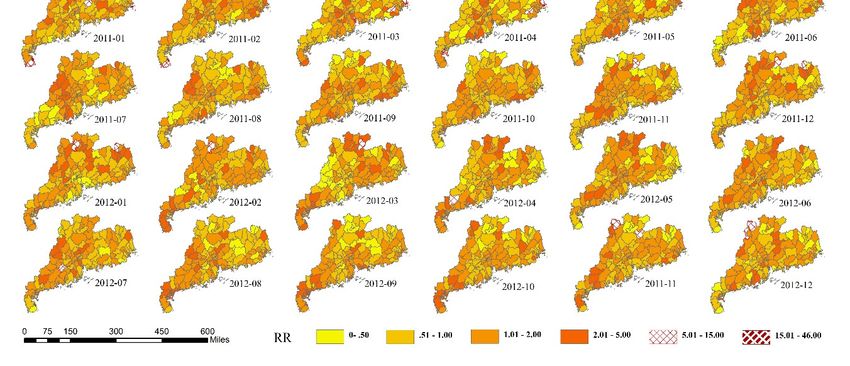
Int. J. Environ. Res. Public Health 2019, 16, 1191                                                2 of 13

1. Introduction
      Hand, foot, and mouth disease (HFMD), primarily caused by Enterovirus 71 (EV71) and
Coxsackievirus A16 (Cox A16) [1], is a common infectious disease among children [2]. HFMD
is typically characterized by fever, skin eruptions on hands, feet, buttocks, and vesicles/ulcers in
the mouth. It can be transmitted through various routes, including direct contact with fluid from
blisters, and inhaling the virus through the respiratory tract [3]. HFMD epidemics have been reported
worldwide, such as in Singapore [4], Vietnam [5], Hong Kong [6], and Japan [7]. China is one
of the most severely affected countries. The overview of the national notifiable infectious disease
epidemic in China showed that the HFMD incidence in 2017 ranked the first, followed by hepatitis
and tuberculosis [8]. Through 2008 to 2012, at least 6.5 million pediatric cases of HFMD were recorded,
of which more than 2000 died [9]. The situation seems worse in Guangdong Province where the
provincial incidence was 3–4 times higher than the national average [10,11]. Although the EV 71
vaccine has been available since 2016, the HFMD epidemic remains urgent.
      Previous studies have demonstrated geographical and temporal variations of HFMD across China.
In China, the incidence of HFMD varies in different provinces. In 2013, the incidence was reported to
be 67.90/100,000 in Sichuan Province [12], while it was 100/100,000 in Chongqing city [3]. Even in the
same province, the incidence rate also varied across counties [13,14]. Different seasonality of HFMD
appears. In Hong Kong, a seasonal peak was detected in the warmer months (May–July), along with a
smaller winter peak (October–December) [15]. Whereas in Beijing, the seasonal peak occurred in May
to July every year [13]. The peaks had slight differences among different regions.
      Prior studies suggested that meteorological factors such as temperature and relative humidity
might be important predictors for HFMD, with higher temperature or higher relative humidity
associated with higher risk of HFMD [12,13,16]. In addition, other meteorological factors, such as
rainfall, wind speed, and sunshine duration, also appeared to influence HFMD transmission [13,17].
Socioeconomic variables may also be associated with HFMD incidence. A study in Sichuan showed
that HFMD incidence was higher in urban areas compared to rural areas and per capita gross domestic
product (GDP) was a risk factor associated with HFMD incidence [12]. Although the potential
associations between the risk of HFMD and meteorological/socioeconomic factors were reported
previously, the findings might be not applicable to Guangdong due to the spatial differential.
      It is necessary to conduct a comprehensive analysis of HFMD, including the effects of space-time
and potential predictors. However, most of the prior studies only focused on the potential predictors
or the cluster analysis [3,18–20]. Few studies can be conducted in the perspective of spatiotemporal
interaction, taking into account the potential predictors, as well as the spatiotemporal dynamic change
of HFMD.
      The Bayesian spatiotemporal model we used includes the spatiotemporal effects to the generalized
additive model to identify spatiotemporal variations and the effects of potential predictors at the same
time [21]. This approach can also control uncertainties resulted from residual confounding, i.e.,
confounding that is not included in the model, by incorporating spatial and temporal random terms.
      Therefore, this study aims to analyze the spatiotemporal distribution and potential predictors of
HFMD in Guangdong Province after controlling multiple factors, including spatial effect, temporal
effect, spatiotemporal interaction effect, and potential predictors, and provide information and
theoretical basis for the disease control and prevention.

2. Materials and Methods

2.1. Study Area
     Guangdong Province, a large coastal province in south China, has an area of 179,800 km2 and a
population of 106 million (from the 2013 China Statistical Yearbook). There were 21 administrative
districts, comprising of 123 counties in Guangdong Province. We used the county level division as the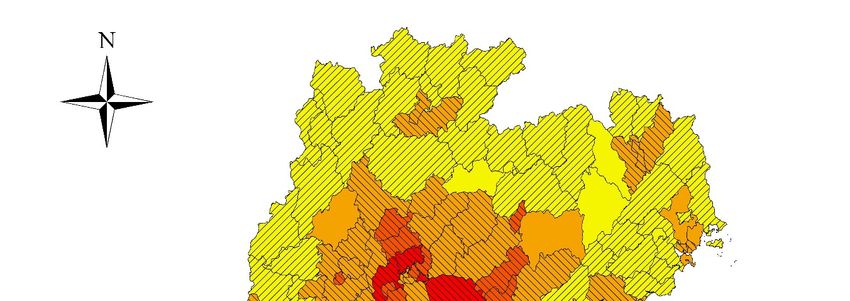
Int.Int. J. Environ.
     J. Environ.  Res.Res. Public
                       Public     Health
                              Health       16, 16,
                                         2019,
                                     2019,     x 1191                                                             3 of3 14
                                                                                                                        of 13

the geographical unit for this spatiotemporal analysis because the county administrative level was
  geographical unit for this spatiotemporal analysis because the county administrative level was often
often used for governmental statistics.
  used for governmental statistics.
     According to the characteristics of the natural landscape and economic development,
       According to the characteristics of the natural landscape and economic development, Guangdong
Guangdong Province can be divided into two or four parts: the Pearl River Delta region (including
  Province can be divided into two or four parts: the Pearl River Delta region (including the capital city
the capital city Guangzhou) and the non-Pearl River Delta region; or the Pearl River Delta region,
  Guangzhou) and the non-Pearl River Delta region; or the Pearl River Delta region, eastern Guangdong
eastern Guangdong region, western Guangdong region, and northern Guangdong, as shown in
  region, western Guangdong region, and northern Guangdong, as shown in Figure 1. The Pearl River
Figure 1. The Pearl River Delta region has a much higher level of socioeconomic development,
  Delta region has a much higher level of socioeconomic development, accounting for 80% GDP of the
accounting for 80% GDP of the whole province with less than 50% population [10].
  whole province with less than 50% population [10].

        Figure 1. The four parts of Guangdong Province and cumulative incidence of hand, foot, and mouth
      Figure 1. The four parts of Guangdong Province and cumulative incidence of hand, foot, and mouth
        disease (HFMD), 2009–2012.
      disease (HFMD), 2009–2012.
   2.2. Surveillance Data of HFMD
2.2. Surveillance Data of HFMD
         Case-based HFMD surveillance data from 2009 to 2012 was obtained from the China Center for
      Case-based
   Disease   Control HFMD     surveillance
                        and Prevention       data CDC).
                                         (China     from 2009
                                                            It wasto confidential
                                                                     2012 was obtained      from
                                                                                    data; raw     thecannot
                                                                                               data   ChinabeCenter   for
                                                                                                               published
Disease
   due toControl
            state lawandand
                          Prevention   (China
                             ethics. The         CDC).
                                            clinical     It was for
                                                       criteria   confidential
                                                                      diagnosisdata;    raw data
                                                                                   of HFMD         cannot
                                                                                               cases  wasbe  published
                                                                                                           provided     in a
due   to state law
   guidebook           and ethics.
                 published   by theThe   clinical
                                     Ministry    of criteria
                                                     Health of forChina
                                                                   diagnosis    of [22],
                                                                          in 2008   HFMD     cases patients
                                                                                         in which   was provided    in a
                                                                                                            were defined
guidebook
   as HFMDpublished        by the Ministry
                with the occurrence          of following
                                        of the  Health of China     in 2008fever,
                                                             symptoms:       [22], in which and
                                                                                    papules   patients werelesions
                                                                                                  herpetic   definedonasthe
HFMD
   handswith    therashes
           or feet,   occurrence
                            on theof  the following
                                    buttocks   or knees,symptoms:
                                                           inflammatory fever,  papules
                                                                             flushing     and herpetic
                                                                                       around           lesions
                                                                                                the rashes       on the
                                                                                                           and little  fluid
hands
   in theorblisters,
            feet, rashes
                     sparseonherpetic
                               the buttocks
                                       lesionsoronknees,    inflammatory flushing around the rashes and little
                                                     oral mucosa.
fluid in the blisters, sparse herpetic lesions on oral mucosa.
   2.3. Potential Predictors Data
2.3. Potential
         MonthlyPredictors
                     averageData
                              relative humidity, the monthly average temperature, monthly average rainfall,
  monthly
     Monthlyaverage wind
              average     speed,
                      relative     and monthly
                               humidity,          sunshine
                                           the monthly       duration
                                                         average       data were
                                                                  temperature,   obtained
                                                                                monthly    from the
                                                                                        average      China
                                                                                                 rainfall,
  Meteorological
monthly           Data speed,
          average wind  SharingandService   System
                                      monthly        (http://data.cma.cn/).
                                                sunshine                        The monthly
                                                          duration data were obtained    from county-level
                                                                                               the China
  meteorologicalData
Meteorological    variables  were
                       Sharing       estimated
                                 Service   Systemusing  ordinary spatial kriging
                                                     (http://data.cma.cn/).        methodscounty-level
                                                                             The monthly      based on 26
  meteorologicalvariables
meteorological   surveillance
                           werestations  withinusing
                                  estimated     Guangdong
                                                      ordinaryProvince.
                                                                 spatial The 26 meteorological
                                                                         kriging methods based surveillance
                                                                                                   on 26
meteorological surveillance stations within Guangdong Province. The 26 meteorological surveillance
stations are mapped in Figure 2. In addition, we obtained population and socioeconomic data, i.e.,
average GDP, from the statistical yearbook.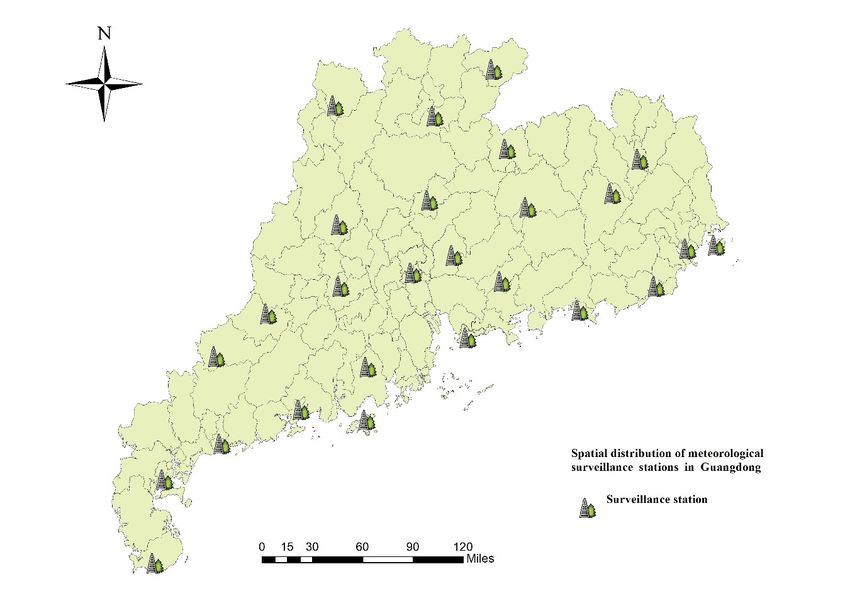
Int. J. Environ. Res. Public Health 2019, 16, 1191 4 of 13
stations are mapped in Figure 2. In addition, we obtained population and socioeconomic data, i.e.,
Int. J. Environ.
average GDP,Res. Public
from theHealth 2019, 16,yearbook.
statistical x 4 of 14
Figure 2. Spatial distribution of meteorological surveillance stations in Guangdong Province.
Figure 2. Spatial distribution of meteorological surveillance stations in Guangdong Province.
2.4. Statistical Methods
2.4. Statistical Methods
2.4.1. Bayesian Spatiotemporal Model
2.4.1.
TheBayesian Spatiotemporal
Bayesian Model
spatiotemporal model was used to analyze the relative risk (RR) of HFMD from
2009 to
The2012. The form
Bayesian of the model model
spatiotemporal was specified
was usedas the following:
to analyze the relative risk (RR) of HFMD from
2009 to 2012. The form of the model was specified as the following:
Yij ∼ Poisson(λij )
Y Poisson(λij )
E(Yij )ij = λij = eij × θij (1)
E (Yij ) = λij = eij × θij
log(θij ) = b0 + ∑ β p X pij + µi + υi + γ j + ϕ j + δij (1)
log(θij ) = b0 +p β p X pij + μi + υi + γ j + ϕ j + δ ij
p
where Yij was the number of reported HFMD cases in region i, month j (j = 2009-01, . . . , 2012-12).
where
The Yij was
model the number
assumed that Yijofwas
reported
subjectHFMD region i , month
cases indistribution
to a Poisson
j j =2009-01,…,2012-12).
with a (mean λij = eij × θij , where The
eijmodel assumed
represented the that Yij wasnumber
expected subjectoftoHFMD
a Poisson
cases,distribution with a mean
which was calculated λij product
as the = eij × θij ,ofwhere
overalleij
incidence
represented of the
theprovince
expectedand the population
number of HFMD for each
cases, county
which wasduring the study
calculated as theperiod, and
product ij was
ofθoverall
the RR. b0 of
incidence was
thethe
province andXthe
intercept, was the pthfor
pij population meteorological or socioeconomic
each county during variable
the study period, andinθij was
regionthe
i,RR.
month j, was the regression coefficient. We calculated the variance inflation factor
p intercept, X was the p meteorological or socioeconomic variable in region i , month
b0 was the
β (VIF) for
pij th
all candidate variables to assess the multicollinearity; variables with VIF less than 5 were selected
j , β p was the regression coefficient. We calculated the variance inflation factor (VIF) for all candidate
for inclusion in the model [23]. The Besag, York, and Mollie (BYM) model was used to model the
variablesspatial
common to assess the multicollinearity;
component variables of
[24], which consisted with
twoVIF less than 5 spatially
components: were selected for inclusion
structured randomin
the model [23]. The Besag, York, and Mollie (BYM) model was used to model the common
effect µi and spatially unstructured random effect υi . µi was commonly assumed to follow a conditional spatial
component [24], which consisted of two components: spatially structured random
autoregressive prior structure (CAR) in infectious diseases spatial epidemiology [25–27], which showed effect μi and
spatially
that countyunstructured
i had a similar random
pattern ofeffect υi incidence
disease . μi was with
commonly assumed
the adjacent to follow
counties. a conditional
υi was assumed to be
autoregressive prior structure (CAR) in infectious diseases spatial epidemiology [25–27], which
showed that county i had a similar pattern of disease incidence with the adjacent counties. υi was
assumed to be a normal distribution, representing that county i had an independent pattern of
disease incidence from the adjacent counties. If a disease has a strong spatial autocorrelation, the
spatially structured random effect μi will have more contribution explaining the spatial variance of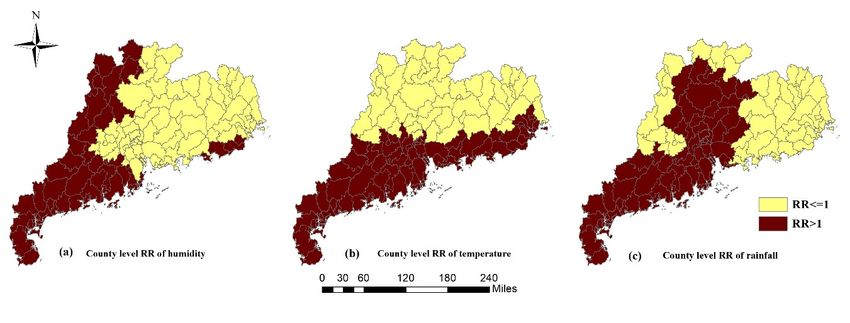
Int. J. Environ. Res. Public Health 2019, 16, 1191                                                           5 of 13

a normal distribution, representing that county i had an independent pattern of disease incidence from
the adjacent counties. If a disease has a strong spatial autocorrelation, the spatially structured random
effect µi will have more contribution explaining the spatial variance of the disease risk; otherwise,
the component of the spatially unstructured random effect υi will have more explanatory power. The
temporal component was also consisted of two components: monthly structured random effect γ j and
monthly unstructured random effect ϕ j . γ j and ϕ j were assumed to follow a 1 order random walk
and a normal distribution, respectively [21,28,29]. δij was the spatiotemporal interaction term. The
structure matrix can be written as the Kronecker product of Rδ = Rυ ⊗ R ϕ , which assumed that the
spatially unstructured random effect υi and the monthly unstructured random effect ϕ j interact with
each other [21].
     We developed five different models. Model 1 only included potential predictors. Model 2 and
model 3 added a spatial component and a temporal component to model 1, respectively. Model 4 was
the combination of model 2 and model 3. Finally, model 5 included all the components, including
potential predictors, spatial, temporal, and spatiotemporal interaction components.
     The models were fitted using the integrated nested Laplace approximation (INLA) method
incorporated in the R-INLA package (R version 3.4.3., R Core Team, Vienna, Austria). The model with
the smallest deviance information criterion (DIC) was considered the optimal and used for our study.

2.4.2. Geographical Detectors
     In this study, the q-statistic was used to quantify the spatiotemporal heterogeneity of HFMD and
detect the interaction relationship between spatial effect and temporal effect [30,31]. The form of the
q-statistic was specified as the following:

                                                               1 L
                                                              Nσ2 h∑
                                                     q = 1−           Nh σh2                                    (2)
                                                                   =1

where q denotes the level of spatiotemporal heterogeneity; the value of the statistic is required to be
within [0, 1]. If the value approaches 1, it indicates a strong heterogeneity and if the value approaches
0, it indicates a random distribution. N was the number of all units, which could be divided into L
stratums. Stratum h was composed of Nh units. σ2 and σh2 were the variance over all the units and
within stratum h (h = 1, . . . , L), respectively.
       We can divide the units of observation into two stratums, space LS (LS = 1, . . . , 21) and time L T
(L T = 1, . . . , 48). If q( LS ∩ L T ) > q( LS ) + q( L T ), there is a nonlinear enhancement of space and time, if
q( LS ∩ L T ) < Min(q( LS ), q( L T )), there is a nonlinear weakening of them [31].

3. Results

3.1. Descriptive Statistics
     Overall, 911,640 HFMD cases were reported in Guangdong Province from 2009 to 2012, and
the annual average incidences from 2009 to 2012 were 10.36/10,000, 24.52/10,000, 28.21/10,000, and
35.26/10,000, respectively. Spatial distribution of cumulative incidence of HFMD at county level
during the study period is shown in Figure 1. Counties with a higher HFMD incidence were clustered
in the Pearl River Delta region. A descriptive summary of the meteorological and socioeconomic
variables is shown in Table 1.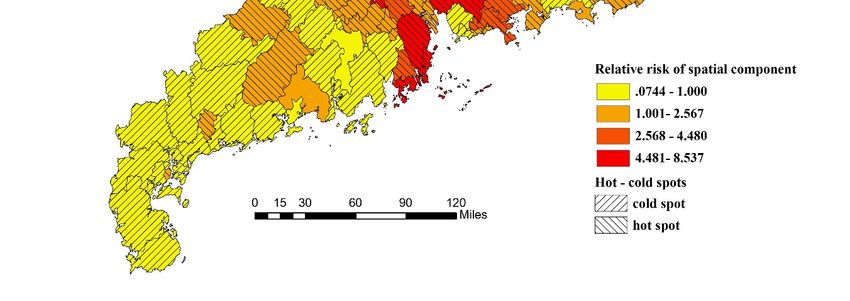
Int. J. Environ. Res. Public Health 2019, 16, 1191                                                                            6 of 13

                     Table 1. Descriptive statistics of meteorological and socioeconomic variables.

            Covariates                  Minimum         2.5% Percentile          Median        97.5% Percentile         Maximum
 Average relative humidity (%)             54.10               59.25              76.53               85.83                91.56
  Average temperature (◦ C)                 4.79               10.47              23.01               29.18                29.65
    Average rainfall (mm)                     0                 1.66              98.76              410.11               645.50
   Sunshine duration (hour)                18.91               38.05              149.18             253.48               303.47
  Average wind speed (m/s)                  1.25                1.53               2.10                3.38                 5.33
     Average GDP (yuan)                    5717                9981               26,370            110,421              123,247

3.2. Model Selection
      Table 2 shows the results of the multicollinearity analysis. The VIF values of all variables were
less than 5, so it could be considered that there was no multicollinearity between the variables, and all
variables were included in the model.

                      Table 2. Multicollinearity evaluation results. VIF: variance inflation factor.

                       Covariates                      VIF                       Covariates                     VIF
           Average relative humidity (%)               2.305            Sunshine duration (hour)                3.126
            Average temperature (◦ C)                  3.827           Average wind speed (m/s)                 1.091
              Average rainfall (mm)                    2.129              Average GDP (yuan)                    1.025

   Table 3 summarizes the DIC values for the five types of models. Model 5 was selected as the final
model as it had the lowest DIC value. Further results were all based on model 5.

                     Table 3. The results of model selection. DIC: deviance information criterion.

                           Model                                             Component                                  DIC

    1          Non-spatiotemporal model                             log(θij ) = b0 + ∑ β p X pij                   1,083,638.0
                                                                                       p
    2                  Spatial model                           log(θij ) = b0 + ∑ β p X pij + µi + υi               422,115.3
                                                                                  p
    3                Temporal model                            log(θij ) = b0 + ∑ β p X pij + γ j + ϕ j             816,474.6
                                                                                 p
    4             Spatiotemporal model                 log(θij ) = b0 + ∑ β p X pij + µi + υi + γ j + ϕ j           202,885.9
                                                                             p
    5      Spatiotemporal interaction model          log(θij ) = b0 + ∑ β p X pij + µi + υi + γ j + ϕ j + δij         45,036.5
                                                                         p

3.3. Spatial Distribution
     The estimated RR values of the spatial effect (µi + υi ) are mapped in Figure 3. The spatial
distribution of HFMD risk exhibited explicit spatial heterogeneity, as the q-statistic was 0.669 (p < 0.001).
The RR values were relatively high in the Pearl River Delta region of Guangdong Province. This
finding implied that the counties in the Pearl River Delta region had a relatively higher HFMD risk.
     If a county had a stable higher or lower risk compared with the overall level in the region, it
was classified as a hot spot or a cold spot, respectively [32]. This classification can make the spatial
distribution of RR more intuitive. Hot and cold spots can be calculated according to the posterior
probability of spatial effect—if the posterior probability P(exp(µi + υi ) > 1|data) > 0.8 , then the
county i was classified as a hot spot. Similarly, if the posterior probability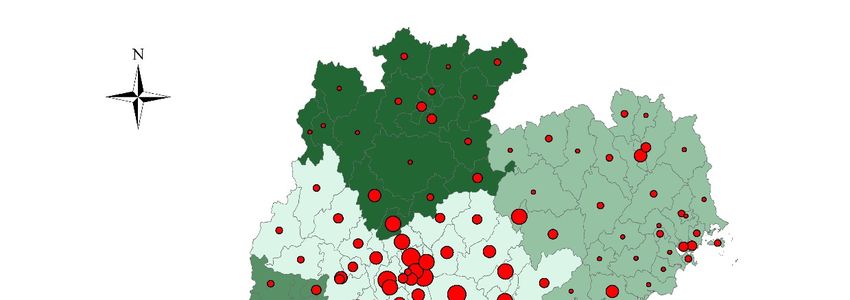
Int.J.J.Environ.
Int.      Environ.Res.
                   Res.Public
                        PublicHealth
                               Health2019,  16,x1191
                                      2019,16,                                                                 77of
                                                                                                                  of14
                                                                                                                     13

               Figure 3. Relative risk (RR) values of the spatial effect and distribution of hot–cold spots.
              Figure 3. Relative risk (RR) values of the spatial effect and distribution of hot–cold spots.
 3.4. Temporal Distribution
      If a county had a stable higher or lower risk compared with the overall level in the region, it was
       The yearly and monthly numbers of cases are shown in Figure 4a,b, respectively. It was
classified as a hot spot or a cold spot, respectively [32]. This classification can make the spatial
 noteworthy that the incidence of HFMD had an increasing trend. Besides, seasonal peaks were
distribution of RR more intuitive. Hot and cold spots can be calculated according to the posterior
 detected around May and October.
probability of spatial effect—if the posterior probability P(exp ( μi + υi ) > 1 | data ) > 0.8 , then the county
       The RR of monthly effect (γ j + ϕ j ) is shown in Figure 4c. We detected an upward trend in RR
ibetween
  was classified
             2009 and as 2012.
                         a hot The
                                 spot.RR  Similarly, if the
                                            of monthly       posterior
                                                          effect         probability
                                                                  presented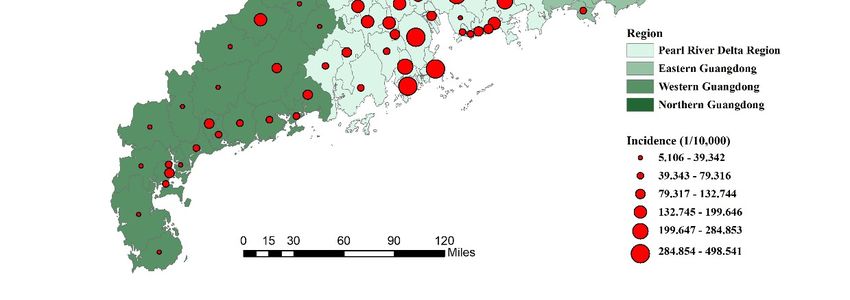
Int. J. Environ. Res. Public Health 2019, 16, 1191                                                                 8 of 13
 Int. J. Environ. Res. Public Health 2019, 16, x                                                                 8 of 14

       Figure4.4. Annual
      Figure      Annual number
                         number of cases of HFMD
                                               HFMD (a),
                                                       (a), monthly
                                                            monthly distribution
                                                                    distributionof
                                                                                 ofHFMD
                                                                                   HFMDcases
                                                                                        cases(b),
                                                                                              (b),and
                                                                                                   andRR
                                                                                                       RR
       valuesof
      values  ofmonthly
                  monthlyeffect
                         effect (c)
                                 (c) in
                                      in Guangdong,
                                         Guangdong, 2009–2012.

                                ( γ j4.+ Heterogeneity
                             Table
       The RR of monthly effect          ϕ j ) is shown detection
                                                        in Figurewith q-statistic.
                                                                  4c. We   detected an upward trend in RR
 between
   Data 2009 q and 2012.
                     p TheData
                             RR of monthly
                                       q     effect
                                               p presented
                                                      Data   significant
                                                                q        seasonality.
                                                                         p       Data Semiannual
                                                                                            q       peaks
                                                                                                     p
 were  observed
  2009-01  0.122 during
                   0.856 the study period.
                           2010-01   0.179   The
                                             0.663peaks occurred
                                                     2011-01  0.145from0.771
                                                                         April to  July, and
                                                                                2012-01   0.321October
                                                                                                  0.013 *to
  2009-02
 December  0.292   0.095 with
           in each year,   2010-02   0.296
                              the first      0.221 than
                                        peak higher  2011-02  0.238
                                                         the second.   0.302    2011-02   0.191    0.507
   2009-03    0.336   0.022 * 2010-03      0.366       0.058   2011-03    0.089     0.980    2011-03    0.409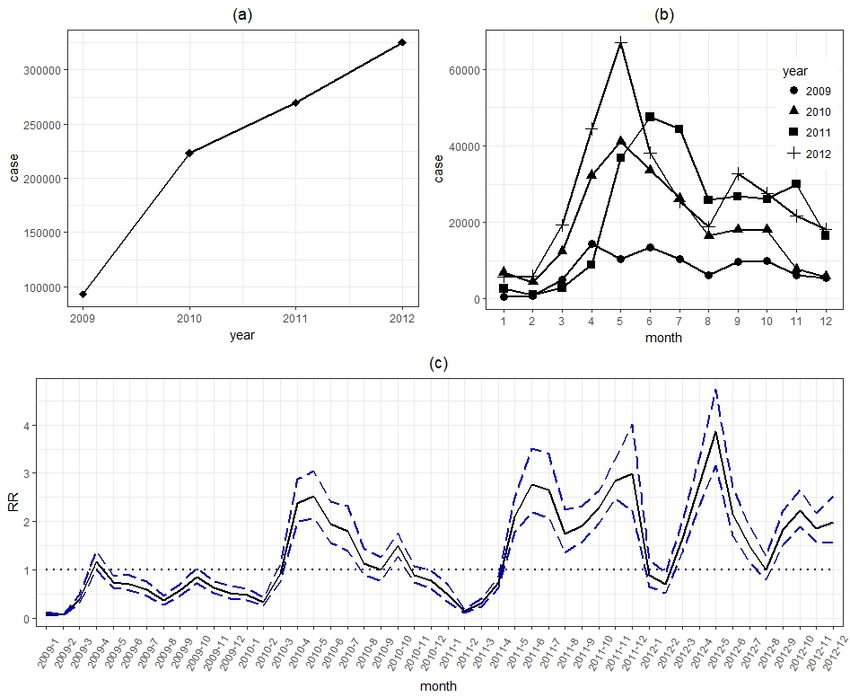
Int. J. Environ. Res. Public Health 2019, 16, 1191 9 of 13
Int. J. Environ. Res. Public Health 2019, 16, x 9 of 14
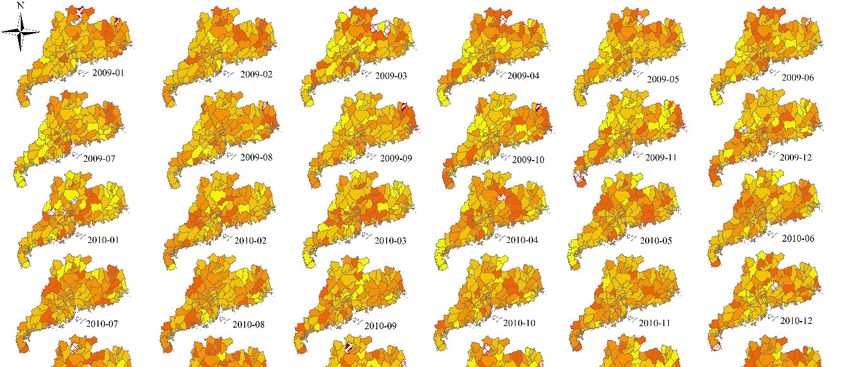
Figure 5. RR values of the spatiotemporal interaction effect.
Figure 5. RR values of the spatiotemporal interaction effect.
3.6. Potential Predictors
Table 4. Heterogeneity detection with q-statistic.
The estimated results of regression coefficients of meteorological variables and socioeconomic
Data
variables (β pq) are shown
p in Data q
Table 5. There Data
waspa positive q
association p
between Data q variables
meteorological p
and relative risk. The increasing of one unit in the monthly average relative humidity, monthly*
2009-01 0.122 0.856 2010-01 0.179 0.663 2011-01 0.145 0.771 2012-01 0.321 0.013
2009-02 temperature,
average 0.292 0.095and2010-02
monthly 0.296
average 0.221 2011-02
rainfall was 0.238 with
associated 0.302 2011-02of 1.5%
the increase 0.191 (95%0.507
CI:
0.6%–2.4%), 4.5% (95% CI: 2.1%–6.9%), and 0.4% (95% CI: 0.1%–0.8%) in the RR of HFMD, respectively.*
2009-03 0.336 0.022 * 2010-03 0.366 0.058 2011-03 0.089 0.980 2011-03 0.409Intercept 0.054 (0.021, 0.138) 0.397 (0.359, 0.439)
Average relative humidity (%) 1.015 (1.006, 1.024) 1.102 (1.042, 1.166)
Average temperature (°C) 1.045 (1.021, 1.069) 1.291 (1.128, 1.476)
Average rainfall (cm) 1.004 (1.001, 1.008) 1.050 (1.008, 1.094)
Sunshine duration (10 hours) 0.997 (0.985, 1.009) 0.982 (0.915, 1.054)
Int. J. Environ. Res. Public
Average windHealth
speed2019, 16, 1191
(dm/s) 0.998 (0.990, 1.007) 0.991 (0.951, 1.032) 10 of 13
Average GDP (1000 yuan) 0.999 (0.994, 1.003) 0.961 (0.835, 1.105)
Figure 6 shows the county-level estimated RR values of associated potential predictors, which
Figure 6 shows the county-level estimated RR values of associated potential predictors, which
were the product terms of the regression coefficients of potential predictors and the average of the
were the product terms of the regression coefficients of potential predictors and the average of the
standardization values of potential predictors in each region. They represented the RR of HFMD
standardization values of potential predictors in each region. They represented the RR of HFMD
caused by potential predictors to each region. The western coast of Guangdong Province had a higher
caused by potential predictors to each region. The western coast of Guangdong Province had a higher
average relative humidity level, resulting in a higher RR, as shown in Figure 6a. The southern regions
average relative humidity level, resulting in a higher RR, as shown in Figure 6a. The southern regions
with higher temperatures and the southwestern regions with higher rainfall also had greater RR, as
with higher temperatures and the southwestern regions with higher rainfall also had greater RR, as
shown
shownininFigure
Figure6b,c.
6 b,c.
Figure 6. County-level estimated RR values of associated potential predictors.
Figure 6. County-level estimated RR values of associated potential predictors.
4. Discussion
4. Discussion
The present study explored the spatiotemporal distribution of HFMD and its associations with
The predictors.
potential present study The explored
results the spatiotemporal
revealed distribution
that the counties withofhigh
HFMD and its
relative associations
risk were mainly within
potential
the predictors.
Pearl River Delta, The
whichresults revealed
is the economic thatcenter
the counties with highThis
of Guangdong. relative riskwas
finding wereconsistent
mainly inwith the
Pearl River
previous Delta,
studies which
[3,17]. is the of
A study economic center of Guangdong.
Beijing–Tianjin–Hebei found that Thishigh
finding
risk was
regionsconsistent
were mainlywith
previous studies [3,17]. A study of Beijing–Tianjin–Hebei found that high risk
located in large cities, such as Beijing, Tianjin, Shijiazhuang, and their neighboring regions [17]. In regions were mainly
located in
addition, large cities,
a study such as Beijing,
in Chongqing found thatTianjin,
clusterShijiazhuang,
centers wereand theirmain
in nine neighboring regions[3].
urban districts [17]. In
addition,
During a study in Chongqing
the four-year studyfound
periodthat
from cluster
2009centers were
to 2012, in nine main
an increasing urban
trend of districts
relative [3].
risk was
During the four-year study period from 2009 to 2012, an increasing
detected. HFMD showed semiannual seasonality in Guangdong, which was also commonly observed trend of relative risk was
detected. HFMD showed semiannual seasonality in Guangdong, which was
in other southern provinces and regions in China, such as Jiangsu (peaks period: April to June, and also commonly observed
in other southern
November to December)provinces
[33], and regions (April
Chongqing in China, suchand
to July, as October
Jiangsu (peaks period:[3],
to December) April
andtoHong
June,Kong
and
November to December) [33], Chongqing (April to July, and October to
(May to July, and October to December) [15]. Meanwhile, a single peak has been shown to appear in December) [3], and Hong
Kong (May
northern China, to July,
suchand October
as Beijing to December)
(May to July) [13] [15].
andMeanwhile,
Shandong aProvince
single peak(Aprilhasandbeen shown[34].
August) to
appear in
Different northern
climates andChina, such as
living habits canBeijing (May reasons
be potential to July) for
[13]theand Shandong
different peak Province
months. For (April and
instance,
August) [34]. Different climates and living habits can be potential reasons for the different peak
the climate is warm and humid in southern China, while cold and dry in the north.
Temperature and relative humidity were associated with the relative risk of HFMD, with increased
relative risk of the disease following higher temperature and relative humidity. This was consistent
with the previous findings in Guangdong [10,35], Beijing [13], and Hong Kong [36]. Average rainfall
was also an important influence on HFMD transmission. It was generally consistent with other studies
conducted in Beijing and Henan [13,27]. According to previous studies, there are two potential ways
that meteorological factors influence HFMD—one is by affecting the survival and reproductive capacity
of enteroviruses [17], and another is by altering patterns of human behavior [37]. For example, Huang
et al. found that in hot and humid summers, outdoor activities were reduced, and people tended to
spend more time indoors in air-conditioned houses, thereby providing more opportunities for contact
with each other [35].
The confounders were controlled by adding the spatial and temporal components, which had
both effects on the number of reported HFMD cases and meteorological or socioeconomic variables.
Spatiotemporal effects represented the residual caused by latent variables that were not included inInt. J. Environ. Res. Public Health 2019, 16, 1191 11 of 13
the model, such as medical conditions and the capacity for HFMD prevention and control in different
counties and different periods, which are easier to control than meteorological factors. Thus, areas
and months with high relative risk should be paid more attention through the strategies including
strengthening the education and supervision of kindergartens.
Major prior studies used traditional models such as spatial autocorrelation and spatiotemporal
scan statistics [38]. Spatial autocorrelation cannot detect trends in the time, but just performs spatial
analysis. Spatiotemporal scan statistics is a simple and easy method, and it has been widely used
in public health. However, covariates cannot be included in the model and it is not suitable for a
risk region with an irregular shape. A Bayesian spatiotemporal model is more flexible in modelling
spatiotemporal components than the above models with some limitations.
This was a comprehensive study of HFMD in terms of spatiotemporal effects and meteorological
variables. We incorporated spatiotemporal effects in the regression that controlled uncertainties
resulting from residual confounding, which made the estimation of the impact of meteorological
variables more accurate. In addition, the hot spots and high-risk time of HFMD were identified.
Through the detection of spatiotemporal interaction, we found that the spatial effect of HFMD had
positive nonlinear enhancement with the temporal effect. After adding the spatiotemporal interaction
component to the model, the goodness of fit of the model was significantly increased. Compared with
the model without the interaction term (model 4), the DIC value was reduced by 77.8% to 45,036.5.
Therefore, adding the interaction component can improve the accuracy of the model—this has not
been considered in many previous related studies.
The present study has some limitations. First, we used the annual average GDP for each county
as the monthly data. Second, there were only 26 meteorological surveillance stations in Guangdong
Province; ordinary kriging interpolation results might not cover all variations of the meteorological
variables at the county level. However, this was more accurate than using the same meteorological
data to all counties in each city. Third, we estimated spatiotemporal variations in HFMD at the scale of
counties and months; we did not include the factors at an individual and pathogenic level, such as
personal hygiene, educational background, incomes of the children’s parents, living conditions, and
composition of major pathogens. Further studies should consider the potential impacts of these factors.
5. Conclusions
The risk of HFMD in Guangdong showed significant spatial heterogeneity, with higher relative
risk counties mainly gathered in the Pearl River Delta region. The relative risk of HFMD exhibited
an increasing trend and semiannual seasonality from 2009 to 2012. High relative risk areas and
months should be the focus of greater attention in the prevention and control of HFMD. There was
spatiotemporal interaction between HFMD relative risk. Adding a spatiotemporal interaction term
could well explain the change of spatial effect with time, thus increasing the goodness of fit of the model.
Meteorological factors, such as monthly average relative humidity, monthly average temperature, and
monthly average rainfall, might be the driving factors of HFMD.
Author Contributions: Conceptualization, Y.H. and Y.L.; Methodology and software, Y.W., C.F., and R.L.; Validation
and formal analysis, Y.W.; Data curation, Z.D.; Writing—original draft preparation, Y.W.; Writing—review and editing,
W.Z. and Z.D.; Visualization, Y.W.; Supervision, Y.H. and Y.L.; Project administration, Y.H.
Funding: This research was funded by the National Natural Science Foundation of China, grant number: 81473064
and 81773543.
Acknowledgments: The authors thank the China Center for Disease Control and Prevention for providing the
data of notified hand, foot, and mouth disease cases.
Conflicts of Interest: The authors declare no conflict of interest.
References
1. Goksugur, N.; Goksugur, S. Images in clinical medicine. Hand, foot, and mouth disease. N. Engl. J. Med.
2010, 362, e49. [CrossRef]Int. J. Environ. Res. Public Health 2019, 16, 1191 12 of 13
2. Wang, Y.; Feng, Z.; Yang, Y.; Self, S.; Gao, Y.; Longini, I.M.; Wakefield, J.; Zhang, J.; Wang, L.; Chen, X.; et al.
Hand, foot, and mouth disease in China: Patterns of spread and transmissibility. Epidemiology 2011, 22,
781–792. [CrossRef]
3. Qi, L.; Tang, W.; Zhao, H.; Ling, H.; Su, K.; Zhao, H.; Li, Q.; Shen, T. Epidemiological Characteristics and
Spatial-Temporal Distribution of Hand, Foot, and Mouth Disease in Chongqing, China, 2009–2016. Int. J.
Environ. Res. Public Health 2018, 15, 270. [CrossRef] [PubMed]
4. Chew, S.P.; Chong, S.L.; Barbier, S.; Matthew, A.; Lee, J.H.; Chan, Y.H. Risk factors for severe hand foot mouth
disease in Singapore: A case control study. BMC Infect. Dis. 2015, 15, 486. [CrossRef] [PubMed]
5. Phung, D.; Nguyen, H.X.; Nguyen, H.; Do, C.M.; Tran, Q.D.; Chu, C. Spatiotemporal variation of
hand-foot-mouth disease in relation to socioecological factors: A multiple-province analysis in Vietnam. Sci.
Total Environ. 2018, 610–611, 983–991. [CrossRef]
6. Wang, P.; Goggins, W.B.; Chan, E.Y. Hand, Foot and Mouth Disease in Hong Kong: A Time-Series Analysis
on Its Relationship with Weather. PLoS ONE 2016, 11, e161006. [CrossRef] [PubMed]
7. Sumi, A.; Toyoda, S.; Kanou, K.; Fujimoto, T.; Mise, K.; Kohei, Y.; Koyama, A.; Kobayashi, N. Association
between meteorological factors and reported cases of hand, foot, and mouth disease from 2000 to 2015 in
Japan. Epidemiol. Infect. 2017, 145, 2896–2911. [CrossRef] [PubMed]
8. National Health Commission of the People’s Republic of China. Overview of the National Notifiable
Infectious Disease Epidemic in 2017 [EB/OL]. Available online: http://www.nhfpc.gov.cn/jkj/s3578/
201802/de926bdb046749abb7b0a8e23d929104.shtml (accessed on 26 February 2018).
9. Zeng, M.; Pu, D.; Mo, X.; Zhu, C.; Gong, S.; Xu, Y.; Lin, G.; Wu, B.; He, S.; Jiao, X.; et al. Children of
rural-to-urban migrant workers in China are at a higher risk of contracting severe hand, foot and mouth
disease and EV71 infection: A hospital-based study. Emerg. Microbes. Infect. 2013, 2, e72. [CrossRef]
10. Deng, T.; Huang, Y.; Yu, S.; Gu, J.; Huang, C.; Xiao, G.; Hao, Y. Spatial-temporal clusters and risk factors of
hand, foot, and mouth disease at the district level in Guangdong Province, China. PLoS ONE 2013, 8, e56943.
[CrossRef]
11. Zhang, W.; Du, Z.; Zhang, D.; Yu, S.; Hao, Y. Boosted regression tree model-based assessment of the impacts
of meteorological drivers of hand, foot and mouth disease in Guangdong, China. Sci. Total Environ. 2016,
553, 366–371. [CrossRef]
12. Liao, J.; Qin, Z.; Zuo, Z.; Yu, S.; Zhang, J. Spatial-temporal mapping of hand foot and mouth disease and the
long-term effects associated with climate and socio-economic variables in Sichuan Province, China from
2009 to 2013. Sci. Total Environ. 2016, 563–564, 152–159. [CrossRef]
13. Tian, L.; Liang, F.; Xu, M.; Jia, L.; Pan, X.; Clements, A. Spatio-temporal analysis of the relationship between
meteorological factors and hand-foot-mouth disease in Beijing, China. BMC Infect. Dis. 2018, 18, 158.
[CrossRef]
14. Liu, J.; Xiang, X.; Pu, Z.; Long, Y.; Xiao, D.; Zhang, W.; Li, Q.; Li, X.; Li, S.; Shao, Z.; et al. Epidemic pattern
of hand-foot-and-mouth disease in Xi’an, China from 2008 through 2015. BMC Infect. Dis. 2019, 19, 19.
[CrossRef]
15. Ma, E.; Lam, T.; Chan, K.C.; Wong, C.; Chuang, S.K. Changing epidemiology of hand, foot, and mouth
disease in Hong Kong, 2001–2009. Jpn. J. Infect. Dis. 2010, 63, 422–426. [PubMed]
16. Song, C.; Shi, X.; Bo, Y.; Wang, J.; Wang, Y.; Huang, D. Exploring spatiotemporal nonstationary effects of
climate factors on hand, foot, and mouth disease using Bayesian Spatiotemporally Varying Coefficients
(STVC) model in Sichuan, China. Sci. Total Environ. 2019, 648, 550–560. [CrossRef] [PubMed]
17. Xu, C.D.; Xiao, G.X. Spatiotemporal risk mapping of hand, foot and mouth disease and its association
with meteorological variables in children under 5 years. Epidemiol. Infect. 2017, 145, 2912–2920. [CrossRef]
[PubMed]
18. Zhang, W.; Du, Z.; Zhang, D.; Yu, S.; Huang, Y.; Hao, Y. Assessing the impact of humidex on HFMD in
Guangdong Province and its variability across social-economic status and age groups. Sci. Rep. 2016, 6,
18965. [CrossRef] [PubMed]
19. Zhang, W.; Du, Z.; Zhang, D.; Yu, S.; Hao, Y. Quantifying the adverse effect of excessive heat on children: An
elevated risk of hand, foot and mouth disease in hot days. Sci. Total Environ. 2016, 541, 194–199. [CrossRef]
20. Liu, L.; Zhao, X.; Yin, F.; Lv, Q. Spatio-temporal clustering of hand, foot and mouth disease at the county
level in Sichuan province, China, 2008-2013. Epidemiol. Infect. 2015, 143, 831–838. [CrossRef] [PubMed]Int. J. Environ. Res. Public Health 2019, 16, 1191 13 of 13
21. Marta, B.; Michela, C. Spatial and Spatio-Temporal Bayesian Models with R-INLA; John Wiley & Sons: Hoboken,
NJ, USA, 2015; pp. 236–246.
22. The Ministry of Health of The People’s Republic of China. Guide for the Preparedness and Control Measures of
Hand, Foot, and Mouth Disease in China; 2008 version; Cap J Public Health: Beijing, China, 2008; pp. 146–148.
(In Chinese)
23. Studenmund, A.H. Using Econometrics: A Practical Guide, 5th ed.; Pearson International Edition: London, UK,
2006; pp. 258–259.
24. Besag, J.; York, J.; Mollié, A. Bayesian image restoration, with two applications in spatial statistics. Ann. Inst.
Stat. Math. 1991, 43, 1–20. [CrossRef]
25. Thway, A.M.; Rotejanaprasert, C.; Sattabongkot, J.; Lawawirojwong, S.; Thi, A.; Hlaing, T.M.; Soe, T.M.;
Kaewkungwal, J. Bayesian spatiotemporal analysis of malaria infection along an international border:
Hlaingbwe Township in Myanmar and Tha-Song-Yang District in Thailand. Malar. J. 2018, 17, 428. [CrossRef]
26. Lau, S.Y.; Chen, E.; Wang, M.; Cheng, W.; Zee, B.C.; Han, X.; Yu, Z.; Sun, R.; Chong, K.C.; Wang, X.
Association between meteorological factors, spatiotemporal effects, and prevalence of influenza A subtype
H7 in environmental samples in Zhejiang province, China. Sci. Total Environ. 2019, 663, 793–803. [CrossRef]
27. Zhang, X.; Xu, C.; Xiao, G. Space-time heterogeneity of hand, foot and mouth disease in children and its
potential driving factors in Henan, China. BMC Infect. Dis. 2018, 18, 638. [CrossRef] [PubMed]
28. Raghavan, R.K.; Hanlon, C.A.; Goodin, D.G.; Davis, R.; Moore, M.; Moore, S.; Anderson, G.A. Bayesian
Spatiotemporal Pattern and Eco-climatological Drivers of Striped Skunk Rabies in the North Central Plains.
PLoS Negl. Trop. Dis. 2016, 10, e4632. [CrossRef]
29. Dedefo, M.; Mwambi, H.; Fanta, S.; Assefa, N. Spatiotemporal mapping and detection of mortality cluster
due to cardiovascular disease with Bayesian hierarchical framework using integrated nested Laplace
approximation: A discussion of suitable statistic applications in Kersa, Oromia, Ethiopia. Geospat. Health
2018, 13. [CrossRef] [PubMed]
30. Wang, J.; Zhang, T.; Fu, B. A measure of spatial stratified heterogeneity. Ecol. Indic. 2016, 67, 250–256.
[CrossRef]
31. Wang, J.F.; Li, X.H.; Christakos, G.; Liao, Y.L.; Zhang, T.; Gu, X.; Zheng, X.Y. Geographical Detectors-Based
Health Risk Assessment and its Application in the Neural Tube Defects Study of the Heshun Region, China.
Int. J. Geogr. Inf. Sci. 2010, 24, 107–127. [CrossRef]
32. Richardson, S.; Thomson, A.; Best, N.; Elliott, P. Interpreting posterior relative risk estimates in
disease-mapping studies. Environ. Health Perspect. 2004, 112, 1016–1025. [CrossRef]
33. Liu, W.; Ji, H.; Shan, J.; Bao, J.; Sun, Y.; Li, J.; Bao, C.; Tang, F.; Yang, K.; Bergquist, R.; et al. Spatiotemporal
Dynamics of Hand-Foot-Mouth Disease and Its Relationship with Meteorological Factors in Jiangsu Province,
China. PLoS ONE 2015, 10, e131311. [CrossRef]
34. Liu, Y.; Wang, X.; Pang, C.; Yuan, Z.; Li, H.; Xue, F. Spatio-temporal analysis of the relationship between
climate and hand, foot, and mouth disease in Shandong province, China, 2008–2012. BMC Infect. Dis. 2015,
15, 146. [CrossRef] [PubMed]
35. Huang, Y.; Deng, T.; Yu, S.; Gu, J.; Huang, C.; Xiao, G.; Hao, Y. Effect of meteorological variables on the
incidence of hand, foot, and mouth disease in children: A time-series analysis in Guangzhou, China. BMC
Infect. Dis. 2013, 13, 134. [CrossRef] [PubMed]
36. Ma, E.; Lam, T.; Wong, C.; Chuang, S.K. Is hand, foot and mouth disease associated with meteorological
parameters? Epidemiol. Infect. 2010, 138, 1779–1788. [CrossRef] [PubMed]
37. Robinson, M.; Drossinos, Y.; Stilianakis, N.I. Indirect transmission and the effect of seasonal pathogen
inactivation on infectious disease periodicity. Epidemics 2013, 5, 111–121. [CrossRef] [PubMed]
38. Kulldorff, M. A spatial scan statistic. Commun. Stat.-Theory Methods 1997, 26, 1481–1496. [CrossRef]
© 2019 by the authors. Licensee MDPI, Basel, Switzerland. This article is an open access
article distributed under the terms and conditions of the Creative Commons Attribution
(CC BY) license (http://creativecommons.org/licenses/by/4.0/).You can also read