SPATIAL ANALYSIS OF THE DISTRIBUTION OF TYPHOID FEVER IN TURKEY
←
→
Page content transcription
If your browser does not render page correctly, please read the page content below
SPATIAL ANALYSIS OF THE DISTRIBUTION OF TYPHOID FEVER IN TURKEY

                                                     D. Toprak a, *, S. Erdoğan b
   a
       AKU, Medical Faculty, Department of Family Medicine, 03200 Afyonkarahisar, Turkey - dilekt66@yahoo.com
                    b
                      AKU, Engineering Faculty, Department of Surveying - serdogan@aku.edu.tr

KEY WORDS: Spatial Analysis, Cluster Analysis, Typhoid Fever, Geographical Information Systems, Spatial Statistics, Spatial
           Autocorrelation

ABSTRACT:

Disease maps have been playing a key descriptive role in epidemiology. Hence, they are useful tools for identification of areas of the
true underlying geographical distribution of the disease incidences. The development of information system technology over the last
30 years has provided a powerful ability to examine spatial patterns, so geographical information systems (GIS) are begun to use in
public health and epidemiologic researches. Today many health agencies and researchers have been using GIS technology to manage
and analyze their health data. Because of the geographical, economical, environmental and cultural differences among the provinces
of Turkey, it is thought that typhoid fever disease can show different distributions and clusters. Therefore, a GIS based spatial
analysis was carried out to explore regional clustering of typhoid fever in Turkey. Distribution of typhoid fever and infection cluster
areas among provinces of Turkey were determined to implement precautionary measures and provisions effectively by health
agencies in Turkey. Study showed that spatial analyses and statistic significantly contribute to the understanding the epidemiology of
diseases. With the aid of these analyses it will be effective to monitor and identify high rate disease locations or regions and to
implement precautionary measures and provisions.

                    1. INTRODUCTION                                  positive in urine cultures. Group agglutination (Gruber-Widal)
                                                                     which is a screening test for the disease is positive at the end of
Typhoid fever is a severe multisystemic illness caused by            first week. The Widal tube agglutination test has been widely
Salmonella typhi (S. typhi) and characterized by the classic         used in the serologic diagnosis of typhoid fever in Turkey.
prolonged fever, sustained bacteremia without endothelial or         Clinicians in Turkey generally consider a titer of 1/200 as
endocardial involvement, and bacterial invasion of and               diagnostic of typhoid fever (Willke A, et al, 2002). In a study
multiplication within the mononuclear phagocytic cells of the        by Erdem et al. in Turkey, the most frequently isolated serotype
liver, spleen, lymph nodes, and Peyer patches. The reservoir of      was found as S. Enteritidis, also being the most common
the s.typhi is human. It is transmitted through the ingestion of     serotype in stool and blood cultures (Erdem, B. et al, 2004).
uncooked food or drink contaminated by the faeces or urine of
infected people. Also fly has an important role in transmission      Typhoid fever's danger doesn't end when symptoms disappear.
especially in summer. S. typhi can live in dry and cool              Even if the symptoms seem to go away, the patient may still be
environment so that the agent can spread with contaminated ice,      carrying S. typhi . If so, the illness could return, or he could
dust, food and sewer system. Epidemics are more common in            pass the disease to other people. Chronic carriers, defined as
spring and summer; sporadic in other seasons (Tekeli, 2008).         individuals who excrete Salmonella for more than 1 year. Some
                                                                     individuals may continue to excrete the bacterium for decades.
In studies of healthy, previously unvaccinated men, ingestion of     Stool carriage is more frequent in people with preexisting
107 S typhi bacilli caused disease in 50% of volunteers.             biliary abnormalities, perhaps because S enterica survives in
Investigations of outbreaks seem to indicate that an inoculum of     gallstones, and these people have a greater incidence of
as few as 200 organisms may lead to the disease. Perhaps such a      cholecystitis. Chronic carriers have a greater risk for carcinoma
discrepancy exists because many who ingest S typhi are not           of the gallbladder and other gastrointestinal malignancies;
healthy men and have any one of a number of risk factors. As         chronic carriers had a 6-fold increase in the risk of death due to
the number of organisms increases, the incubation period             hepatobiliary cancer. This may be due to chronic inflammation
decreases. The number of bacilli ingested does not change the        caused by the bacterium.
subsequent clinical syndrome (Brusch, et al., 2008).
                                                                     Typhoid fever is an important cause of morbidity in many
After ingestion by the host, S typhi invades through the gut and     regions of the world, with an estimated 12 to 33 million cases
multiplies within the mononuclear phagocytic cells in the liver,     occurring annually (Pang et al., 1995). It is common in most
spleen, lymph nodes, and Peyer patches of the ileum.                 parts of the world except in industrialized regions such as the
Symptoms usually develop 1–3 weeks after exposure, and may           United States, Canada, Western Europe, Australia, and Japan.
be mild or severe. They include high fever, malaise, headache,       Therefore, while travelling to the developing world, the people
constipation or diarrhoea, rose-coloured spots on the chest, and     should consider taking precautions and should be vaccinated.
enlarged spleen and liver. Healthy carrier state may follow          (cdc, 2008) Cases are more likely to be seen in areas like India,
acute illness. Fecal cultures are 10-15% positive in first week      South and Central America, and Africa with rapid population
and 75% positive in third and fourth weeks. Basil is 10-40%          growth, increased urbanization, and limited safe water,

* Corresponding author

                                                                1367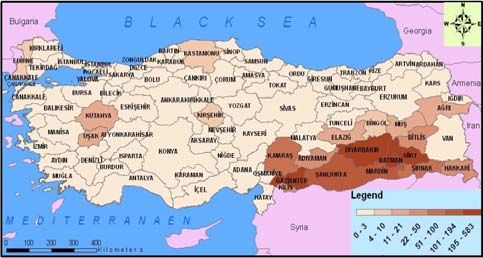
The International Archives of the Photogrammetry, Remote Sensing and Spatial Information Sciences. Vol. XXXVII. Part B8. Beijing 2008

infrastructure, and health systems. In recent years, cases have       systems (GIS) are begun to use in public health and
been reported also from Eastern Europe (Hornick, 1991).               epidemiologic researches. Meanwhile with the rapid
                                                                      development and adoption of GIS technology as a tool to
Most of the patients (75%) are in 30 and younger age group;           visualize, manage, explore and analyze spatial data, spatial
prevalence of the disease decreases in 30 and over age. Also it       statistics and spatial analysis methods that are included in GIS
is rare in children younger than 5 years old. No ethnic group,        software’s modules, received increasing attention (Booth, 2004).
gender and heredity defined related with the disease. The             Human health is an important indicator of individual quality of
overall incidence of blood culture–confirmed disease is               life and effective national economic development. Public health
generally highest in children aged 3-9 years and declines             management and disease control are important duties for health
significantly in late adolescence (Brusch, et al., 2008).             agencies and governments. Since 1990’s, computerization of
                                                                      spatial data, through the use of GIS has been emerging as a tool
Salmonella has mechanisms against acidic environments, but a          for public health care research and epidemiology. So, GIS
pH level of 1.5 or less kills most of the bacilli. People who use     technologies have been used more frequently for such studies
antacids, histamine-2 receptor antagonists (H2 blockers), or          due to the availability of low cost GIS with user-friendly
proton pump inhibitors; who have undergone gastrectomy; or            interfaces (Erdoğan et al., 2008). Today many health agencies
who have achlorhydria due to aging or other factors require           and researchers have been using GIS technology to manage and
fewer bacilli to produce clinical disease. Acquired immune            analyze their health data. Because of the geographical,
deficiencies or hereditary deficiencies in immune modulars,           economical, environmental and cultural differences among the
such as IL-12 and IL-23 increase risk for infection,                  provinces of Turkey, it is thought that typhoid fever disease can
complications and death.                                              show different distributions and clusters. So, a GIS based
                                                                      spatial analysis is carried out to explore regional clustering of
Typhoid fever can be prevented by avoiding risky foods and            typhoid fever in Turkey in this study. This study aimed to
drinks; and getting vaccinated against typhoid fever. The             explore GIS aided spatial analysis of distribution of typhoid
vaccines are not completely effective so that avoiding risky          fever among provinces of Turkey and identify infection cluster
foods will also help protect from other illnesses, including          areas to implement precautionary measures and provisions by
travellers' diarrhea, cholera, dysentery, and hepatitis A. The        health agencies for public health.
vaccination should be completed at least 1 week before the
travel so that the vaccine has time to take effect. Typhoid
vaccines 51-67% prevent the disease and lose effectiveness                                2. METHODOLOGY
after several years. Antibiotics do not prevent typhoid fever but
they are only used to treat the disease (Tekeli, 2008).               Ministry of Health requires mandatory notification of certain
                                                                      communicable diseases in the health facilities in Turkey.
Health care workers caring for patients with typhoid fever            Disease data have been recorded by the province health
should pay strict attention to adequate hand washing and safe         facilities and send to Ministry of Health. These diseases are
disposal of feces and urine. Antibiotic therapy is essential and      grouped in four categories as A, B, C and D according to the
should begin empirically if the clinical evidence is strong.          policy of government with the communicable disease notice No.
Patients must receive adequate fluids, electrolytes, and nutrition.   25635 in 2004. Spatial analyses performed to newly reported
Antimicrobials shorten the course, reduce the rate of                 typhoid fever cases that recorded by the province health
complications if begun early, and drastically reduce the case-        departments in A Category and sent to the Ministry of Health
fatality rate. Surgery is only indicated in some cases like           belong to 1996-2006 period. Population by census year, annual
intestinal perforation. Sometimes small bowel resection is            intercensal rate of increase and mid-year population forecasts
necessary for patients with multiple perforations. Also, if           data were obtained from Turkish Statistical Institute. Using the
antibiotic treatment fails to eradicate the hepatobiliary carriage,   midyear population and the number of cases, average incidence
the gallbladder should be resected. Cholecystectomy is not            rates were calculated for the 1996-2006 period for the 81
always successful in eradicating the carrier state because of         provinces. Empirical Bayes smoothing was used to remove
persisting hepatic infection. The 2 most common complications         background noise from the raw disease rates because of the
of enteric fever are intestinal hemorrhage and perforation.           sparsely populated cities and small number cases of cities. To
Typhoid fever is potentially fatal if untreated. The prognosis        detect global variations and trends in the values of smoothed
depends on the geographical area and its demographics.                rates over the neighbouring provinces, spatial rate smoothing
Generally, the mortality rate in untreated disease is 10-20%. In      based on spatial moving areas technique was performed. Cluster
properly treated disease, it is less than 1%. Between 10% and         analyses were performed whether the cases of typhoid fever
20% of patients treated with antibiotics have a relapse after         show clustering or located closer by chance. Different softwares
initial recovery. A relapse typically occurs approximately 1          were used for visualization and spatial analyses of the health
week after. One to four percent of untreated patients become          data in the study. These are Arc GIS 9.0, developed by ESRI,
chronic carriers (Tekeli, 2008; Brusch, et al., 2008; cdc, 2007,      GeoDa 0.9.5-I developed by Luc Anselin through the Center for
Gotuzzo, 1998).                                                       Spatially Integrated Social Science at the University of Illinois,
                                                                      Clusterseer 2.2.8.1 developed by Terraseer Inc.
Disease maps have been playing a key descriptive role in
epidemiology. So they are useful tools for many purposes such
as: identification of areas of the true underlying geographical                               3. RESULTS
distribution of the disease incidence, assisting in the
formulation of hypotheses about disease etiology, and assessing       We analyzed a total of 361.817 recorded cases from the
potential needs for geographical variation in follow-up studies       Ministry of Health database for the period of 1975-2006 and a
(Bailey, 2001). The development of information system                 total of 244.487 cases recorded for the period of 1996-2006.
technology over the last 30 years has provided a powerful             The morbidity values (100,000) for the periods of 1975-2006
ability to examine spatial patterns, so geographical information      are shown in Figure 1. Clearly, a decrease in the morbidity of

                                                                  1368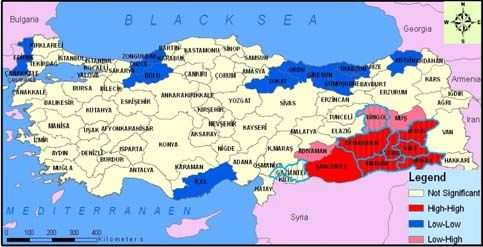
The International Archives of the Photogrammetry, Remote Sensing and Spatial Information Sciences. Vol. XXXVII. Part B8. Beijing 2008
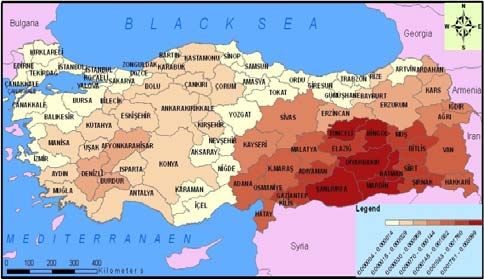
Typhoid fewer can be seen; in recent years. Because of the data
availability, using the midyear population and the number of
cases, incidence rates were calculated only for the 1996-2006
period by provinces (Fig.2). While we work with aggregated
data if the population or the number of cases is relatively small,
rate estimates may not be precise. In order to overcome this
problem, smoothing methods are usually employed. The idea in
smoothing is to borrow the information from other small areas
for the estimation of the relative risk. The information can be
borrowed either from nearest areas (local smoothing) or from
all areas in the study area (global smoothing). Smoothing
techniques use the values in neighbouring areas to adjust the
uncertain values. The need for smoothing is determined not by
the number of cases but rather by an often closely related factor, Figure 2. Choropleth maps of morbidity rates of Typhoid fever
the reliability. There are a number of techniques for smoothing (1:100000)
data such as mean or median based techniques either weighted
or unweighted and Bayes techniques (Anselin et al., 2006). In this study we formed the weight matrix based on the criterion
of contiguity with 6 nearest neighbour. After data smoothing
were constructed, a spatial rate smoother based on the notion of
a spatial moving average was constructed for explorative spatial
60 data analysis. The purpose of integrating spatial rate smoother
method is to emphasize global variations and trends in the
50 health data. These rates of incidence showed that there seems to
be a trend towards the South and Eastern Anatolian regions for
40
the cases of typhoid fever (Figure 3).
M o r b id ity ( 1 :1 0 0 0 0 0 )
30
20
10
0
75
77
79
81
83
85
87
89
91
93
95
97
99
01
03
05
07
19
19
19
19
19
19
19
19
19
19
19
19
19
20
20
20
20
Years
Figure 1. The morbidity values (100000) of Typhoid fever in
Turkey
Figure 3. Choropleth Map of spatial rate smoother values
In this study Empirical Bayes (EB) smoothing was used and
raw incidence rates were replaced with their globally smoothed
In order to explore spatial dependence, showing how the
values which calculated by EB tool in ArcGIS 9.2 created by
incidence rates were correlated in the country, Moran’s I and
National Cancer Institute (NCI) of USA (Fig. 2).
Geary c values calculated. Moran’s I (I: 0.105808, z score value:
Methodological details and further illustrations of EB method
8.19) and Geary c (c: 0.493742, z score 1.97) indicated
were discussed in Bailey and Gatrell, 1995 and Anselin et al.,
significantly clustering of Typhoid incidences in Turkey.
2006.
Moran’s I and Geary’s c methods indicate clustering of high or
low values. But these methods can not distinguish between
Since the incidence rates were aggregated into the aerial units
these situations. So, General G statistic is used to understand
of provinces, an important aspect is deriving spatial weight
clustering of high or low values. General G statistic indicated
matrix (W) for ESDA. The spatial weight matrix is the
(G: 0.58, z score: 7.1) a significantly clustering of high values.
fundamental tool used to model the spatial interdependence
between areal units. Determination of the proper W matrix is a
These global spatial data analysis shows clustering but they
difficult and controversial topic in spatial analyses. There are
don’t show where the clusters are. To investigate the spatial
several techniques for deriving W such as simple contiguity that
variation as well as the spatial associations, it is possible to
sharing a border, distance bands that locations within a given
calculate local versions of Moran’s I, Geary’s c, and the
distance or general social distance, according to the aim of the
General G statistic for each areal unit in the data (Anselin,
studies in literature (Anselin et al., 2006, Shi et al., 2006).
1995).
Then, local approaches were used for analyzing spatial
association to identify where the similar spatial patterns in the
country are. One local approach was Getis Ord Gi* that
identifies those clusters of points with values higher in
magnitude than you might expect to find by random chance.
According to Getis-Ord Gi* Gaziantep, Diyarbakır, Bingöl,
1369The International Archives of the Photogrammetry, Remote Sensing and Spatial Information Sciences. Vol. XXXVII. Part B8. Beijing 2008
Mardin, Batman, Siirt, Şırnak and Bitlis provinces were in those cities with high S typhi prevalences. Currently, fly is
determined as clusters with the significance level of 0.05. recognized as an important mechanical vector of the disease
Another local approach was local Moran (LISA) statistic that especially in summers in these regions. (Tekeli, 2008)
assessed using a normal distribution approximation. Four
situations are identified trough LISA. First, a cluster of In our study, there are some sporadic cases in other parts of
provinces with high-high rates, second a cluster of provinces Turkey. Like our country sporadic outbreaks occur in
with high-low rates, third a cluster of provinces with low-high developed nations, which are explained with the individuals
rates and fourth a cluster of provinces with low-low rates. who have recently returned from travel to an endemic region. In
the United States about 400 cases occur each year, and 75% of
According to LISA results Batman, Şanlıurfa, Diyarbakır, Bitlis, these are acquired while traveling internationally .(cdc, 2008)
Siirt, Mardin and Şırnak provinces were determined as clusters. With the limited efficacy of the current typhoid vaccinations
Figure 3 shows the results obtained from Gİ* statistical values; and the increase in multidrug-resistant strains, cases among
(selected province with turquoise color: pThe International Archives of the Photogrammetry, Remote Sensing and Spatial Information Sciences. Vol. XXXVII. Part B8. Beijing 2008
Diyarbakir-Ergani. Mikrobiyol Bul. Jan; 37(1), pp. 41-7.
Spatial analyses and statistic significantly contribute to the [Article in Turkish]
understanding the epidemiology of diseases. With the aid of Erdem, B., Hasçelik, G., Gedikocğlu, S., Gür, D., Ercis, S.,
these analyses it will be effective to monitor and identify high Sümerkan, B., Aysev, A.D., Tuncer, I., Tuğrul, M., Tatman,
rate disease locations or regions and to implement Otkun, M., Tünger, A., Akgün, Y., Acar, N., Köksal, I.,
precautionary measures and provisions. In this study, it was Gültekin, M., Söyletir, G., Elhan, A., 2004. Salmonella enterica
demonstrated that spatial analysis and spatial statistic can be serotypes and Salmonella infections: a multicenter study
applied to study the distribution of typhoid fever infection. covering ten provinces in Turkey. Mikrobiyol Bul. Jul;38(3),
Specifically, the distributions of typhoid fever reports belong pp.173-86. [Article in Turkish].
the 1996-2006 periods were mapped and eight significant Erdogan, S., Yılmaz, İ., Baybura, T., Güllü, M., 2008.
clusters were identified with spatial clustering methods. Each Geographical information systems aided traffic accident
cluster had a high rate of typhoid fever reports after smoothing. analysis system case study: city of Afyonkarahisar. Accident
The smoothed data provided more accurate visual Analysis and Preventation, 40, pp. 174-181.
representation of the overall distribution of the standardized Gotuzzo, E., Guerra, J.G., Benavente, L., et al., 1988. Use of
rates compared with the original map of observed incidence norfloxacin to treat chronic typhoid carriers. J Infect Dis, Jun;
rates, whereas the cluster analysis pinpoints statistically 157(6), pp. 1221-5.
significant geographical areas generating reports of typhoid
fever. Hornick, R.B. 1991. Typhoid fever, In A. S. Evans and P. S.
Brachman (ed.), Bacterial infections of human epidemiology
and control, 2nd ed. Plenum Medical Book Company, New
REFERENCES York, N.Y, p. 803-818.
Anselin, L., 1995. Local indicators of spatial association-LISA. Meltzer, E., Schwartz, E., 2007. Enteric fever: an Israeli
Geographical Analysis. 27, pp. 93-115. perspective. Isr Med Assoc J., Oct; 9(10), pp. 736-41
Anselin, L., 2004. GeoDa 0.95i Release Notes. Urbana- Mermin, J.H., Villar, R., Carpenter, J, Roberts, L., Samaridden,
Champaign, IL: Spatial Analysis Laboratory (SAL), A., Gasanova, L., Lomakina, S., Bopp, C., Hutwagner, L.,
Department of Agricultural and Consumer Economics, Mead, P., Ross, B., Mintz ED., 1999. A massive epidemic of
University of Illinois, USA. multidrug-resistant typhoid fever in Tajikistan associated with
consumption of municipal water. J Infect Dis. Jun; 179(6), pp.
Anselin, L., Lozano, L., Koschinsky, J., 2006. Rate 1416-22.
Transformations and Smoothing. Spatial Analysis Laboratory
Department of Geography University of Illinois, Urbana- Pang, T., Bhutta, Z.A., Finlay, B.B. and Altwegg., M. 1995.
Champaign, pp. 85, USA. Typhoid fever and other salmonellosis: a continuing challenge.
Trends Microbiol. 3, pp. 253-255.
Bailey, T.C., Gatrell, A.C., 1995. Interactive Spatial Data
Analysis. Essex: Addison, Wesley Longman Limited Republic of Turkey Ministry of Health. 1995. Health Statistics.
Bailey, T.C., 2001. Spatial statistical methods in health. Cad Republic of Turkey, Ministry of Health. Ankara, Turkey.
Saude Publica, 5, pp. 1083-1098.
Shi, H., Zhang, L., Liu, J., 2006. A new spatial-attribute
Booth, A.J., 2004. Spatial statistic and aquatic geographic weighting function for geographically weighted regression. Can.
information systems, In: Nishida T, Kailola PJ, Hollingworth J. For. Res, 36, pp. 996–1005.
CE (eds), Fishery-Aquatic GIS Research Group In: Proceedings
of the Second International Symposium on GIS/Spatial Srikantiah, P., Vafokulov, S., Luby, S.P, Ishmail, T., Earhart,
Analysis in the Aquatic Sciences. Kawagoe-city, Japan, pp. 3– K., Khodjaev, N., Jennings, G., Crump, J.A., Mahoney, F.J.,
44. 2007. Epidemiology and risk factors for endemic typhoid fever
in Uzbekistan. Trop Med Int Health. Jul;12(7), pp. 838-47.
Brusch, J. L., Garvey, T., Typhoid Fever.
http://www.emedicine.com/MED/topic2331.htm (accessed 28 Tekeli, E., 2008. Typhoid fever.
April 2008). http://www.infeksiyon.org/detail.asp?ctg=12&Article=209
(accessed 28 April 2008).
CDC, 2008. Centers for Disease Control and Prevention.
http://www.cdc.gov/ncidod/dbmd/diseaseinfo/typhoidfever_g.ht Willke, A., Ergonul, O., Bayar, B., 2002. Widal test in
m (accessed 28 April 2008) diagnosis of typhoid fever in Turkey. Clin Diagn Lab Immunol.
Jul;9(4), pp. 938-41.
Ceylan, A., Acemoğlu, H., Hoşoğlu, S., Gül, K., Ilçin, E., Efe,
M., 2003. Typhoid fever epidemic in Ahmetli village,
1371The International Archives of the Photogrammetry, Remote Sensing and Spatial Information Sciences. Vol. XXXVII. Part B8. Beijing 2008
1372You can also read