Comparative Study of Flowering Phenology of Selected Plant Life Forms Located in Urban and Rural Environments in Central Europe. Preliminary ...
←
→
Page content transcription
If your browser does not render page correctly, please read the page content below
Proceedings

Comparative Study of Flowering Phenology of Selected Plant
Life Forms Located in Urban and Rural Environments in
Central Europe. Preliminary Results †
Krisztina VerbényinéNeumann* and Szilárd Czóbel

                                          Department of Nature Conservation and Landscape Management, Hungarian University of Agriculture and
                                          Life Sciences, Páter Károly u. 1, Gödöllő 2100, Hungary; neumann.krisztina86@gmail.com
                                          * Correspondence: neumann.krisztina86@gmail.com
                                          † Presented at the 1st International Electronic Conference on Biological Diversity, Ecology and Evolution, 15–
                                             31 March 2021; Available online: https://bdee2021.sciforum.net/.

                                          Abstract: Global climate change has unforeseeable ramifications for the ecosystem of our planet
                                          Earth. In Europe, more than half of the vascular plant flora may become endangered by the year
                                          2080 as a result of climatic changes. According to the Coperniscus Program’s sutdy of European
                                          municipalities Budapest is one of the most affected cities by global warming. Urban climate condi-
                                          tions are considered similar to the changing global climate conditions. To find out how excess
                                          heat in urban environments affects the phenological flowering patterns of species we planted spec-
                                          imens representing 6 different life-forms of the Raunkiær system (phanerophytes, chamaephytes,
                                          hemicryptophytes, geophytes, hemitherophytes, therophytes). The species of the ex situ experiment
                                          were planted in two different mesoclimatic locations, in the ELTE Botanical Garden, Budapest and
                                          in the Hungarian University of Agriculture and Life Sciences Gödöllő Botanical Garden. Each life-
Citation: Neumann, K.V.; Czóbel, S.
                                          form was represented by at least 5 species and each species by 5-5 specimens in both locations. By
Comparative Study of Flowering
                                          recording phenological data we followed Primack’s method. All the species in the experiment
Phenology of Selected Plant Life
                                          showed an average 7.62 days earlier flowering onset in Budapest, Füvészkert. The maximum of the
Forms Located in Urban and Rural
Environments in Central Europe.
                                          flowering showed 12.94 days of difference, while the end of flowering showed 2.9 days of difference,
Preliminary Results. Proceedings          with the earlier being Budapest, Füvészkert. There is a strong significant difference (p ˂ 0.001) in the
2021, 68, x.                              onset of the flowering of Globularia cordifolia between the locations, regarding the peaks of flower-
https://doi.org/10.3390/xxxxx             ing there is a strong significance (p ˂ 0.001) for Inula ensifolia, regarding the end of flowering there
                                          is a strong significance (p ˂ 0.001) for Polygonatum multiflorum. The average duration of the flower-
Academic Editor:                          ing of all species was 4.72 days longer in Budapest compared to Gödöllő. To clarify other driving
                                          forces and the role of abiotic parameters in the flowering phenology patterns, further study is re-
Published: date                           quired.

Publisher’s Note: MDPI stays neu-
                                          Keywords: flowering phenology; climate change; urban heat island
tral with regard to jurisdictional
claims in published maps and institu-
tional affiliations.

                                          1. Introduction
                                               Climate change has unforeseeable ramifications for the ecosystem of our planet Earth.
Copyright: © 2021 by the authors.         In Europe, more than half of the vascular plant flora may become endangered by the year
Submitted for possible open access        2080 as a result of climatic changes (Thuiller et al., 2005). Based on current research it
publication under the terms and con-      seems that climate change can no longer be stopped. Therefore, it is crucial to investigate
ditions of the Creative Commons At-
                                          possible adaptations (Li et al., 2019).
tribution (CC BY) license (http://crea-
                                               Urban climate conditions are considered similar to the changing global climate
tivecommons.org/licenses/by/4.0/).
                                          conditions; therefore, many researchers study urbanized areas as small-scale experiments,
                                          or models, of global climate change (Ziska et al., 2003). Thus, it is key to examine the pat-
                                          terns and shifts in the patterns of flowering phenology in urban areas compared with rural
                                          ones. Cities are strongly affected by climate change.

Proceedings 2021, 68, x. https://doi.org/10.3390/xxxxx                                                             www.mdpi.com/journal/proceedings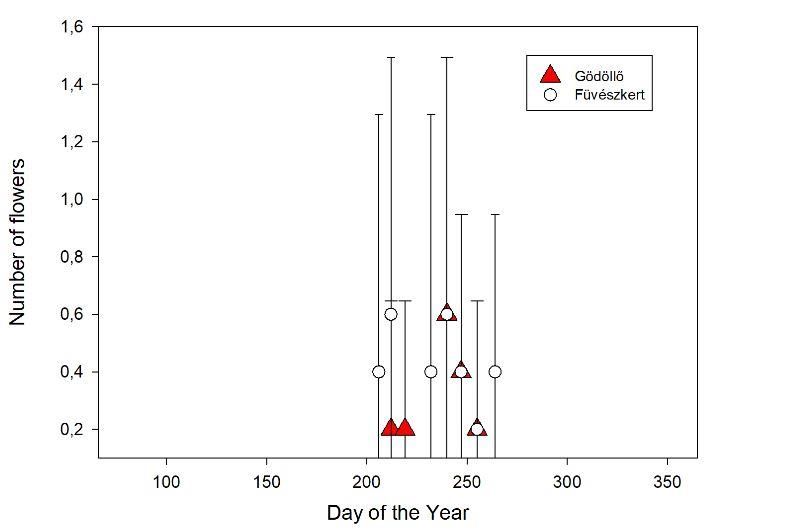
Proceedings 2021, 68, x FOR PEER REVIEW                                                                                      2 of 9

                                       Fifty years of data from the Copernicus Program on more than 100 000 European
                                 municipalities confirm that the continent is heating up at every latitude. In a third of these
                                 municipalities, the average temperature has risen by more than 2 °C between the 1960s
                                 and the last decade (http3, http4). The survey compared the mean temperatures of the
                                 municipalities of the period between 1961–1970 with the period between 2009–2018. Ac-
                                 cording to the report of this program mean temperature of Budapest increased from
                                 8.04 °C to 12.04 °C, and in Gödöllő from 7.56 °C to 10.76 °C.
                                       Phenology is the study of the timing of recurrent biological events, the causes of their
                                 timing with regards to biotic and abiotic forces, and the interrelation among phases of the
                                 same or different species (Lieth 1974). Many research shows that temperature change sig-
                                 nificantly affects the life cycle of plants (e.g. Scheifinger et al., 2003, Kunkel et al., 2004,
                                 Hansen et al., 2006, Lehoczky et al., 2016).
                                       Towards the end of the last century, phenological observations were recognized for
                                 their capability to visually and quantitatively assess climate change effects on ecosystems.
                                 Several studies demonstrate significant shifts in phenological phases of plants across Eu-
                                 rope (e.g., Menzel and Fabian 1999; Menzel 2000, Chmielewski and Roetzer 2001, Schleip
                                 et al., 2009). Shifts in phenological events in the Carpathian Basin are particularly poorly
                                 documented, with a few exceptions coming from the works of Keresztes (1984), Walk-
                                 ovszky (1998), Schieber et al. (2009), Eppich et al. (2009), Molnár et al. (2012), Varga et al.
                                 (2012), Lehoczky et al. (2016), and Szabó et al. (2016). Keresztes (1984), Walkovszky (1998),
                                 and Varga et al. (2012) are focusing on their study on Robinia pseudoacacia, a non-native
                                 species for the Carpathian Basin, however, there is a lack of studies with emphasis on
                                 native species’ phenology in Hungary. There is less available phenological data on wild-
                                 growing plants, then from cultivated species (Walkovszky 1998, Hunkár 2012). Szabó et
                                 al. (2016) showed in their study based on the long-term data from the Hungarian Meteor-
                                 ological Service recorded between 1952 and 2000, that native plant species advanced their
                                 flowering time (1952–2000) by 1.9–4.4 days per decade.
                                       A comprehensive understanding of species phenological responses to global warm-
                                 ing requires observations that are both long-term and spatially extensive. Long-term data
                                 series deriving from the same place are rare (Hunkár et al., 2012). It is also very important
                                 to choose the correct methodology for the research. Primack (1985) described the meth-
                                 odology of collecting flowering phenology data. For the observation of individual plants,
                                 he suggests counting every flower open on the entire plant on every day that the plant is
                                 in bloom, to note the date of first flowering, the date of the last flowering, and the date on
                                 which the most flowers are open (date of maximum flowering).
                                       Several previous studies (e.g., Menzel 2000, Roetzer et al., 2000, Walkovszky 1998, Ep-
                                 pich 2009) confirmed that flowering phases advanced during the 20th century, which is con-
                                 nected with the increasing temperature. Szabó et al. (2016) examined flowering phenologi-
                                 cal records for six species (Convallaria majalis, Taraxacum officinale, Syringa vulgaris, Sambucus
                                 nigra, Robinia pseudoacacia, Tilia cordata) based on phenological observations from the Hun-
                                 garian Meteorological Service recorded between 1952 and 2000. Altogether, four from the
                                 six examined plant species showed a significant advancement in flowering onset with an
                                 average rate of 1.9–4.4 days per decade. Using a long-term data series of 144 years (1851–
                                 1994) Walkovszky (1998) showed 3–8-day advancement in the flowering date of Robinia
                                 pseudoacacia, relating the event to the mean temperature of March–May.
                                       This study aims to find out how excess heat in urban environments affect the pheno-
                                 logical flowering patterns of species belonging to different life forms, and how different
                                 the effect is in colder rural mesoclimactic environments.
                                       To observe this, we planted plants representing six different life forms in two distinct
                                 locations. One was in downtown Budapest in ELTE Botanical Garden (Füvészkert), and
                                 the other in MATE Botanical Garden of Gödöllő. The flowering of the plants was recorded
                                 between the 1 March and 25 December in 2020.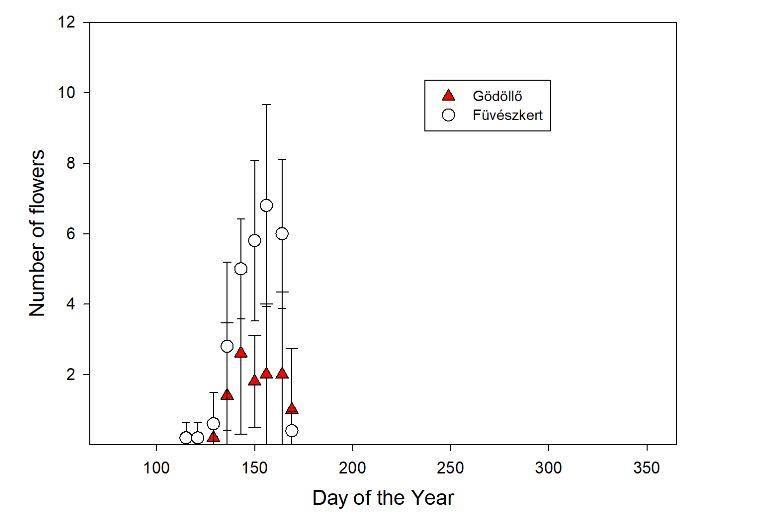
Proceedings 2021, 68, x FOR PEER REVIEW 3 of 9
We hypothesized locations with higher mean temperatures would result (i) in an ear-
lier onset and (ii) and an earlier end of flowering, compared to colder locations.
2. Materials and Methods
2.1. Study Area
Examination covering the entire vegetation cycle of species have been implemented
in the Experimental Site of Hungarian University of Agriculture and Life Sciences Gödöllő
Botanical Garden (47°35′36.2′′ N 19°22′06.2′′ E, 250 m elevation, mean annual temperature
is 9.7 °C; the average amount of precipitation is 560 mm) (Dövényi et al., 2008, Szirmai et
al., 2014) and the ELTE Botanical Garden (Budapest 47°29′05.6′′ N 19°05′05.7′′ E, 114 m
elevation, mean annual temperature is 10.4 °C; the average amount of precipitation is 514
mm) (Dövényi et al., 2008, Orlóci et al., 2019).
For the 34 species, 34 homogenous row shaped patches have been created within the
two selected areas with 5 repetitions by species and by location.
2.2. Ex Situ Phenological Experiment
We planted specimens representing 6 different life-forms of the Raunkiær system
(phanerophytes, chamaephytes, hemicryptophytes, geophytes, hemitherophytes, thero-
phytes). Each category was represented by at least 5 species (Table 1) and each species by
5–5 specimens in both locations (two botanical gardens one in Budapest the other in Gö-
döllő).
The observation units were put in standard-sized flowerpots with a diameter of 27
cm for phanerophytes, and 14 cm for the rest, containing at least one specimen from the
given species. We tried to maximize genetic conformity in each species. This was achieved
by using clones in phanerophytes, obtained from the Hungarian University of Agriculture
and Life Sciences Soroksári Botanical Garden. In the case of seed-sown species, the prop-
agating material was collected from one specimen per species in the Gödöllő Botanical
Garden and the Füvészkert, while in the case of other species we obtained specimens
propagated from the horticulture of Beretvás & Co. Ltd. We collected and planted the
specimens to the experimental patches during December of 2019.
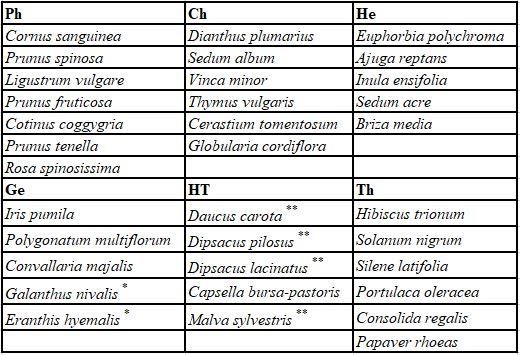
Table 1. The species included in the experiment grouped by life-forms. * the species were intro-
duced after the start of the growing season, therefore were not included in the record; **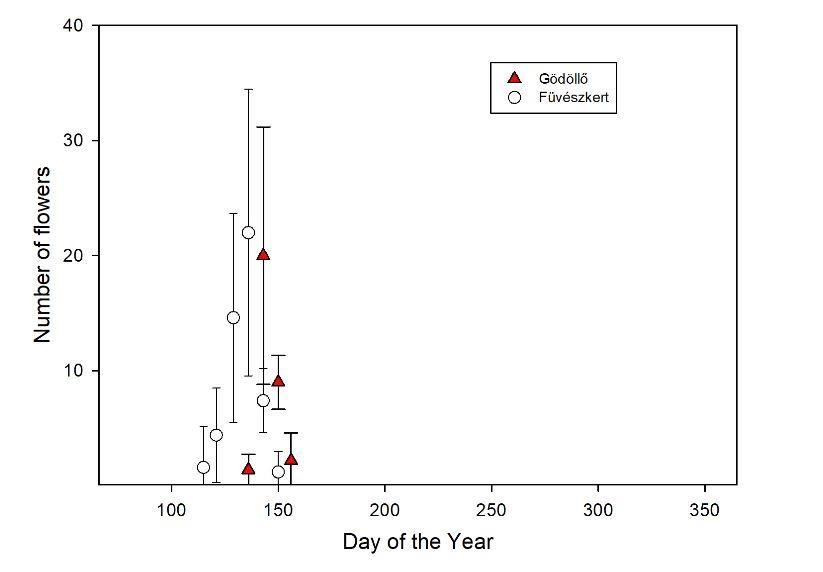
Proceedings 2021, 68, x FOR PEER REVIEW                                                                                     4 of 9

                                 resulting from their life-form, flowering in the first year is not expected (Krumbiegel,
                                 2008).
                                       To minimize external factors, we used a standard soil mix and we put the plants in
                                 the patches of similar characteristics and followed the same protocol during their obser-
                                 vation. In practice, this meant frequent weeding and regular irrigation during the summer
                                 months. Observations were realized weekly on the same day of the week from March to
                                 December of 2020, on both locations, collecting flowering phenological data. For the study
                                 of the flowering phenological data, we used Primack's (1985) method. The timing of the
                                 start, peak, and end of flowering was recorded in an Excel sheet. We recorded the end of
                                 flowering when there was no more flower on any of the specimens. The peak was the first
                                 day from all the dates when the specimen had the maximum number of flowers noticed.
                                 In case of solitary flower we recorded the number of flowers, while in case of Briza media,
                                 Capsella bursa-pastoris, Sedum album, and Thymus vulgaris we recorded the number of in-
                                 florescences for each observation unit. During the growing season specimens of Cornus
                                 sanguiena, Ligustrum vulgare, Prunus tenella, Rosa spinosissima, Dianthus plumarius, Sedum
                                 album, Vinca minor, Thymus vulgaris, Cerastium tomentosum, Ajuga reptans, Inula ensifolia,
                                 Sedum acre, Briza media, Iris pumila, Polygonatum multiflorum, Capsella bursa-pastoris, Hibis-
                                 cus trionum, Solanum nigrum, Silene latifolia, Portulaca oleracea, Consolida regalis, Papaver
                                 rhoeas flowered. In case of Portulaca oleracea we could only infer the flowering from the
                                 fruiting because there was no flower detected at the times of observation. The flowering
                                 of the Papaver rhoeas could only be detected on one of the locations, on the other a short
                                 flowering period could be inferred from the buds and fruits. Therefore, these two species
                                 were excluded from the evaluation of the flowering data. On both observation locations
                                 only Prunus tenella, Dianthus plumarius, Sedum album, Vinca minor, Thymus vulgaris, Ceras-
                                 tium tomentosum, Ajuga reptans, Inula ensifolia, Sedum acre, Briza media, Iris pumila, Polygo-
                                 natum multiflorum, Capsella bursa-pastoris, Hibiscus trionum, Solanum nigrum, Silene latifolia
                                 flowered. All species—except Iris pumila—produced enough flowers for statistical analysis of
                                 the data.

                                 2.3. Statistical Analysis
                                      Figures were created with Sigma Plot 12.0. For statistical analysis, we used Windows
                                 Excel 2016, while we calculated the two-tailed t-test to show the difference between loca-
                                 tions. The results shown in the figures are the averages and standard deviations for each
                                 species in both locations.

                                 3. Results
                                       From the 16 species flowering on both locations 12 species Globularia cordiflolia (Fig-
                                 ure 1), Briza media (Figure 2), Hibiscus trionum (Figure 3), Silene latifolia subsp. alba,
                                 Inula ensifolia, Polygonatum multiflorum, Dianthus plumarius, Sedum album, Vinca mi-
                                 nor, Thymus vulgaris, Cerastium tomentosum, and Capsella bursa-pastoris confirmed
                                 our hypothesis, by flowering earlier in ELTE Botanical Garden than in Gödöllő. From the
                                 listed species the average difference in the onset of flowering was 10.66 days. The Solanum
                                 nigrum, Sedum acre started the flowering on the same week on both locations. The Prunus
                                 tenella, Ajuga reptans, and the Iris pumila started to flower earlier in Gödöllő, contradict-
                                 ing our hypothesis. Species with the earlier onset of flowering happening in Gödöllő had
                                 an average difference of 2.2 days. All the species in the experiment averaged at 7.62 days
                                 earlier flowering onset in Budapest, Füvészkert. The peak of the flowering had 12.94 days
                                 of difference, while the end of flowering had 2.9 days of difference, with the earlier being
                                 Budapest, Füvészkert.
                                       The Globularia cordifolia, Inula ensifolia, Polygonatum multiflorum, Dianthus plu-
                                 marius, Thymus vulgaris, Cerastium tomentosum and Capsella bursa-pastoris had an ear-
                                 lier onset as well as an earlier end of flowering in Budapest, Füvészkert compared to
Proceedings 2021, 68, x FOR PEER REVIEW 5 of 9
Gödöllőn. The flowering of Sedum album had an earlier onset in Budapest and a simulta-
neous end on both locations. The flowering of Hibiscus trionum and Vinca minor started
earlier and ended later in Budapest. The flowering of Ajuga reptans and Iris pumila started
later and ended later in Budapest. The flowering of Prunus tenella started later in Budapest
and ended at the same time. The flowering of Solanum nigrum and Sedum album started
in the same week and ended earlier in Budapest. The flowering of Silene latifolia subsp. alba
started in the same week in both locations, but in contrast to the former two ended later in
Budapest. The average duration of the flowering of all species was 4.72 days longer in Bu-
dapest compared to Gödöllő. Flowering duration of Hibiscus trionum, Silene latifolia subsp.
alba, Globularia cordifolia, Briza media, Sedum album, Vinca minor, Capsella bursa-pas-
toris, Ajuga reptans, and Iris pumila was longer in Budapest, compared to Gödöllő.
According to the statistical analysis, there is a strong significant difference (p ˂ 0.001)
in the onset of the flowering of Globularia cordifolia between the locations. Polygonatum
multiflorum, Cerastium tomentosum, and Capsella bursa-pastoris showed a medium signifi-
cance (p ˂ 0.01). There was a still significant but weaker connection (p ˂ 0.05) for the onset
of flowering of Thymus vulgaris between the two locations.
Regarding the peaks of flowering there was a strong significance (p ˂ 0.001) for
Inula ensifolia medium significance (p ˂ 0.01) for Globularia cordifolia, Dianthus plumarius
Thymus vulgaris Cerastium tomentosum Capsella bursa-pastoris, and a weaker significance (p
˂ 0.05) for Polygonatum multiflorum.
Regarding the end of flowering there is a strong significance (p ˂ 0.001) for Polygona-
tum multiflorum, medium siginificance (p ˂ 0.01) for Globularia cordifolia, Thymus vulgaris, and
a weaker significance (p ˂ 0.05) for Sedum acre, Dianthus plumarius, and Cerastium tomentosum.
Figure 1. The flowering period and pattern of Globularia cordifolia.Proceedings 2021, 68, x FOR PEER REVIEW 6 of 9
Figure 2. The flowering period and pattern of Briza media.
Figure 3. The flowering period and pattern of Hibiscus trionum.
4. Discussion
Our results show that the onset and end of flowering occurred earlier in the capital
city with a higher mean temperature than in the lower mean temperature rural area. How-
ever, the flowering period lasted longer in Budapest than the rural area with a 3 °C lower
mean temperature. Only a few studies (e.g., Roetzer et al., 2000, Ziska et al., 2003, Neil &
Wu 2006, Jochner et al., 2012) focused on the difference in phenological patterns between
urban and rural areas. Roetzer et al. (2000) analyzed data for four spring-blooming plants
from 10 central European observation stations between 1951 and 1995. At almost all sta-
tions, the plants tended to bloom earlier in urban areas than in surrounding rural areas byProceedings 2021, 68, x FOR PEER REVIEW 7 of 9
about 2–4 days. Jochner et al. (2012) investigated the role of elevation and urbanization in
the shift of flowering phases of tree species, and an advance of 2.6–7.6 days was observed
between an entirely rural area and an entirely urban one. Roetzer et al. (2000) showed,
that in European cities with strong urban climate effects e.g., Munich, Vienna and Ham-
burg, phenophases are beginning 3–16 days earlier. His results are in agreement with our
results as the plants grown in Budapest, Füvészkert have on average 7.62 days earlier on-
set of flowering compared to Gödöllő. This result could mean that downtown Budapest
is strongly affected by the urban climate effect. Researchers attribute advanced flowering
in urban environments to the Heat Island Effect (Neil & Wu 2006), which is clearly notice-
able in our results as well.
Extension of growing periods in urban habitats has also been reported in the northern
hemisphere (e.g., Zhang et al., 2004, Neil and Wu 2006) while possible protracted flower-
ing periods within urban landscapes are poorly studied, especially in Europe. Davis et al.
(2016) examined eucalyptus trees in streets in Sidney, Australia, and observed, that 3 tree
species from the family Myrtaceae showed a significantly longer flowering period on the
streets of the city than in their natural habitats. Our results are consistent with this study,
as the species participating in the experiment had a 4.72 days longer flowering period in
Budapest compared to Gödöllő.
Compared to the onset of flowering there are significantly fewer studies regarding
the end of flowering and the possible advancement of it. Masetti et al. (2015) studied Tilia
x europea in Florence, Italy, and concluded that both the start and end of flowering ad-
vanced by 1.4 days in urban areas. In our experiment Globularia cordifolia, Inula ensifolia,
Polygonatum multiflorum, Dianthus plumarius, Thymus vulgaris, Cerastium tomentosum, and
Capsella bursa-pastoris started to flower earlier in Budapest, Füvészkert compared to Gö-
döllő. All the species in the experiment had an average of 2.9 days advancement at the
end of flowering in Budapest, Füvészkert compared to Gödöllő, which is in agreement
with the observation of Masetti et al. (2015).
Nail and Wu (2006) observed the phenomenon that early spring bloomers in these
environments tend to be more sensitive than mid- or late-spring bloomers. For the future
investigation of this conclusion, we will introduce 2 early spring bloomers Eranthis hye-
malis and Galantus nivalis from 2021.
Is there a significant difference between the years? Exactly with which abiotic param-
eters do the flowering phenology correllate? These are questions to be addressed in fu-
ture studies.
Based on our result, not all of these questions can be answered. Peñuelas and Filella
(2001) showed that the advancements of phenological events were significantly correlated,
with temperature increase over the 30 years before then, however, the significance of other
factors is unclear. According to Rathcke and Lacey (1985) and Neil and Wu (2006) photo-
period, temperature, and soil moisture have been recognized as the main environmental
triggers for leafing and flowering. Zhang et al. (2004) claim that it is the interaction be-
tween temperature and photoperiod that is responsible for initiating flowering Szabó et
al. (2016) claim that the flowering phenophase shows the strongest correlation with the
average air temperature of a few months preceding the event, while Eppich et al. (2009)
came to the conclusion that the average of the daily temperature fluctuation in the given
period and the number of frosty days are the most important triggers for flowering phe-
nology. To clarify the driving forces of flowering phenology patterns we installed micro-
meteorological equipment to continuously measure abiotic parameters on both locations.
5. Conclusions
The experiment confirmed our hypotheses. As a result of increasing temperature, we
can count on earlier onset and end of flowering. Excess heat in urban environments can
serve as model of ongoing and upcoming global warming.Proceedings 2021, 68, x FOR PEER REVIEW 8 of 9
Author Contributions: Krisztina Verbényiné Neumann performed the experiment, analysed the
data and wrote the paper, Szilárd Czóbel designed and supervised the project. All authors have
read and agreed to the published version of the manuscript.
Institutional Review Board Statement:
Informed Consent Statement:
Data Availability Statement:
Acknowledgments: This research was supported by the Ú NKP-20-3-I New National Excellence Pro-
gram of the Ministry for Innovation and Technology of Hungary.
References
1. Chmielewski, F.-M.; Rötzer, T. Response of tree phenology to climate change across Europe. Agric. For. Meteorol. 2001, 108, 101–
112, doi:10.1016/s0168-1923(01)00233-7.
2. Davis, A.; Major, R.E.; Taylor, C.E. Do trees flower longer in the city? A comparison of flowering eucalyptus trees in streets,
remnants and continuous forest and their association with nectarivorous birds. Urban. Ecosyst. 2016, 19, 735–747,
doi:10.1007/s11252-015-0515-z.
3. Dövényi, Z.; Ambrózy, P.; Juhász, Á.; Marosi, S.; Mezősi, G.; Michalkó, G.; Tiner, T. Magyarország kistájainak katasztere
Inventory of microregions in Hungary. In OTKA Kutatási Jelentések| OTKA Research Reports; OTKA: San Francisco, CA, USA,
2008.
4. Eppich, B. Climatic Effects on the Phenology of Geophytes. Appl. Ecol. Environ. Res. 2009, 7, 253–266,
doi:10.15666/aeer/0703_253266.
5. Hansen, J.; Sato, M.; Ruedy, R.; Lo, K.; Lea, D.W.; Medina-Elizade, M. Global temperature change. Proc. Natl. Acad. Sci. USA
2006, 103, 14288–14293, doi:10.1073/pnas.0606291103.
6. Hufnagel, L.; Sipkay, C. A Klí maváltozás Hatása Ökológiai Folyamatokra és Közösségekre; Budapesti Corvinus Egyetem: Budapest.
Hungary, 2012; 531p.
7. Hunkár, M.; Vincze, E.; Szenyan, I.; Dunkel, Z. Application of phenological observations in agrometeorological models and
climate change research. Idojaras 2012, 116, 195–209.
8. IPCC. Fourth Assessment Report of Intergovermental Panel onClimate Change. 2007. Available online: http://www.ipcc.ch
(accessed on).
9. Jochner, S.C.; Sparks, T.H.; Estrella, N.; Menzel, A. The influence of altitude and urbanisation on trends and mean dates in
phenology (1980–2009). Int. J. Biometeorol. 2011, 56, 387–394, doi:10.1007/s00484-011-0444-3.
10. Keresztes. B. Az Akác (Robinia pseudoacacia L); Akadémia Kiadó, Budapest, Hungary,1984. (in hungarian).
11. Krumbiegel, A. Growth forms of biennial and pluriennial vascular plants in central Europe. Nord. J. Bot. 1999, 19, 217–226,
doi:10.1111/j.1756-1051.1999.tb00667.x.
12. Kunkel, K.E.; Easterling, D.R.; Hubbard, K.; Redmond, K. Temporal variations in frost-free season in the United States: 1895–
2000. Geophys. Res. Lett. 2004, 31, 03201, doi:10.1029/2003gl018624.
13. Lehoczky, A. Testing Plant Phenophase as Proxy: Sensitivity Analysis of First Flowering Data from the 19th Century. Appl. Ecol.
Environ. Res. 2016, 14, 213–233, doi:10.15666/aeer/1402_213233.
14. Li, L.; Cao, R.; Wei, K.; Wang, W.; Chen, L. Adapting climate change challenge: A new vulnerability assessment framework
from the global perspective. J. Clean. Prod. 2019, 217, 216–224, doi:10.1016/j.jclepro.2019.01.162.
15. Lieth, H. Phenology and Seasonality Modeling. Ecological Studies 8; Springer: Berlin/Heidelberg, Germany, 1974; p. 444.
16. Massetti, L.; Petralli, M.; Orlandini, S. The effect of urban morphology on Tilia×europaea flowering. Urban. For. Urban. Green.
2015, 14, 187–193, doi:10.1016/j.ufug.2014.10.005.
17. Millennium Ecosystem Assessment. Ecosystems and Human Well-Being: Synthesis; Washington: Island Press: Washington, DC,
USA, 2005.
18. Menzel, A.; Fabian, P. Growing season extended in Europe. Nat. Cell Biol. 1999, 397, 659, doi:10.1038/17709.
19. Menzel, A. Trends in phenological phases in Europe between 1951 and 1996. Int. J. Biometeorol. 2000, 44, 76–81,
doi:10.1007/s004840000054.
20. Molnár A.; Tökölyi, J.; Végvári, Z.; Sramkó, G.; Sulyok, J.; Barta, Z. Pollination mode predicts phenological response to climate
change in terrestrial orchids: A case study from central Europe. J. Ecol. 2012, 100, 1141–1152, doi:10.1111/j.1365-2745.2012.02003.x.
21. Montreal Convention of Biological Diversity (2010) Conference of the Parties, Tenth Meeting, Nagoya, Japan, 18–29 October
2010, Agenda Item 4.7, Advance Unedited Text, 2 Nov 2010. Available online: http://www.cbd.int/ (accessed on 16 December
2010).
22. Neil, K.; Wu, J. Effects of urbanization on plant flowering phenology: A review. Urban. Ecosyst. 2006, 9, 243–257,
doi:10.1007/s11252-006-9354-2.
23. Orlóci, L.; Kiszel, P.; Solymosiné László, I.; Papp, L. Delectus Seminum Sporarum Plantarumque Horti Botanici Univer-Sitatis
Hungariae; Eotvos Lorand Tudomanyegyetem: Budapest, Hungary, 2019.Proceedings 2021, 68, x FOR PEER REVIEW 9 of 9
24. Peñuelas, J. PHENOLOGY: Responses to a Warming World. Science 2001, 294, 793–795, doi:10.1126/science.1066860.
25. Primack, R.B. Patterns of Flowering Phenology in Communities, Populations, Individuals, and Single Flowers. In The Population
Structure of Vegetation; Springer: Dordrecht, the Netherlands, 1985; Volume 3, pp. 571–593.
26. Primack, R.B.; Miller-Rushing, A.J. The role of botanical gardens in climate change research. New Phytol. 2009, 182, 303–313,
doi:10.1111/j.1469-8137.2009.02800.x.
27. Rathcke, B.; Lacey, E.P. Phenological Patterns of Terrestrial Plants. Annu. Rev. Ecol. Syst. 1985, 16, 179–214,
doi:10.1146/annurev.es.16.110185.001143.
28. Roetzer, T.; Wittenzeller, M.; Haeckel, H.; Nekovar, J. Phenology in central Europe—Differences and trends of spring
phenophases in urban and rural areas. Int. J. Biometeorol. 2000, 44, 60–66, doi:10.1007/s004840000062.
29. Scheifinger, H.; Menzel, A.; Koch, E.; Peter, C. Trends of spring time frost events and phenological dates in Central Europe.
Theor. Appl. Clim. 2003, 74, 41–51, doi:10.1007/s00704-002-0704-6.
30. Schieber, B.; Janik, R.; Snopková, Z. Phenology of four broad-leaved forest trees in a submountain beech forest. J. For. Sci. 2009,
55, 15–22, doi:10.17221/51/2008-jfs.
31. Schleip, C.; Sparks, T.; Estrella, N.; Menzel, A. Spatial variation in onset dates and trends in phenology across Europe. Clim. Res.
2009, 39, 249–260, doi:10.3354/cr00830.
32. Secretariat of the CBD. Global Strategy for Plant Conservation; Secretariat of the Convention on Biological Diversity: Rio de Janeiro,
Brazil, 2002.
33. Szabó, B.; Vincze, E.; Czúcz, B. Flowering phenological changes in relation to climate change in Hungary. Int. J. Biometeorol.
2016, 60, 1347–1356, doi:10.1007/s00484-015-1128-1.
34. Szirmai, O.; Horel, J.; Neményi, A.; Pándi, I.; Gyuricza, C.; Czóbel, S. (2014): Overview of the collections of the first agrobo-
tanical garden of Hungary. Hung. Agric. Res. 2014, 23, 19–25.
35. Templ, B.; Team, N.-P.; Templ, M.; Filzmoser, P.; Lehoczky, A.; Bakšienè, E.; Fleck, S.; Gregow, H.; Hodzic, S.; Kalvane, G.; et
al. Phenological patterns of flowering across biogeographical regions of Europe. Int. J. Biometeorol. 2017, 61, 1347–1358,
doi:10.1007/s00484-017-1312-6.
36. Thuiller, W.; Lavorel, S.; Araújo, M.B.; Sykes, M.T.; Prentice, I.C. Climate change threats to plant diversity in Europe. Proc. Natl.
Acad. Sci. USA 2005, 102, 8245–8250, doi:10.1073/pnas.0409902102.
37. Varga, Z.; Varga-Haszonits, Z.; Gerencser, E.; Zs, L.; Milics, G. Bioclimatological analysis of the development of lilac (Robinia
pseudoacacia L.). Acta Agron. Ovar. 2012, 54, 35–52 (in hungarian).
38. Walkovszky, A. Changes in phenology of the locust tree ( Robinia pseudoacacia L.) in Hungary. Int. J. Biometeorol. 1998, 41, 155–
160, doi:10.1007/s004840050069.
39. Zhang, X.; Friedl, M.A.; Schaaf, C.B.; Strahler, A.H. Climate controls on vegetation phenological patterns in northern mid- and
high latitudes inferred from MODIS data. Glob. Chang. Biol. 2004, 10, 1133–1145, doi:10.1111/j.1529-8817.2003.00784.x.
40. Ziska, L.H.; Gebhard, D.E.; Frenz, D.A.; Faulkner, S.; Singer, B.D.; Straka, J.G. Cities as harbingers of climate change: Common
ragweed, urbanization, and public health. J. Allergy Clin. Immunol. 2003, 111, 290–295, doi:10.1067/mai.2003.53.
41. The State of the Global Climate 2020. Available online: https://public.wmo.int/en/our-mandate/climate/wmo-statement-state-
of-global-climate (accessed on 2 January 2021).
42. A Szélsőséges Időjárás Egyre Inkább a Globális Felmelegedés Számlájára Írható. Available online: https://www.met.hu/ismeret-
tar/meteorologiai_hirek/index.php?id=1703 (accessed on 2 January 2021).
43. Climate Warming in Europe, Municipality by Municipality. Available online:
https://www.europeandatajournalism.eu/eng/News/Data-news/Climate-warming-in-Europe-municipality-by-municipality
(accessed on 30 December 2020).
44. UERRA Regional Reanalysis for Europe on Single Levels from 1961 to 2019. Available online:
https://cds.climate.copernicus.eu/cdsapp#!/dataset/reanalysis-uerra-europe-single-levels?tab=overview (accessed on 30
December 2020).You can also read