Iowa Spring Spotlight Survey: 2020 Summary - Iowa DNR
←
→
Page content transcription
If your browser does not render page correctly, please read the page content below

Iowa Spring Spotlight Survey: 2020 Summary

Dan J. Kaminski, Iowa Department of Natural Resources, Boone Wildlife Research Station, 1436 255th St., Boone, Iowa 50036
Tyler M. Harms, Iowa Department of Natural Resources, Boone Wildlife Research Station, 1436 255th St., Boone, Iowa 50036
Jim M. Coffey, Iowa Department of Natural Resources, Chariton Research Station, 24570 US HWY 34, Chariton, Iowa 50049
Vince D. Evelsizer, Iowa Department of Natural Resources, Clear Lake Research Station, 1203 N. Shore Dr., Clear Lake, Iowa 50428
Jennifer E. Swanson, Iowa Department of Natural Resources, Boone Wildlife Research Station, 1436 255th St., Boone, Iowa 50036

 ABSTRACT The Iowa Department of Natural Resources conducts nocturnal spotlight surveys from mid-
 March to mid-May, annually. The survey was initiated in 1978 to provide population indices for raccoon
 and white-tailed deer in Iowa. In 2006, the survey was redesigned to provide a systematic statewide
 sample of land cover types available to wildlife and to produce standardized population trends for several
 additional species. The objectives of the survey are 1) to produce annual counts for deer, raccoon, and
 select furbearer species as independent population indices or as supplements to other survey data and 2)
 to monitor the distribution and relative abundance of select species for population management and
 conservation efforts. Spotlight surveys are conducted in all 99 Iowa counties and total ~4,790 mi ( = ~50
 mi/county) of surveyed rural roads. In 2020, a total of 21,585 observations were recorded, with deer (n =
 16,466), raccoon (n = 4,454), opossum (n = 179), striped skunk (n = 173), and house cat (n = 161) being the
 most frequent species observed. Observations for deer, raccoon, skunk, and badger were relatively stable,
 whereas observations decreased for red fox and increased for opossum.

INTRODUCTION
Data capable of estimating wildlife abundance are often difficult, expensive, and time consuming to collect, particularly for
rare or elusive species, or species that exist across large geographic areas. Standardized sampling methods, however, may
provide consistent indices of populations over time. Reliable indices are important for understanding population trends and
the factors affecting populations, including environmental conditions (Progulske and Duerre 1964, Fujisaki et al. 2011),
regulated harvest (Carrillo et al. 2000), and disease (Gehrt et al. 2006). One common method, the nocturnal spotlight
survey, has been used since the mid-20th Century and provides wildlife managers a cost-effective and easily implemented
option to sample wildlife populations (SDDGFP 1950; Anderson 1959). Spotlight counts have been used to produce indices
for species such as opossum (Didelphis virginiana; Gehrt et al. 2006), raccoon (Procyon lotor; Gehrt et al. 2002), red fox
(Vulpes vulpes ; Ruette et al. 2003), and white-tailed deer (Odocoileus virginianus; Rybarczyk 1978, Kaminski et al. 2019).

In 1978, the Iowa Department of Natural Resources (Iowa DNR; formerly the Iowa Conservation Commission) initiated the
Spring Spotlight Survey because of concerns that all-time high raccoon pelt prices threatened an over-harvest and would
negatively impact the sustainability of the population (Rybarczyk 1978). Spotlight routes were established along forested
areas to survey for raccoon, although white-tailed deer were also included. In general, from 1978–1990, 85 spotlight routes
were surveyed across the state, and from 1991–1995, 5 additional routes were added (Appendix A). Because forest cover
may structure raccoon (Pedler et al. 1997, Beasley et al. 2007) and deer (Volk et al. 2007, Walter et al. 2009) populations in
agricultural landscapes, statewide population counts using these data may be biased (McShea et al. 2011). Regardless, the
trends resulting from this survey provided key insight into these growing populations since the 1970s (Appendix B–E).

In 2006, a new survey was developed to address deficiencies in the original design. Rather than using survey routes
perpendicular to forest cover, routes were oriented longitudinally in an east–west direction to achieve a representative
sample of the land cover types across the state. Several species were added to the survey, including badger (Taxidea taxus),
bobcat (Lynx rufus), coyote (Canis latrans), gray (Urocyon cinereoargenteus) and red fox, mink (Mustela vison), opossum,
river otter (Lontra canadensis), striped (Mephitis mephitis) and spotted skunk (Spilogale putorius), weasels (Mustela sp.),
white-tailed jackrabbit (Lepus townsendii), and woodchuck (Marmota monax). The new methodology was tested
concurrently with the original survey and found to result in similar trends with less variability (Iowa DNR, unpublished data).
Therefore, in 2012, the new survey routes were adopted in all 99 Iowa counties. The new survey design results in relatively
large counts for deer, raccoon, opossum, striped skunk, coyote, and red fox. Observations for other species (e.g., gray fox,
bobcat, river otter, mink), however, are more variable because of the secretive nature, low density, or low visibility for

Kaminski et al. (2020) | Iowa Department of Natural Resources 1
animals. Thus, a low count for these species does not necessarily imply low population abundance.

The goal of the Spring Spotlight Survey is to collect reliable, standardized, and long-term counts for select wildlife species
that can be used to inform science-based management decisions in Iowa. The objectives of the survey are 1) to collect
systematic observations for deer, raccoon, and select furbearer species as independent indices for populations or as
supplements to harvest and other survey data collected by the Iowa DNR and 2) to monitor the long-term distribution and
relative abundance of select wildlife species for population management and conservation efforts.

STUDY AREA
The Spring Spotlight Survey is conducted in each of 99 counties in the 56,239-mi2 state of Iowa (Fig. 1). The climate is humid
continental, characterized by hot, humid summers and cold winters. Average annual precipitation ranges from 24.4 inches
in the northwest to 37.2 inches in the southeast (NOAA 2002a). Average annual temperatures ranges from 45.5° F in the
northwest to 50.7° F in the southeast (NOAA 2002b). Land cover consists of agriculture (63%), grass and pastureland (22%),
forest (10%), urban and other developed lands (2%), and wetlands, shallow lakes, and open water (2%; IA DNR 2015).

Figure 1. Spring Spotlight Survey routes (n = 199) in each county of Iowa and 9 regions of the state used for summarizing
spotlight count data.

Kaminski et al. (2020) | Iowa Department of Natural Resources 2
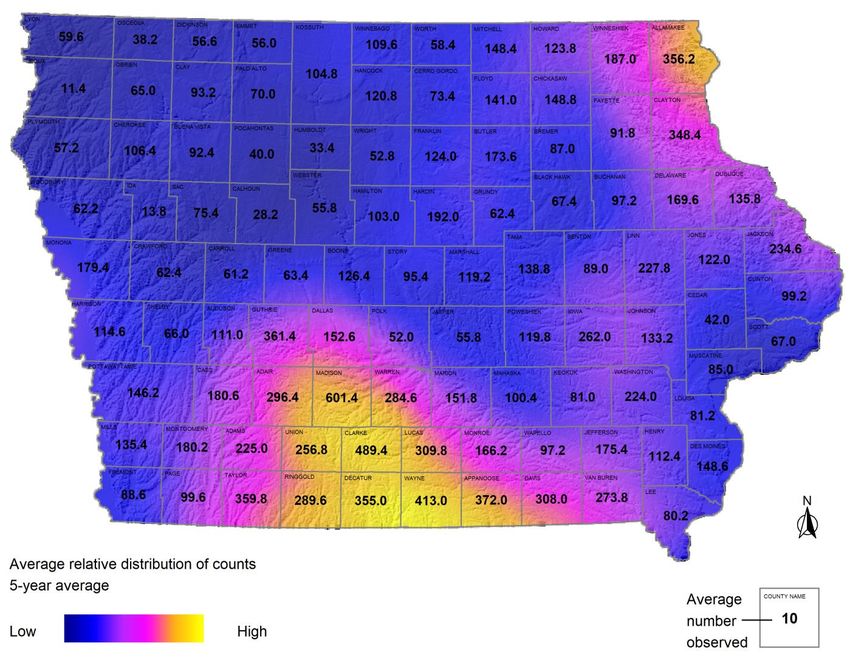
Table 1. Survey year, number of miles surveyed, and total number of animals observed for select species during the Spring Spotlight Survey in Iowa, 2006-
present.
 House
 Year Miles Deer Badger Bobcat Coyote Mink Opossum Raccoon Red fox Skunk
 cat
 2006a 4,293 9,279 9 4 56 9 136 2,417 41 133 15
 2007 4,795 11,284 23 2 49 6 164 2,812 32 143 383
 2008 4,793 13,329 22 5 51 13 118 3,143 46 148 511
 2009 4,784 12,935 15 4 66 11 136 3,219 32 174 405
 2010 4,787 10,888 16 4 53 10 86 3,621 43 217 392
 2011 4,780 11,054 9 4 64 6 85 4,197 55 211 490
 2012 4,788 9,324 9 3 92 11 114 3,282 37 171 599
 2013 4,785 13,069 15 2 94 6 172 3,349 42 140 479
 2014 4,800 11,401 12 3 65 3 88 3,791 28 116 391
 2015 4,790 12,354 12 2 71 1 165 3,569 29 157 338
 2016 4,799 12,522 16 1 110 13 273 3,672 27 144 252
 2017 4,793 13,017 16 4 108 5 297 3,695 38 138 200
 2018 4,790 15,102 18 0 99 2 295 4,683 46 181 209
 2019 4,772 16,490 28 4 89 11 154 5,390 58 194 230
 2020 4,781 15,953 26 8 86 8 179 4,454 24 173 161
a
 In 2006, species other than white-tailed deer and northern raccoon, particularly house cat, were not recorded in all counties and species counts may not
be comparable to subsequent years.

METHODS
The Spring Spotlight Survey is conducted each year, usually after snow-melt and before spring green-up occurs, between
mid-March and mid-May with the date of surveys dependent on local weather conditions and the latitudinal timing of
vegetation leaf-out across the state. Surveys are standardized according to weather conditions (Rybarczyk 1978) and
conducted during periods of no precipitation, wind speed 32° F.
Surveys consist of 2 east–west driving routes, one across each of the northern and southern halves of counties (except
Kossuth County which has 3 routes; n = 199). Routes consist of rural unpaved roads totaling ~4,790 mi statewide ( = 24.1
mi/route, 12.4–45.1 mi; SD=4.3 mi) and are sampled once each spring. Surveys begin 1 hour after sunset and are conducted
at speeds ≤20 mi/hr. Surveys are conducted by 2 observers (1 driver and 1 passenger), both of whom search for wildlife
using a spotlight along their respective side of the road. From 2006–2018, the number and location of animals was recorded
at the observer location using a Global Positioning System (GPS) device. For deer, the distance and bearing to each group of
deer (≥1 individual) were also recorded for estimating deer density across the state. Beginning in 2019, observations were
recorded digitally (e.g., smart phones, tablets) in a geospatial database (ArcCollector; Environmental Systems Research
Institute, Redlands, CA) which allowed for collection of more precise wildlife locations and increased survey efficiency.

We summarized long-term trends for spotlight counts across 9 regions of Iowa (Fig. 1) and statewide for species with
typically ≥5 observations recorded per year. We standardized counts as the number of animals observed per 100 miles
surveyed to account for annual differences in the number of miles surveyed (e.g., road closures). Because animal counts
may vary annually, we further estimated the 5-year average relative distribution of counts to contextualize annual
observations with recent trends and to map the relative distribution of species across the state. We interpolated the
average distribution of counts for the most recent 5 years using inverse distance weighting (IDW; function gstat in Program
R 3.6.1; R Core Team 2019) and 9 nearest neighbors. To determine the IDW power used to weight nearest neighbors for
each species, we iteratively tested power values from 0.2–5.0 in 0.2 increments and estimated the root mean square error
(RMSE) for each IDW estimate. We selected the power value from the IDW estimate with the lowest RMSE for producing
the final IDW map. We further averaged the final IDW map using a focal analysis (function focal in Program R) and a 29.8-mi
moving window to produce a smoother and more readily interpretable trend surface across Iowa.

Kaminski et al. (2020) | Iowa Department of Natural Resources 3
RESULTS
In 2020, 4,781 mi of rural roads were surveyed across all 99 Iowa counties. In total, 21,585 animal observations were
recorded, with deer, raccoons, opossums, and skunks being the most frequent species observed (Table 1; Fig. 2–39). No
observations of jackrabbit, otter, or weasel were recorded.

The number of deer observed statewide was similar to 2019. Previously, the long-term trend was relatively stable, although
since 2014, deer counts have gradually increased (Fig. 2). Deer were observed at a rate of 3.4 deer/mi statewide (same as
2019), with the highest counts in the south-central, SW, and NE regions (Fig. 4). Deer counts have remained relatively stable
across most regions, except the south- and north-central regions where counts have increased during the past 10 years, and
the SE region which recorded an increase in 2020 compared with past years.

The number of raccoons observed declined slightly in 2020, although remained above the long-term average ( = 3,686; Fig.
24). All regions of the state recorded decreased observations compared with 2019, except the SW region which recorded
increased counts similar to 2018 (Fig. 26).

Observations for bobcat reached an all-time high in 2020 (n = 8; Fig. 11), although counts are generally low for the species.
Opossum observations increased in 2020 and the statewide count was similar to their long-term average ( = 164; Fig. 20).
Badger observations were similar to 2019 and remained above their long-term average ( = 16; Fig. 7). Skunk observations
declined slightly in 2020 (Fig. 32), although were similar to the past 2 years. Coyote observations declined in 2020 which
continued a 5-year decline in the number counted (Fig. 13). Mink observations also declined, however, counts have
regularly fluctuated during the past 15 years (Fig. 17). Most notably, red fox observations declined 58% following an all-time
high count in 2019 (Fig. 28). The 2020 count represents the lowest number of red fox observed since 2006, when the
species was added to the survey.

DISCUSSION
The number of deer observed statewide in 2020 declined 3% compared with 2019. During the summer of 2019, an
outbreak of epizootic hemorrhagic disease (EHD) resulted in a relatively high number of reported deer mortalities in south-
central Iowa. Epizootic hemorrhagic disease is a naturally occurring viral disease that is transmitted to deer by biting
midges, particularly during drought years, and causes fever, dehydration, and occasionally death. The occurrence of EHD
likely reduced the fall deer population and resulted in decreased encounters with deer by hunters (Harms et al. 2019) and
reduced harvest in the region in 2019 (18,998 harvested deer reported; 19% decline from 2018). However, spotlight counts
indicated that the effects of EHD on the spring population was marginal compared with the observed declines in the
previous fall. The spring spotlight count in south-central Iowa (n = 3,935 deer) was only 8% lower than in 2019 (n = 4,281)
and 11% above the previous 5-year average ( = 3,531). In Warren County, which had the most EHD-related deer
mortalities reported (773 deer) and a 31% decline in reported harvest, the 2020 spotlight count (n = 437) increased 60%
compared with 2019 (n = 273). In Madison County, which had the second most reported mortalities (160 deer), the 2020
spotlight count (n = 546) was similar to the previous 5-year average ( = 590) and 20% higher than the long-term average (
= 438). Therefore, it is likely that EHD-related mortality was offset in-part by lowered fall harvest in the region and the
number of deer surviving to spring was comparable to previous years. Overall, white-tailed deer have a high reproductive
capacity in agricultural landscapes and mature female deer typically produce 2 fawns annually in Iowa (Iowa DNR,
unpublished data). Considering these numbers it is likely that the fall harvest will rebound to previous levels in south-
central Iowa pending favorable weather conditions remain for deer through summer and for hunters in fall.

Raccoon observations decreased in 2020 following two years of increased counts. Increased raccoon counts coincided with
lower trapping license sales in Iowa and lower pelt values in the fur market (Evelsizer 2018). The reason for the decreased
count in 2020 is unclear and may be a result of variability inherent in our survey method, variability in spring weather
conditions, realized population declines related to disease (e.g., canine distemper virus), or other undetermined factors.
Overall, the decline was not significantly lower than in 2019 and counts remained above the long-term average.

The most notable change in spotlight counts occurred for red fox in which counts decreased 58% from 2019. The 2019
count was atypically high compared to previous years and a decreased count in 2020 was not unexpected because red fox
counts have regularly fluctuated during the past 15 years. However, the magnitude of this decline was surprising
considering that archery hunter observations and reported harvest were mostly stable in 2019 (Harms et al. 2019, Iowa

Kaminski et al. (2020) | Iowa Department of Natural Resources 4
DNR unpublished data). Spotlight detections for red fox are challenging to collect due to their small size and evasive
behavior (Ruette et al. 2003), and as a result some inherent variability exists in these data. Overall, the red fox count was
39% below the long-term average and similar to observed lows in 2014 and 2016. It is unclear why record high and low
counts for red fox were observed during the past two spotlight surveys or whether a similar decline will be observed in the
archery hunter survey or reported harvest in 2020. Additional analyses are needed to better understand how red fox
observations vary with annual weather conditions (e.g., winter severity, spring temperature).

Alternatively, bobcat counts reached an all-time high in 2020 (n = 8). Despite stable and expanding populations in the state,
bobcat observations remain low using spotlighting methods. Bobcat tend to be secretive and elusive, and their association
with forest cover may limit our ability to observe individuals. The state archery hunter survey likely provides a more reliable
index for bobcat populations and indicates stable to growing populations in all regions of the state (Harms et al. 2019).

Opossums are sensitive to winter temperatures (Gillette 1980, Gehrt et al. 2006) and spring spotlight counts for opossum
are negatively correlated with winter weather severity (r = -0.60; Boustead et al. 2015). Opossum populations, however,
have the ability to rebound quickly following severe winters because females are capable of producing 2 litters per year
consisting of a large number of young (13 joeys/litter; Gipson and Kamler 2001). For example, in 2014, the opossum count
was the third lowest since 2006, which coincided with the 6th coldest and 14th wettest winter in recorded history in Iowa
(Hillaker 2014). Alternatively, opossum counts increased 70% in 2016 following above normal temperatures in February and
March that ranked in the upper 25th percentile of historical records for their respective months (Hillaker 2014). In 2019,
opossum counts declined 48% following a severe winter (Glisan 2019), however, counts in 2020 responded positively likely
as a result of mild winter conditions during January and February (Glisan 2020) and increased survival of adults into spring.

Observations for coyote have steadily declined during the past 5-years, although the 2020 count remained above the long-
term average ( = 77). During the past 5 years, all-time record high harvests have been reported for coyotes. Coyotes rank
first and second of all species pursued by Iowa trappers and predator hunters in terms of effort or time afield (Iowa DNR,
unpublished data). It is unclear whether low raccoon pelt prices have increased harvest pressure on coyotes or whether
some other mechanism (e.g., disease) has affected populations. Archery hunter observations for coyotes similarly declined
in 6 of 9 regions in 2019, although the long-term trends are stable to increasing (Harms et al. 2019).

Both badger and skunk observations remained relatively stable in 2020. Badger are considered a species of greatest
conservation need (SGCN) throughout much of the Midwest, USA, and their status as a SGCN is being evaluated in Iowa as
well. Badger observations are generally low and the 2019 and 2020 counts represent a 2-year high for the species.
Alternatively, skunk observations during the past 15 years have gradually fluctuated. The 2019 count was similar to the high
count in 2011, after which, counts steadily declined for the subsequent 3 years. It is unclear if the marginal decline
observed in 2020 represents a similar trend and whether continued declines will be observed during the next few years.
Overall, spotlight surveys for mustelids (e.g., badger, skunk, mink, weasel) are challenging because spotlighting is most
effective for species that are readily detectable by eye shine (e.g., deer, raccoon). Mustelids are rarely identified by eye
shine and must be close to the observer for detection (Gehrt et al. 2006). Regardless, spotlight counts provide independent
and consistent indices for populations and are an important component of furbearer management in the state.

The spotlight survey provides one of the only indices for mink in Iowa and indicates that populations fluctuate every 3–4
years. However, mink observations are rare because surveys are not focused on riparian or wetland areas typical of mink
habitat use. Reliable population trends for mink are possible using spotlight observations, however, annual counts may be
highly variable (Waller 2010) and are typically low for our survey ( = 7.7).

For this survey house cats are defined as free-ranging domestic cats located in rural areas unconfined and away from
farmsteads and human developments (e.g., feral cats). Observations for house cats have declined 73% since 2012. A similar
pattern was observed for archery hunter observations, although the reason for these declines is unclear and may be related
to several interacting factors (e.g., disease, predation, or declining rural human populations; Warner 1985). Predation by
house cats on native fauna poses a serious conservation concern in North America, particularly for birds and small
mammals (Dauphine and Cooper 2009). The effect of potentially declining rural cat populations on native fauna remains
unknown, although declining cat populations is likely beneficial for several wildlife taxa across the state.

Kaminski et al. (2020) | Iowa Department of Natural Resources 5
MANAGEMENT IMPLICATIONS
The Spring Spotlight Survey provides consistent long-term population indices for several wildlife species in Iowa. Population
trends derived from the survey are critical for monitoring populations and informing science-based management decisions.
When paired with long-term harvest and other survey data, the development of population abundance or growth models
may be possible and provide more robust metrics for evaluating populations in the future.

ACKNOWLEDGMENTS
We thank all current and past Iowa DNR staff and volunteers who traveled thousands of miles of gravel roads across the
state, often until early morning hours, to complete the Spring Spotlight Survey each year. We appreciate the opportunity to
present these data on their behalf. W. J. Suchy (former Iowa DNR Wildlife Research Section supervisor) developed the
current study design for the Spring Spotlight Survey; we appreciate his efforts to expand the survey statewide and across
multiple species taxa to improve the quality of the data collected.

LITERATURE CITED
Anderson, CF, Jr. 1959. Nocturnal activities of the Columbia black-tailed deer (Odocoileus heminous columbianus
 Richardson) affecting spotlight census results in the Oregon coast range. Thesis, Oregon State College, Corvallis, USA.
Beasley, JC, TL Devault, OE Rhodes, Jr. 2007. Home-range attributes for raccoons in a fragmented agricultural region of
 northern Indiana. Journal of wildlife Management 71:844–850.
Boustead, BEM, SD Hilberg, MD Shulski, and KG Hubbard. 2015. The accumulated winter season severity index (AWSSI).
 Journal of Applied Meterology and Climatology 54:1693–1712.
Dauphine, N, and RJ Cooper. 2009. Impacts of free-ranging domestic cats (Felis catus) on birds in the United States: A
 review of recent research with conservation and management recommendations. Proceedings of the Fourth
 International Partners in Flight conference: Tundra to Tropics 205–219.
Evelsizer, V. 2018. Furbearers. Pages 62–116 in P. Fritzell, editor. Trends in Iowa wildlife populations and harvest 2017–
 2018. Iowa Department of Natural Resources, Boone Wildlife Research Station, Boone, USA.
Fujisaki, I, FJ Mazzotti, RM Dorazio, KG Rice, M Cherkiss, and B Jeffery. 2011. Estimating trends in alligator populations from
 nightlight survey data. Wetlands 31:147–155.
Gehrt, SD, GF Hubert, Jr., and JA Ellis. 2002. Long-term population trends of raccoons in Illinois. Wildlife Society Bulletin
 30:457–463.
Gehrt, SD, GF Hubert, Jr., and JA Ellis. 2006. Extrinsic effects on long-term population trends of Virginia opossums and
 striped skunks at large spatial scales. American Midland Naturalist 155:168–180.
Gillette, LN. 1980. Movement patterns of radio-tagged opossums in Wisconsin. The American Midland Naturalist 140:1–12.
Gipson, PS, and JF Kamler. 2001. Survival and home ranges of opossums in northeastern Kansas. The Southwestern
 Naturalist 46:178–182.
Glisan, J. 2019. Iowa monthly weather summary – February 2019. Iowa Department of Agriculture & Land Stewardship, Des
 Moines, USA.
Glisan, J. 2020. Iowa monthly weather summary – January 2020. Iowa Department of Agriculture & Land Stewardship, Des
 Moines, USA.
Harms, TM, JM Coffey, and VD Evelsizer. Iowa Bow Hunter Observation Survey: 2019 summary. Iowa Department of Natural
 Resources, Boone, USA.
Hillaker, HJ. 2014. Iowa annual weather summary – 2014. Iowa Department of Agriculture & Land Stewardship, Des Moines,
 USA.
IA DNR [Iowa Department of Natural Resources]. 2015. Iowa wildlife action plan: securing a future for fish and wildlife. Iowa
 Department of Natural Resources, Des Moines, USA.
Johnson, CJ, SE Nielsen, EH Merrill, TL McDonald, and MS Boyce. 2006. Resource selection functions based on use-
 availability data: theoretical motivation and evaluation methods. Journal of Wildlife Management 70:347–357.
Kaminski, DJ, TM Harms, and JM Coffey. 2019. Using spotlight observations to predict resource selection and abundance for
 white-tailed deer. Journal of Wildlife Management 83:1565–1580.

Kaminski et al. (2020) | Iowa Department of Natural Resources 6
McShea, WJ, CM Stewart, L Kearns, and S Bates. 2011. Road bias for deer density estimates at 2 national parks in Maryland.
 Wildlife Society Bulletin 35:177–184.
NOAA [National Oceanic and Atmospheric Administration]. 2002a. Section 2: Precipitation. National Oceanic and
 Atmospheric Administration, National Climatic Data Center, Climatography of the United States No. 85:1–71.
NOAA [National Oceanic and Atmospheric Administration]. 2002b. Section 1: Temperature. National Oceanic and
 Atmospheric Administration, National Climatic Data Center, Climatography of the United States No. 85:1–69.
Pedler, JH, L Fahrig, and HG Merriam. 1997. Raccoon habitat use at 2 spatial scales. Journal of Wildlife Management
 61:102–112.
Progulske, DR, and DC Duerre. 1964. Factors influencing spotlighting counts of deer. Journal of Wildlife Management 28:27–
 34.
R Core Team. 2019. R: a language and environment for statistical computing. R Foundation for Statistical Computing,
 Vienna, Austria.
Ruette, S, S Philippe, and M Albaret. 2003. Applying distance-sampling methods to spotlight counts of red fox. Journal of
 Applied Ecology 40:32–43.
Rybarczyk, WB. 1979. Evaluation of a spotlight survey technique as an index to Iowa white-tailed deer (Odocoileus
 virginianus) and raccoon (Procyon lotor) populations. Thesis, Iowa State University, Ames, USA.
SDDGFP [South Dakota Department of Game, Fish and Parks]. 1950. 1949 Spotlight Observations in the Black Hills. South
 Dakota Game Report. Project 12-R-7. Division of Wildlife, South Dakota Department of Game, Fish and Parks, Pierre,
 USA.
Volk, MD, DW Kaufman, and GA Kaufman. 2007. Diurnal activity and habitat associations of white-tailed deer in tallgrass
 prairie of eastern Kansas. Transactions of the Kansas Academy of Science 110:145–154.
Waller, M. 2010. Evaluation of spotlight surveys for monitoring mink populations in coastal South Carolina. Thesis, Clemson
 University, South Carolina, USA.
Walter, WD, KC VerCauteren, H Campa III, WR Clark, JW Fischer, SE Hygnstrom, NE Mathews, CK Nielsen, EM Schauber, TR
 Van Deelen, and SR Winterstein. 2009. Regional assessment on influence of landscape configuration and connectivity on
 range size of white-tailed deer. Landscape Ecology 24:1405–1420.
Warner, RE. 1985. Demography and movements of free-ranging domestic cats in rural Illinois. Journal of Wildlife
 Management 49:340–346.

Kaminski et al. (2020) | Iowa Department of Natural Resources 7
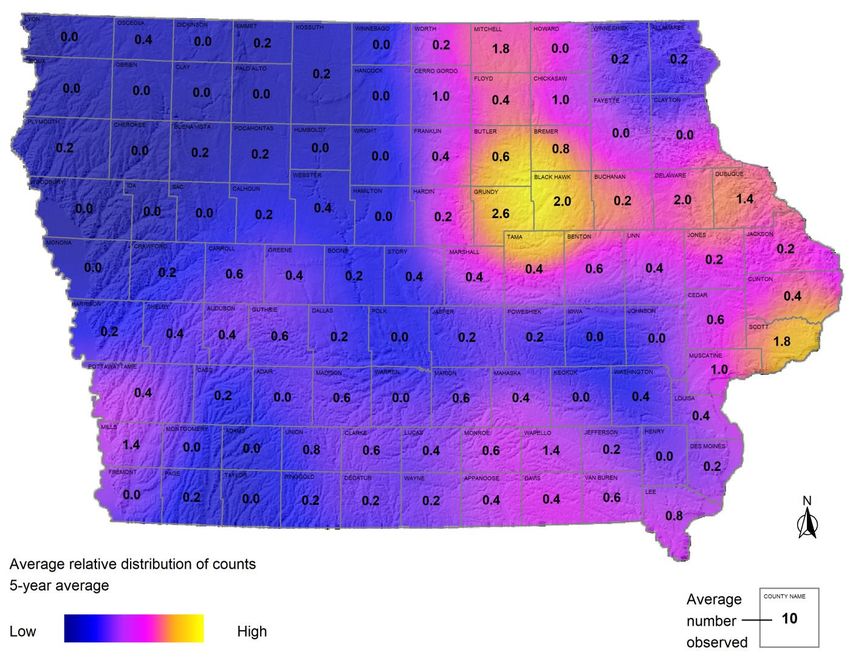
Figure 2. Average white-tailed deer observations per 100 miles surveyed during the Iowa Spring Spotlight Survey, 2006–
2020. Error bars indicate 95% confidence intervals. Dashed line indicates the reported statewide buck harvest.

Figure 3. Total number of white-tailed deer observations per county during the Iowa Spring Spotlight Survey, 2020. Color
shading indicates the number of animals counted per mile surveyed (OPMS).

Kaminski et al. (2020) | Iowa Department of Natural Resources 8
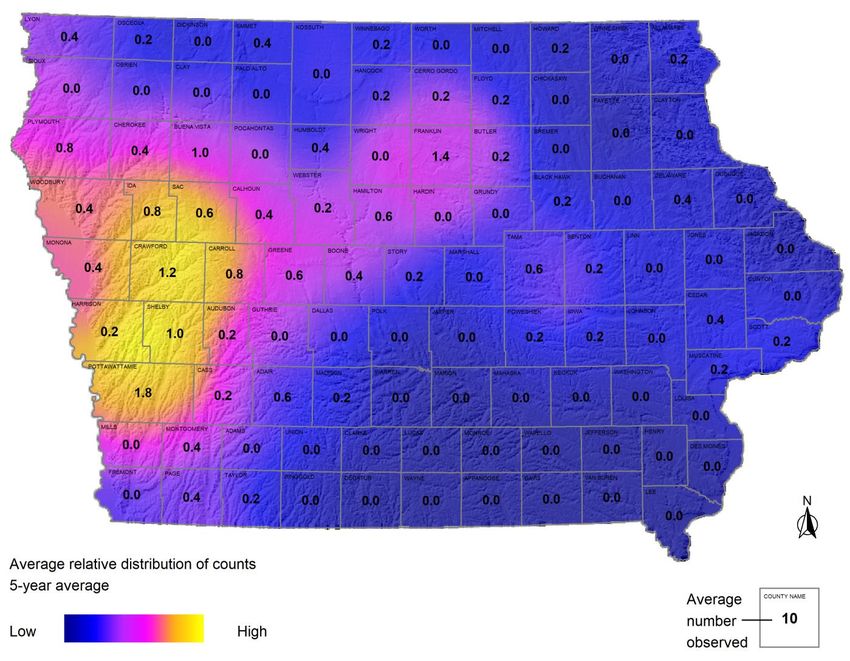
Figure 4. Average white-tailed deer observations per 100 miles surveyed during the Spring Spotlight Survey for nine regions
of Iowa, 2006–2020. Error bars indicate 95% confidence intervals.

Kaminski et al. (2020) | Iowa Department of Natural Resources 9
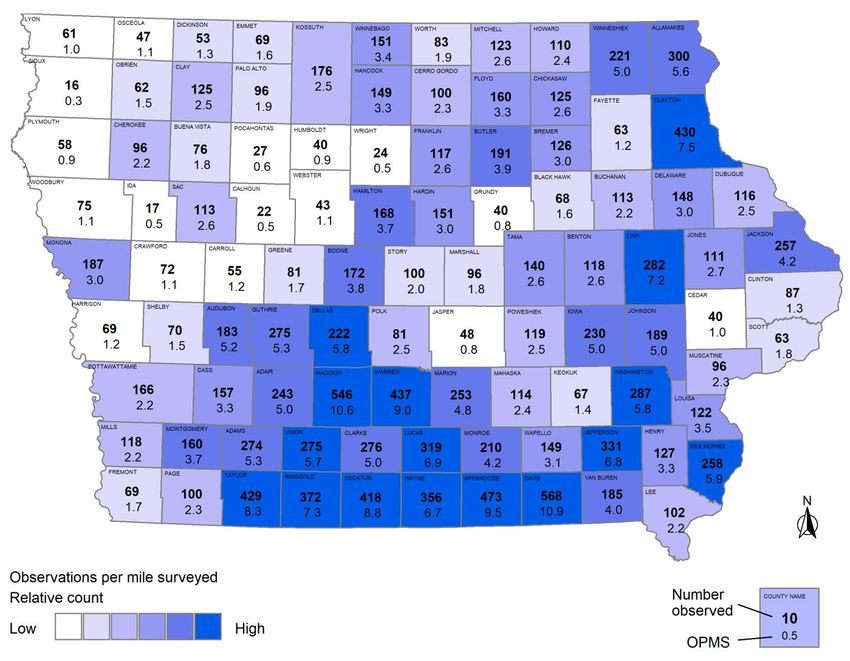
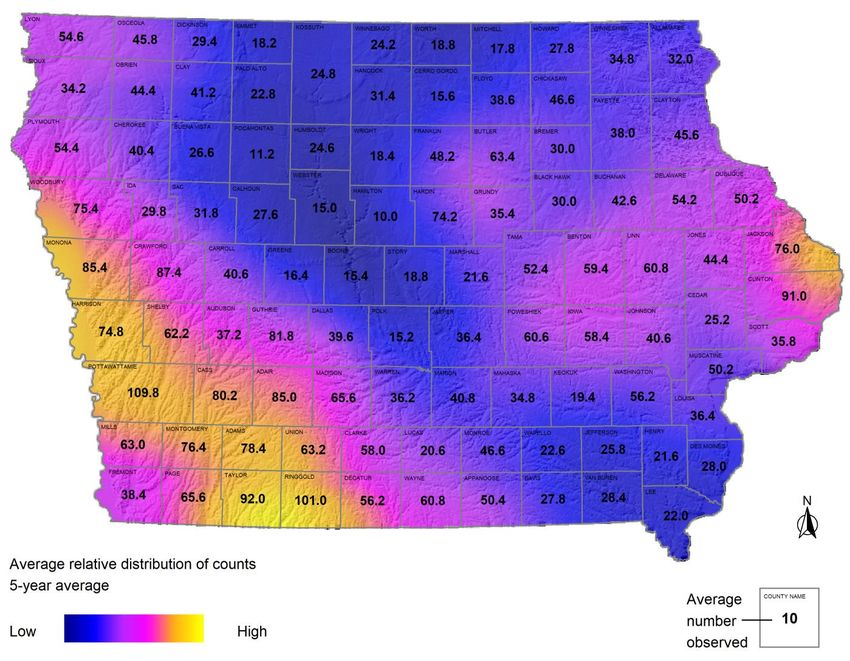
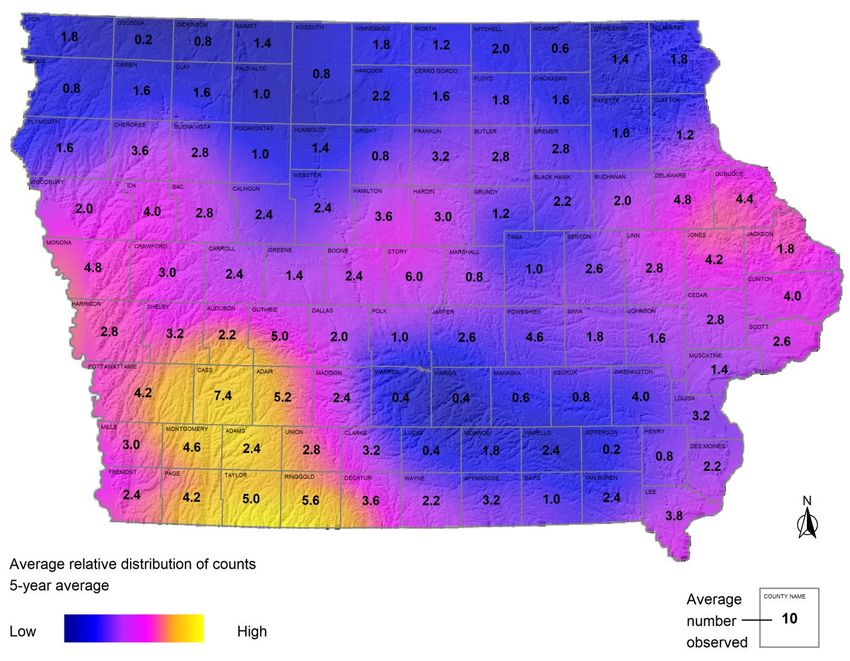
Figure 5. Average relative distribution of spring spotlight observations for white-tailed deer during the past 5 years in Iowa.
The number of observations per county is relative to the highest and lowest number of observations across all counties
during the survey and may not represent an over- or under-abundance of the species (i.e., high counts are considered high
relative to those observed in all other counties).

Kaminski et al. (2020) | Iowa Department of Natural Resources 10
Figure 6. Habitat suitability (i.e., relative probability of use) for white-tailed deer in Iowa based on a resource selection
function (RSF; see Kaminski et al. [2019] for details). The RSF model was predicted using spotlight observations for deer
from 2012–2016 and the accuracy of the model was tested using 2017 observations (R2 = 0.95). High values indicate areas
of higher relative habitat quality for deer and low values indicate lower habitat quality.

Kaminski et al. (2020) | Iowa Department of Natural Resources 11
Figure 7. Average badger observations per 100 miles surveyed during the Iowa Spring Spotlight Survey, 2006–2020. Error
bars indicate 95% confidence intervals. Dashed line indicates the reported statewide harvest.

Figure 8. Total number of badger observations per county during the Iowa Spring Spotlight Survey, 2020. Color shading
indicates the number of animals counted per mile surveyed (OPMS).

Kaminski et al. (2020) | Iowa Department of Natural Resources 12
Figure 9. Average badger observations per 100 miles surveyed during the Spring Spotlight Survey for nine regions of Iowa,
2006–2020. Error bars indicate 95% confidence intervals.

Kaminski et al. (2020) | Iowa Department of Natural Resources 13
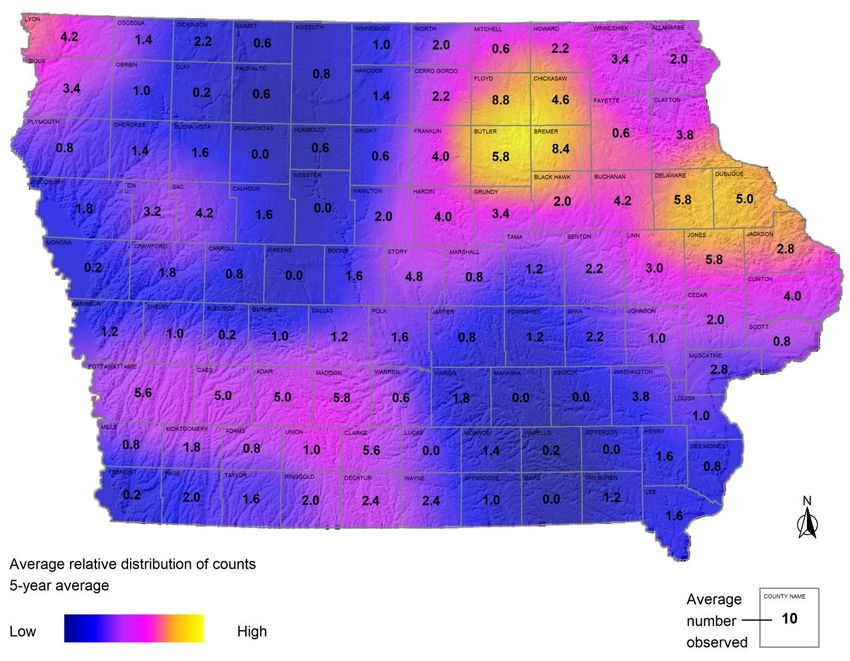
Figure 10. Average relative distribution of spring spotlight observations for badger during the past 5 years in Iowa. The
number of observations per county is relative to the highest and lowest number of observations across all counties during
the survey and may not represent an over- or under-abundance of the species (i.e., high counts are considered high relative
to those observed in all other counties).

Kaminski et al. (2020) | Iowa Department of Natural Resources 14
Figure 11. Average bobcat observations per 100 miles surveyed during the Iowa Spring Spotlight Survey, 2006–2020. Error
bars indicate 95% confidence intervals. Dashed line indicates the reported statewide harvest.

Kaminski et al. (2020) | Iowa Department of Natural Resources 15
Figure 12. Average bobcat observations per 100 miles surveyed during the Spring Spotlight Survey for nine regions of Iowa,
2006–2020. Error bars indicate 95% confidence intervals.

Kaminski et al. (2020) | Iowa Department of Natural Resources 16
Figure 13. Average coyote observations per 100 miles surveyed during the Iowa Spring Spotlight Survey, 2006–2020. Error
bars indicate 95% confidence intervals. Dashed line indicates the reported statewide harvest.

Figure 14. Total number of coyote observations per county during the Iowa Spring Spotlight Survey, 2020. Color shading
indicates the number of animals counted per mile surveyed (OPMS).

Kaminski et al. (2020) | Iowa Department of Natural Resources 17
Figure 15. Average coyote observations per 100 miles surveyed during the Spring Spotlight Survey for nine regions of Iowa,
2006–2020. Error bars indicate 95% confidence intervals.

Kaminski et al. (2020) | Iowa Department of Natural Resources 18
Figure 16. Average relative distribution of spring spotlight observations for coyote during the past 5 years in Iowa. The
number of observations per county is relative to the highest and lowest number of observations across all counties during
the survey and may not represent an over- or under-abundance of the species (i.e., high counts are considered high relative
to those observed in all other counties).

Kaminski et al. (2020) | Iowa Department of Natural Resources 19
Figure 17. Average mink observations per 100 miles surveyed during the Iowa Spring Spotlight Survey, 2006–2020. Error
bars indicate 95% confidence intervals. Dashed line indicates the reported statewide harvest.

Figure 18. Total number of mink observations per county during the Iowa Spring Spotlight Survey, 2020. Color shading
indicates the number of animals counted per mile surveyed (OPMS).

Kaminski et al. (2020) | Iowa Department of Natural Resources 20
Figure 19. Average mink observations per 100 miles surveyed during the Spring Spotlight Survey for nine regions of Iowa,
2006–2020. Error bars indicate 95% confidence intervals.

Kaminski et al. (2020) | Iowa Department of Natural Resources 21
Figure 20. Average opossum observations per 100 miles surveyed during the Iowa Spring Spotlight Survey, 2006–2020. Error
bars indicate 95% confidence intervals. Dashed line indicates the reported statewide harvest.

Figure 21. Total number of opossum observations per county during the Iowa Spring Spotlight Survey, 2020. Color shading
indicates the number of animals counted per mile surveyed (OPMS).

Kaminski et al. (2020) | Iowa Department of Natural Resources 22
Figure 22. Average opossum observations per 100 miles surveyed during the Spring Spotlight Survey for nine regions of
Iowa, 2006–2020. Error bars indicate 95% confidence intervals.

Kaminski et al. (2020) | Iowa Department of Natural Resources 23
Figure 23. Average relative distribution of spring spotlight observations for opossum during the past 5 years in Iowa. The
number of observations per county is relative to the highest and lowest number of observations across all counties during
the survey and may not represent an over- or under-abundance of the species (i.e., high counts are considered high relative
to those observed in all other counties).

Kaminski et al. (2020) | Iowa Department of Natural Resources 24
Figure 24. Average raccoon observations per 100 miles surveyed during the Iowa Spring Spotlight Survey, 2006–2020. Error
bars indicate 95% confidence intervals. Dashed line indicates the reported statewide harvest.

Figure 25. Total number of raccoon observations per county during the Iowa Spring Spotlight Survey, 2020. Color shading
indicates the number of animals counted per mile surveyed (OPMS).

Kaminski et al. (2020) | Iowa Department of Natural Resources 25
Figure 26. Average raccoon observations per 100 miles surveyed during the Spring Spotlight Survey for nine regions of Iowa,
2006–2020. Error bars indicate 95% confidence intervals.

Kaminski et al. (2020) | Iowa Department of Natural Resources 26
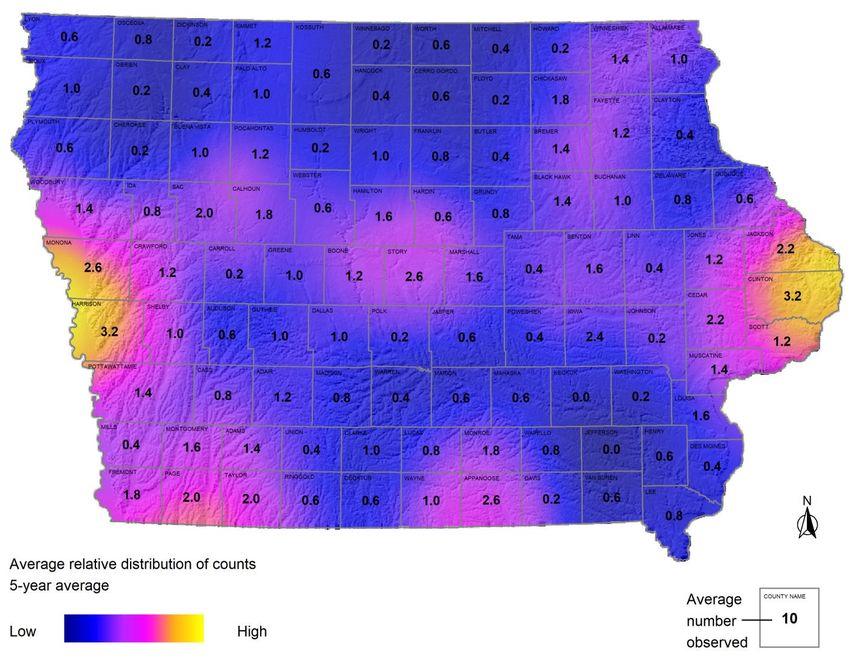
Figure 27. Average relative distribution of spring spotlight observations for raccoon during the past 5 years in Iowa. The
number of observations per county is relative to the highest and lowest number of observations across all counties during
the survey and may not represent an over- or under-abundance of the species (i.e., high counts are considered high relative
to those observed in all other counties).

Kaminski et al. (2020) | Iowa Department of Natural Resources 27
Figure 28. Average red fox observations per 100 miles surveyed during the Iowa Spring Spotlight Survey, 2006–2020. Error
bars indicate 95% confidence intervals. Dashed line indicates the reported statewide harvest.

Figure 29. Total number of red fox observations per county during the Iowa Spring Spotlight Survey, 2020. Color shading
indicates the number of animals counted per mile surveyed (OPMS).

Kaminski et al. (2020) | Iowa Department of Natural Resources 28
Figure 30. Average red fox observations per 100 miles surveyed during the Spring Spotlight Survey for nine regions of Iowa,
2006–2020. Error bars indicate 95% confidence intervals. Red fox includes observations listed as “fox” due to the rarity of
gray fox in the state.

Kaminski et al. (2020) | Iowa Department of Natural Resources 29
Figure 31. Average relative distribution of spring spotlight observations for red fox during the past 5 years in Iowa. The
number of observations per county is relative to the highest and lowest number of observations across all counties during
the survey and may not represent an over- or under-abundance of the species (i.e., high counts are considered high relative
to those observed in all other counties).

Kaminski et al. (2020) | Iowa Department of Natural Resources 30
Figure 32. Average striped skunk observations per 100 miles surveyed during the Iowa Spring Spotlight Survey, 2006–2020.
Error bars indicate 95% confidence intervals. Dashed line indicates the reported statewide harvest.

Figure 33. Total number of striped skunk observations per county during the Iowa Spring Spotlight Survey, 2020. Color
shading indicates the number of animals counted per mile surveyed (OPMS). Counts likely include few or no spotted skunk
observations due to their rarity in the state.

Kaminski et al. (2020) | Iowa Department of Natural Resources 31
Figure 34. Average skunk observations per 100 miles surveyed during the Spring Spotlight Survey for nine regions of Iowa,
2006–2020. Error bars indicate 95% confidence intervals. Skunk includes all observations recorded as “striped skunk” and
“skunk” and likely includes none or few spotted skunk observations due to the rarity of the species in the state.

Kaminski et al. (2020) | Iowa Department of Natural Resources 32
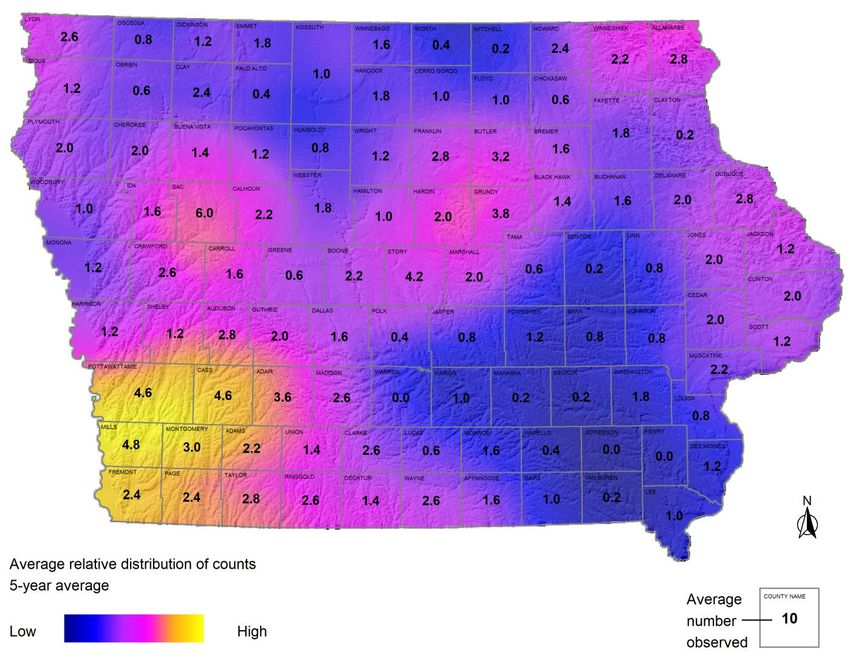
Figure 35. Average relative distribution of spring spotlight observations for skunk during the past 5 years in Iowa. The
number of observations per county is relative to the highest and lowest number of observations across all counties during
the survey and may not represent an over- or under-abundance of the species (i.e., high counts are considered high relative
to those observed in all other counties). Counts likely include few or no spotted skunk observations due to their rarity in the
state.

Kaminski et al. (2020) | Iowa Department of Natural Resources 33
Figure 36. Average free-ranging house cat observations per 100 miles surveyed during the Iowa Spring Spotlight Survey,
2006–2020. Error bars indicate 95% confidence intervals. Observations were not recorded in most counties during 2006.

Figure 37. Total number of free-ranging house cat observations per county during the Iowa Spring Spotlight Survey, 2020.
Cats located at farmsteads not included in counts. Color shading indicates the number counted per mile surveyed (OPMS).

Kaminski et al. (2020) | Iowa Department of Natural Resources 34
Figure 38. Average free-ranging house cat observations per 100 miles surveyed during the Spring Spotlight Survey for nine
regions of Iowa, 2006–2020. Error bars indicate 95% confidence intervals. Cats located at farmsteads or human
developments were not included in counts. Observations were not recorded in most counties during 2006.

Kaminski et al. (2020) | Iowa Department of Natural Resources 35
Figure 39. Average relative distribution of spring spotlight observations for house cat during the past 5 years in Iowa. The
number of observations per county is relative to the highest and lowest number of observations across all counties during
the survey and may not represent an over- or under-abundance of the species (i.e., high counts are considered high relative
to those observed in all other counties). House cats located at farmsteads or human developments were not included in
counts.

Kaminski et al. (2020) | Iowa Department of Natural Resources 36
APPENDICES

 IOWA SPRING SPOTLIGHT SURVEY RESULTS FOR
 WHITE-TAILED DEER AND NORTHERN RACCOON, 1978–2011

Kaminski et al. (2020) | Iowa Department of Natural Resources 37
APPENDIX A

Appendix A. Regions used for summarizing Spring Spotlight Survey observations in Iowa and historical Spring Spotlight
Survey routes sampled from 1978–2011.

Kaminski et al. (2020) | Iowa Department of Natural Resources 38
APPENDIX B

Appendix B. Statewide average white-tailed deer observations per mile surveyed during the Iowa Spring Spotlight Survey,
1978–2011. Observations were standardized by mile surveyed to account for regions in which counties were not surveyed.
Error bars indicate 95% confidence intervals. Numbers above error bars indicate the number of transects surveyed each
year.

Kaminski et al. (2020) | Iowa Department of Natural Resources 39
APPENDIX C

Appendix C. Average white-tailed deer observations per mile surveyed during the Iowa Spring Spotlight Survey, 1978–2011.
Observations were standardized by mile surveyed to account for regions in which counties were not surveyed. Error bars
indicate 95% confidence intervals. Numbers above error bars indicate the number of transects surveyed each year. Note,
surveys were conducted linearly along forested habitats and not standardized by amount of available habitat in each
region; thus, cross-regional comparisons should be considered with caution as data represents the relative change in
species abundance within each region.

Kaminski et al. (2020) | Iowa Department of Natural Resources 40
APPENDIX D

Appendix D. Average raccoon observations per mile surveyed during the Iowa Spring Spotlight Survey, 1978–2011.
Observations were standardized by mile surveyed to account for variable number of transects surveyed each year. Error
bars indicate 95% confidence intervals. Numbers above error bars indicate the number of transects surveyed each year.

Kaminski et al. (2020) | Iowa Department of Natural Resources 41
APPENDIX E

Appendix E. Average raccoon observations per mile surveyed during the Iowa Spring Spotlight Survey, 1978–2011.
Observations were standardized by mile surveyed to account for regions in which counties were not surveyed. Error bars
indicate 95% confidence intervals. Numbers above error bars indicate the number of transects surveyed each year. Note,
surveys were conducted linearly along forested habitats and not standardized by amount of available habitat in each
region; thus, cross-regional comparisons should be considered with caution as data represents the relative change in
species abundance within each region.

Kaminski et al. (2020) | Iowa Department of Natural Resources 42
You can also read